Google Cloud Platform is very, very cool. It’s a fully capable, enterprise-grade, scalable cloud ecosystem which lets even total novices get started with building their first cloud applications. I wrote a long guide for installing Snowplow on the GCP, and you might want to read that if you want to see how you can build your own analytics tool using some nifty open-source modules.
But this guide will not be about Snowplow. Rather, it will tackle Google’s own open-source performance audit tool: Lighthouse.
With this guide, you’ll be able to build your own Google Cloud project, using Lighthouse to audit any number of sites you like, and write the results into storage and a BigQuery table!
You can try Lighthouse in your Chrome browser right now. Just follow the instructions here to see how you can enable the Audit tool in DevTools.
One of the limitations of the DevTools feature is that you can only run it on one site at a time, and only through your web browser. I wanted to build something that lets me audit a whole bunch of sites, and automate it as well. For that reason, I wrote an extremely simple Node.js app, multisite-lighthouse which fulfils these requirements. Simply by editing a configuration file and then running the script, you can run an audit against multiple sites, and the results will be written in a local folder.
So that was fun. But then I got a bit more ambitious. Would it be possible to run this app in a serverless cloud environment, and have the results be written in a database or storage somewhere, where they can be queried and fetched at leisure?
Well, sure! In this guide, I’ll walk you through how to run a Node.js application in a GCP Cloud Function, which writes the results into a BigQuery table, and stores the reports into a Cloud Storage bucket. Oh, and it’s practically free.
The Simmer Newsletter
Follow this link to subscribe to the Simmer Newsletter! Stay up-to-date with the latest content from Simo Ahava and the Simmer online course platform.
How it works
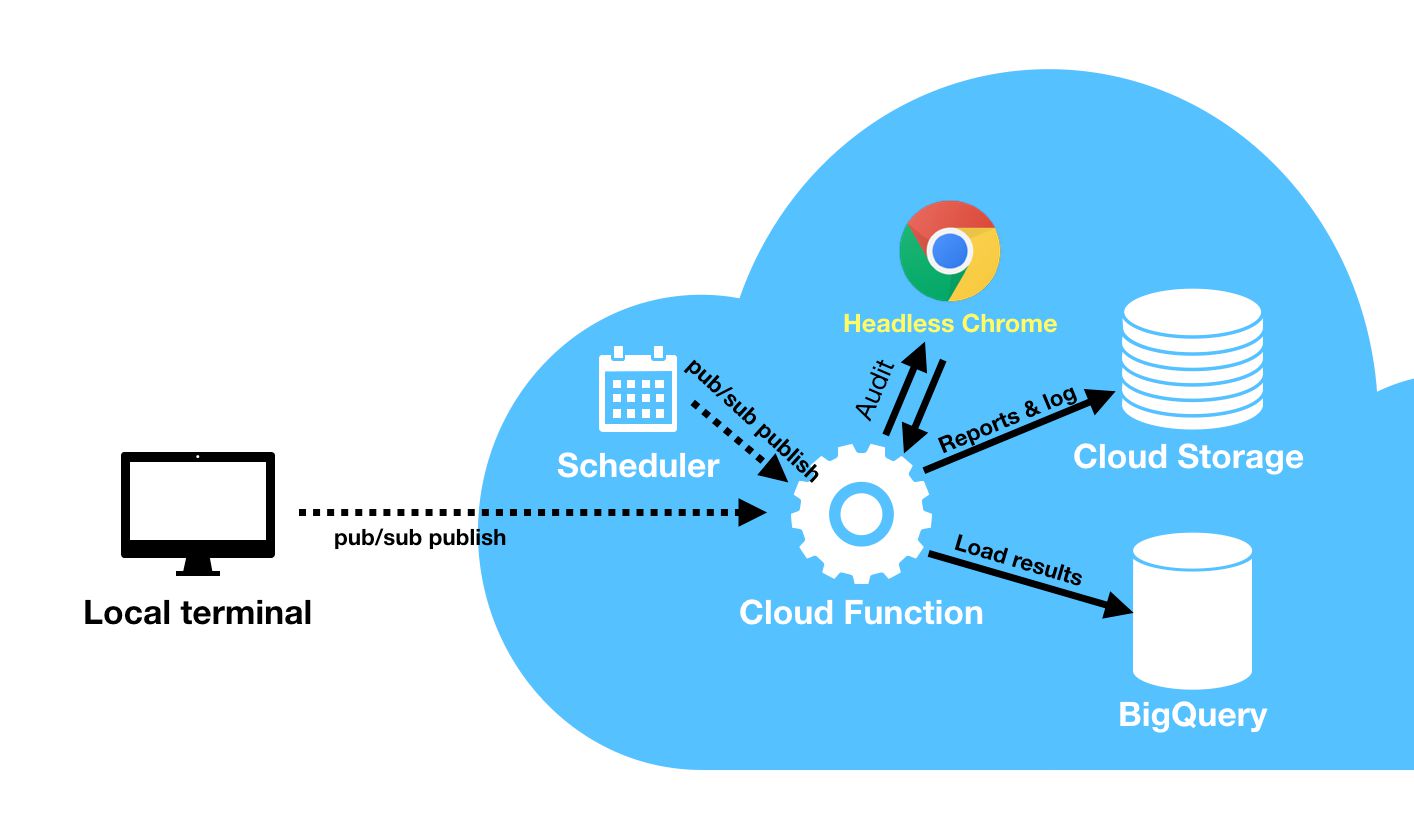
First, check out my mad Powerpoint-driven design skills:
Let’s step through what goes on here.
The Cloud Function is a piece of Node.js code running in the Google Cloud. It’s called “serverless” because the setup is fully self-contained. The environment itself takes care of running the code and the infrastructure necessary to do so.
The Cloud Function is triggered by a message pushed into a Pub/Sub topic. Pub/Sub is short for Publish/Subscribe, which means you can publish messages into a topic, which will then alert any subscribers of that topic. In other words, it can be used as a simple real-time messaging queue, where published messages can trigger services within the Google Cloud.
The message itself can be published by you manually, by using the Google Cloud SDK in your local terminal, or by other applications which have been authorized to communicate with the topic. A nice use case would be to have your site’s build pipeline trigger the audit as soon as the new release of the site has been deployed.
The message can also be published by Cloud Scheduler, which is a Google Cloud service that lets you schedule certain actions such as the publishing of a Pub/Sub message. You can set the scheduler to trigger your Cloud Function every night, or every week, or every month, for example.
When the Cloud Function is triggered, it fires up an instance of the Google Chrome browser in headless mode, using a piece of software called Puppeteer.
The Lighthouse audit tool is run in this browser instance, and it will perform the audit on any URLs you have defined in a special configuration file.
Once the audit is complete, the results are written into Google Cloud Storage, which functions as a file archive in the cloud, allowing you to store and fetch items from it at will (and at low cost).
The results are also written into a BigQuery table. BigQuery is a scalable data warehouse, where records are stored in table format (as opposed to a more traditional relational database). Due to its flat nature, it’s fast, scalable, and extremely responsive. We don’t need its full potential in this project, but having the data stored in BigQuery opens up opportunities in e.g. Google Data Studio for visualization of the results.
The cost? Next to nothing. With just one or two URLs you’re facing practically zero cost. At most, it will be a handful of cents per month thanks to Google Cloud Storage.
Preparations
To be able to follow this guide, you’ll need to install some tools and create a Google Cloud Platform project.
Install command line tools
First, install the following command line tools:
To verify you have these up and running, run the following commands in your terminal (example from OS X):
$ node -v
v11.0.0

$ npm -v
6.4.1

$ gcloud -v
Google Cloud SDK 228.0.0

$ git --version
git version 2.19.2
Naturally, you might see some other version numbers, and that’s OK. Just try to work with recent releases.
Set up a new Google Cloud Platform project with Billing
The other thing you’ll need to do is create a GCP project, and you’ll need to enable billing for this project. The things you build with this guide will most likely cost you absolutely nothing, or, at worst, just a handful of cents a month. But you still need to provide a credit card to enable some of the services we’ll need.
To set up a new project, you can follow Step 1 and Step 2 in my Snowplow + GCP guide.
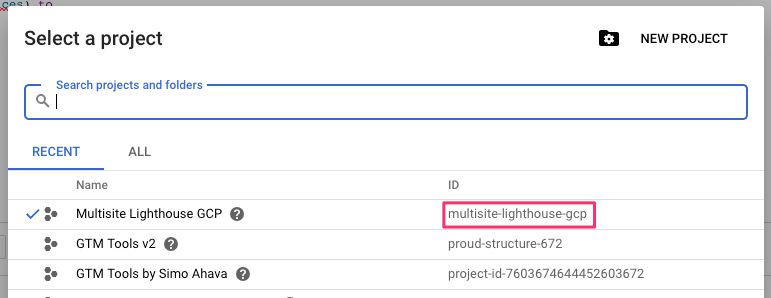
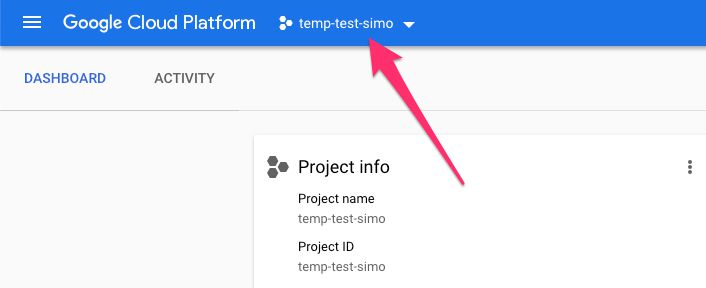
Once you’ve created the project, make sure you copy its Project ID - you’ll need it when walking through this guide.
Once you’ve got the command line tools running and the GCP project created, it’s time to get to work!
Set things up in GCP
We’ll need to enable some services in your Google Cloud Platform project. Also, we’ll need create a BigQuery dataset, a storage bucket in Cloud Storage, and we’ll need to configure a Cloud Scheduler job to run the audits periodically.
Enable the services
First, make sure you’ve got the correct project selected while in your GCP console dashboard.
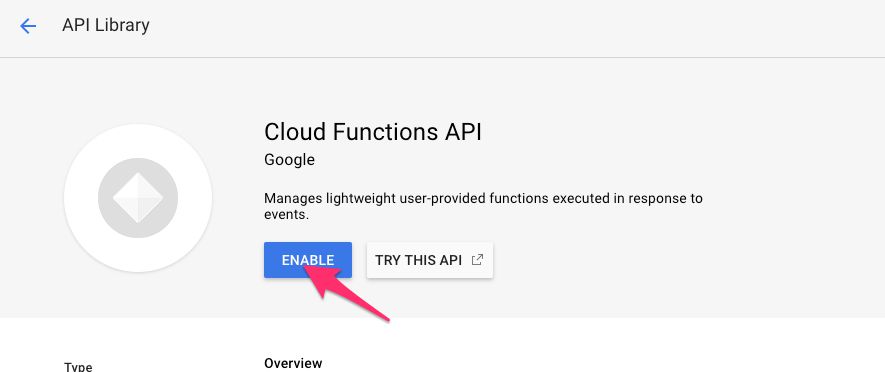
Then, go to https://console.cloud.google.com/apis/library/cloudfunctions.googleapis.com and click the blue ENABLE button to enable the Cloud Functions API.
Once enabled, go to https://console.cloud.google.com/apis/library/cloudscheduler.googleapis.com and click the blue ENABLE button to enable the Cloud Scheduler API.
The other services we’ll need (BigQuery API, Cloud Storage API, and Pub/Sub API) are already enabled in your project.
Create the BigQuery dataset
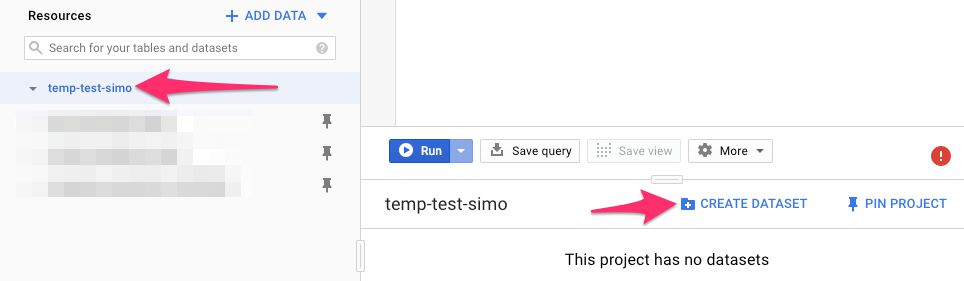
Now, browse to https://console.cloud.google.com/bigquery, and click your project ID in the list of availabe projects.
We need to create a dataset which will soon contain a table where the audit results will be loaded to.
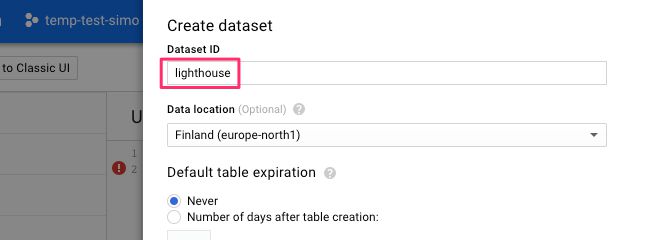
Type lighthouse as the dataset ID, like this:
You can set the location of the dataset to somewhere in your geographical vicinity, if you wish. Once done, click Create dataset.
Create the GCS bucket
We’ll need to create a bucket in Google Cloud Storage. You can think of it like a storage drive, where the bucket represents a specific root directory to which the audit reports will be written.
We’ll also use the bucket to handle state in the Cloud Function. This is necessary to prevent unintentional retries from writing your data over and over again into BigQuery and storage.
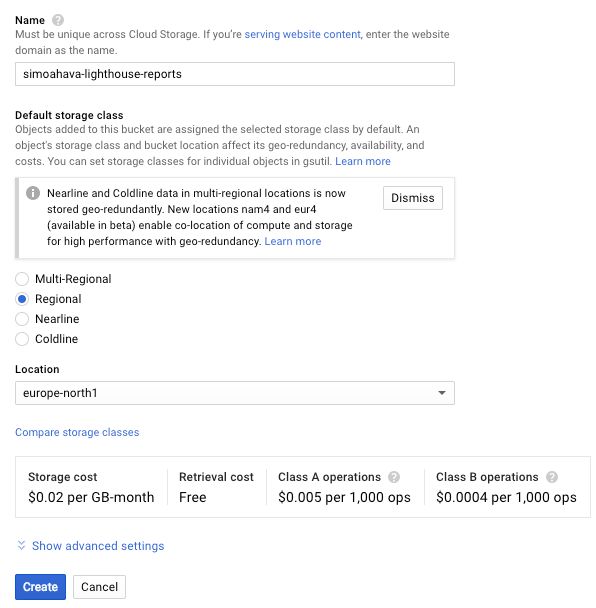
Browse to https://console.cloud.google.com/storage/browser and click Create bucket.
You’ll need to edit some options.
Name: Give the bucket a name that’s globally unique.
<yourname>-lighthouse-reportsshould work nicely. You’ll need this name when configuring the application, so you might as well make note of it now.Default storage class: Choose an applicable storage class. The storage class determines how much it costs to store and query the data. You’ll be doing a little bit of fetching and a little bit of storing, so the Regional option is typically a good one to go with.
Location, choosing the location will impact costs and latency, so find one that suits you best. Honestly, the costs will be so low you might as well just take the one which is geographically closest to you.
Once happy with the settings, click Create.
Set up the scheduled job
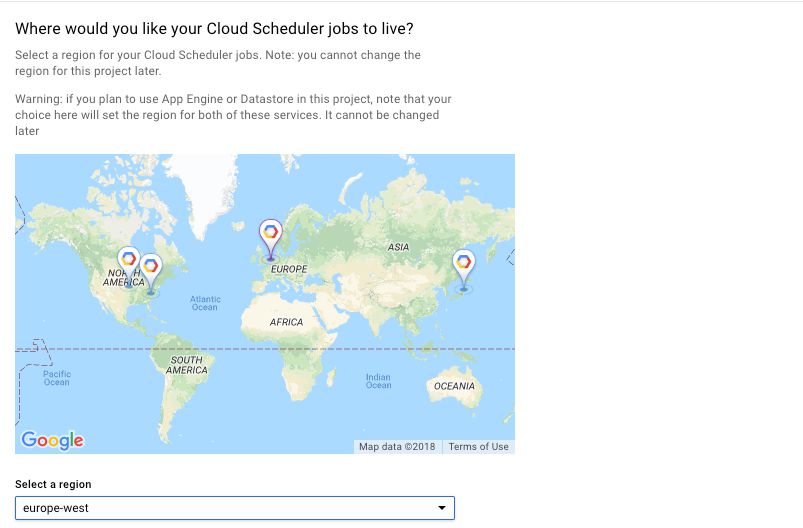
Finally, browse to https://console.cloud.google.com/cloudscheduler and click Create job. We’ll use the Cloud Scheduler to fire up our Cloud Function periodically.
In the first screen, you’ll need to choose a region. You might as well choose one that’s geographically close to you. Click Next when ready.
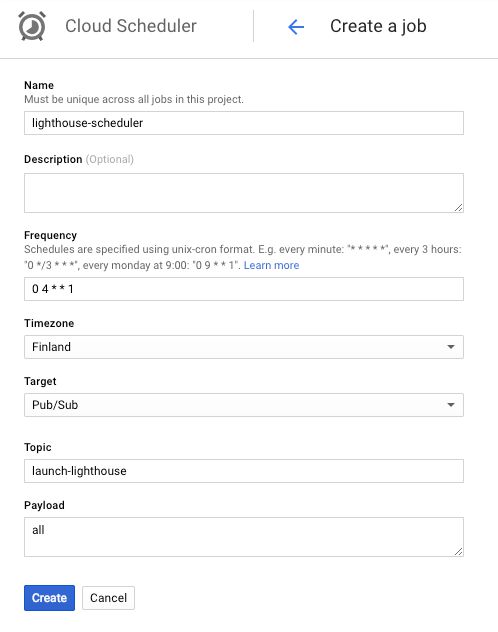
Next, after some deliberation, you’ll need to give your job a name. Just use something descriptive.
Then, you need to establish the frequency of the job. Cloud Scheduler uses UNIX’ cron format, which can be a bit of a mystery, but it does have a nice logic to it. You can read how it works here, but here are some examples you can input into the field.
Every day at 04:00 AM (daily):
0 4 * * *Every Monday at 04:00 AM (weekly):
0 4 * * 1First day of every month at 04:00 AM (monthly):
0 4 1 * *
Next, choose a Timezone with which the “04:00 AM” part is calculated.
Then, choose Pub/Sub as the Target of the job.
Type launch-lighthouse into the Topic field, and all into the Payload field. Don’t worry, these settings will become more apparent as we trod along.
In the end, the setup should look something like this:
Once ready, click Create.
Good job! That’s it for the Google Cloud Platform preparations. Now we’ll need to actually build the application itself.
Build and configure the application
In this part of the guide, you’ll install application source from my GitHub repo, update its configuration, and deploy it to GCP’s Cloud Function environment.
Clone the repo and install dependencies
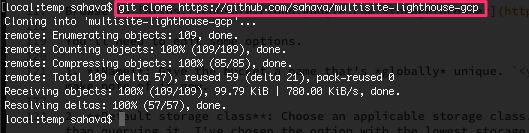
Open your terminal (or other command line) application, browse to a directory you’re comfortable to work with, and type the following command:
git clone https://github.com/sahava/multisite-lighthouse-gcp.git
This will download and install the source files from my GitHub repo into the directory multisite-lighthouse-gcp/ in the folder where you ran the command.
Next, type cd multisite-lighthouse-gcp and press enter. You should now be in the folder with the source files.
Now, type npm install to install the dependencies of the project:
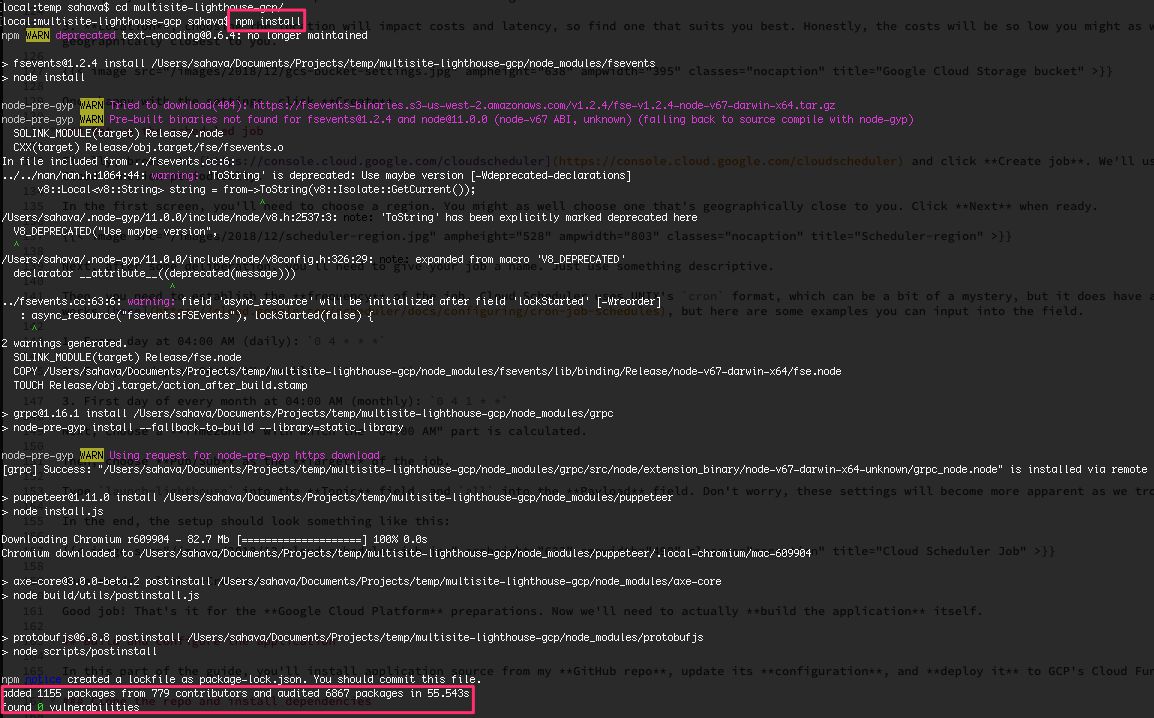
This will take a while, depending on your internet connection. The dependencies include some heavy pieces of software (such as puppeteer, which I use to launch a headless Google Chrome instance for the audits). Once it’s done, you should see a note that a bunch of packages were successfully installed.
Modify the configuration file
While in the multisite-lighthouse-gcp directory, the next thing you’ll need to do is edit the config.json file. So open the file with the text editor of your choice. This is what the default configuration looks like:
{
  "source": [
    {
      "url": "https://www.google.com/",
      "id": "googlesearch"
    },{
      "url": "https://www.ebay.com/",
      "id": "ebay"
    }
  ],
  "projectId": "multisite-lighthouse-gcp",
  "pubsubTopicId": "launch-lighthouse",
  "datasetId": "lighthouse",
  "minTimeBetweenTriggers": 300000,
  "gcs": {
    "bucketName": "lighthouse-reports"
  },
  "lighthouseFlags": {
    "output": ["html", "csv"],
    "emulatedFormFactor": "desktop"
  }
}
Please see the following list of fields and possible values, and edit the configuration file accordingly.
| Field | Values | Required | Description |
|---|---|---|---|
source | {url, id} | Yes | An array of objects, each object representing one URL to audit. Type the full URL into the url field, and give a unique, descriptive id value into the respective field. For each additional URL you want to audit, add another object into the array. |
projectId | temp-test-simo | Yes | The Project ID of your Google Cloud Platform project. |
pubsubTopicId | launch-lighthouse | Yes | Set this to launch-lighthouse. It’s the name of the Pub/Sub topic that will be used to trigger the audits. |
datasetId | lighthouse | Yes | The Dataset ID of the dataset you just created in BigQuery. |
minTimeBetweenTriggers | 300000 | Yes | The minimum time in milliseconds to wait before a Pub/Sub trigger can start the Cloud Function for any given ID. This is to add some idempotency to the function (more on this below). |
gcs | {bucketName} | Yes | The name of the Google Cloud Storage bucket you created earlier. |
lighthouseFlags | See here. | No | If you want to store the reports in Google Cloud Storage, set the output field to have an array of the formats you want to write the reports in. Available values are "csv", "json", and "html". For each value in this array, a report will be written for every URL audited. |
The only optional field is lighthouseFlags. If you don’t set lighthouseFlags.output to an array of available filetypes, no reports will be written to Google Cloud Storage. The other field provided by default is emulatedFormFactor, which specifies that the performance audit should emulate a desktop browser.
The minTimeBetweenTriggers flag is used to add a wait time before you can audit any given ID again. The Cloud Functions service doesn’t guarantee that a function is run just once per trigger. This means that any code that’s run should aim to be idempotent; that is, multiple executions of the code in a short amount of time should not result in additional state changes (e.g. BigQuery loads).
I ended up using a simple stateful mechanism in Google Cloud Storage. A file named states.json is written into the root of the GCS bucket, and this contains timestamps for when each trigger last activated its respective event. If this activation was less than 300 seconds ago (or whatever you specify in the configuration file), the function will abort.
Once done with the configuration, save the changes you made.
Deploy the function and test
You’re almost done! Now you’ll need to just deploy the function, and then run a simple test.
The Cloud Function itself is the launchLighthouse() method you can find if you browse the source code of index.js. This function is what your Pub/Sub trigger will launch when your Cloud Scheduler job goes off, or when you manually instruct the trigger to fire.
The Cloud Function will run in Google Cloud’s serverless environment, launching instances of headless Google Chrome to perform the audits on the URLs you provide in the configuration file. The results will then be written into a BigQuery table, as well as stored into the GCS bucket if you so wish.
Deploy the Cloud Function
While in the multisite-lighthouse-gcp folder, type the following command:
gcloud auth login
This should open up a browser window where you need to enter your Google ID credentials. Make sure you log in with the same Google ID you use to manage your Google Cloud Platform project with! You’ll see that Google Cloud SDK wants to access a bunch of things in your name, so click Allow to let it do just that.
It’s Google - what evil could they do?
If successful, you should see this screen:
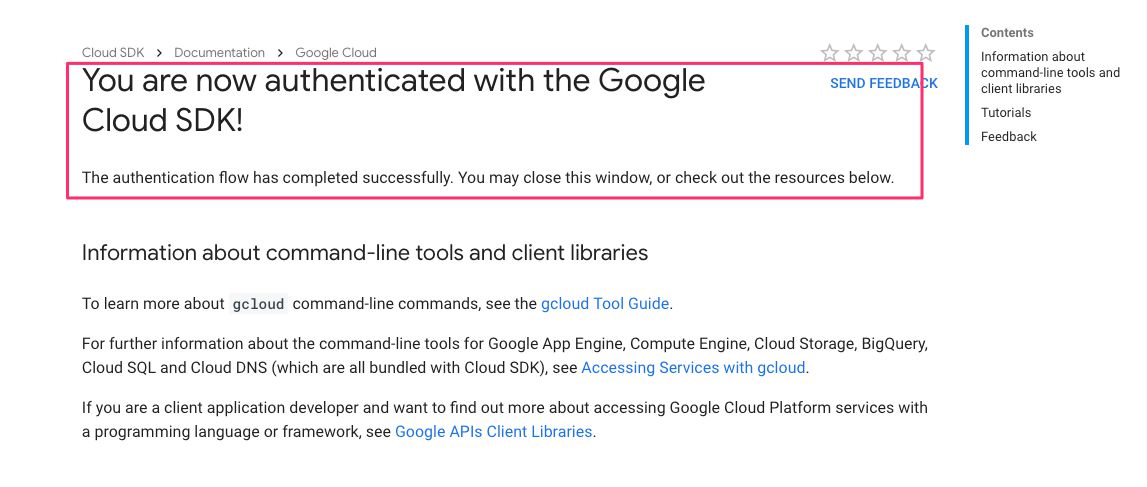
Now, open your terminal window again, and type the following command in the multisite-lighthouse-gcp folder:
gcloud config set project <projectId>
Type your GCP Project ID in lieu of <projectID>, and press enter.
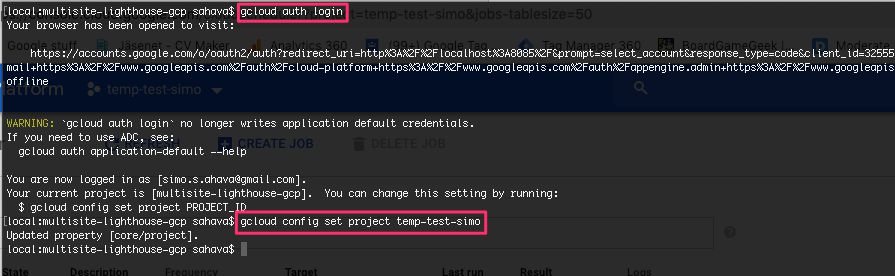
Now that you’ve authenticated against Google Cloud, and now that you’ve switched the project to your GCP project, it’s time to finally deploy the function with (type it all in one line):
gcloud functions deploy launchLighthouse --trigger-topic launch-lighthouse --memory 2048 --timeout 540 --runtime=nodejs8
If you want to run the function in a specific region, you can add --region=<some GCP region>, e.g. --region=europe-west1 to the command.
It will take a minute or two for the function to be deployed to the cloud. Once done, you should see this as a result:
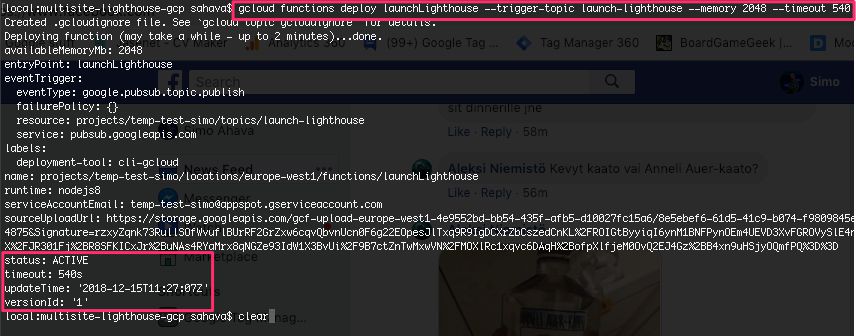
The deploy should fail in an error if you have mistakes in the configuration file config.json, so make sure you follow the instructions above for how to configure the function.
The initial deployment creates the launch-lighthouse Pub/Sub topic and subscriptions automatically.
So now that the Pub/Sub topic has been created, you can actually test the whole thing.
Test with Pub/Sub
The Cloud Scheduler will send the message all to the Pub/Sub topic launch-lighthouse using the schedule you defined earlier. The topic all will, in turn, trigger the Cloud Function you just deployed as many times as it takes to audit all the URLs in the source field of the configuration.
You can test this in two ways.
You can browse to https://console.cloud.google.com/cloudscheduler and click Run now next to the schedule job.
You can use the command line to publish the
allmessage.
Since the first is so easy, I’ll show you how to do the second.
Open the terminal, and make sure you have your Google Cloud Platform set with:
gcloud config set project <projectId>
Just remember to replace <projectId> with your actual project ID.
Now, run:
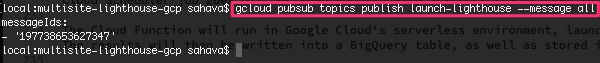
gcloud pubsub topics publish launch-lighthouse --message all
You should see a messageIds response - that means the message was published successfully.
Check logs
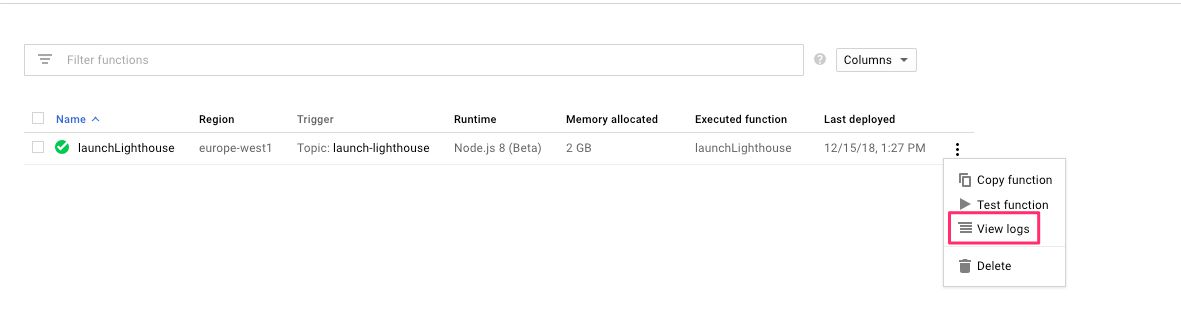
Now, browse to https://console.cloud.google.com/functions/list, where you should see details about your Cloud Function, hopefully with a green checkmark next to its name.
Click the action menu at the end of the row, and choose View logs.
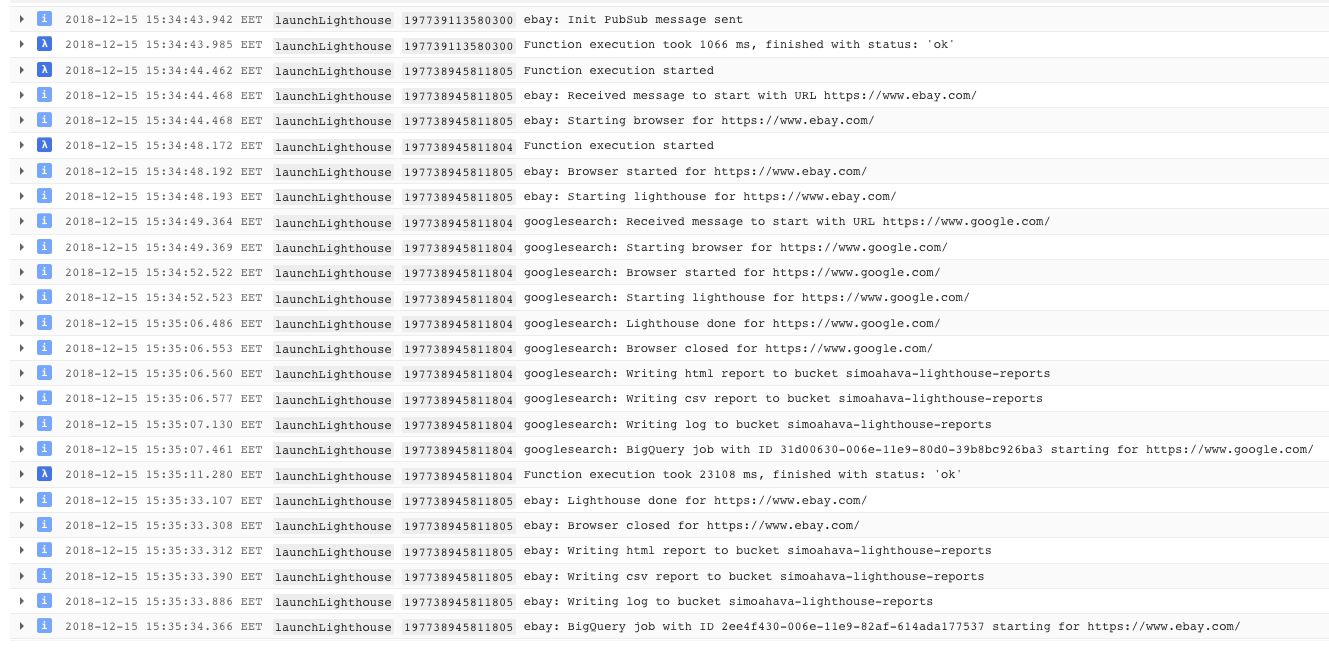
You’ll see a bunch of log results here. Here are the entries you should see (in approximately, but not definitely, this order):
| Message | Description |
|---|---|
| Function execution started | The Cloud Function starts. If you sent the message all, it now sends a new Pub/Sub message for all the IDs in your configuration file, thus starting new Cloud Functions by itself (one for each source entry in the config). |
| {id}: Sending init PubSub message | This is the initialization message for source ID {id}. |
| {id}: Init PubSub message sent | The initialization message was sent successfully. |
| Function execution took N ms, finished with status: ‘ok’ | The Cloud Function triggered with all has now completed its task. |
| Function execution started | The Cloud Function triggered by the initialization message now starts. |
| {id}: Received message to start with URL {url} | Message to start audit received. |
| {id}: Starting browser for {url} | A headless browser is started for the audit. |
| {id}: Browser started for {url} | The browser startup is successful. |
| {id}: Starting lighthouse for {url} | Beginning the actual audit. |
| {id}: Lighthouse done for {url} | Lighthouse audit complete. |
| {id}: Browser closed for {url} | Browser instance shut down. |
| {id}: Writing {output} report to bucket {bucketName} | If you’ve defined the output Lighthouse flag, then a report for each filetype listed in output will now be written into your GCS bucket. |
| {id}: Writing log to bucket {bucketName} | The full log of the audit is written to storage, too. |
| {id}: BigQuery job with ID {UUID} starting for {url} | The BigQuery job starts and signals the end of the Cloud Function. |
| Function execution took N ms, finished with status ‘ok’ | Function complete. |
If you had multiple URLs defined in the source of the configuration file, then you’ll see parallel entries for all the URLs. Each URL is treated in its own Cloud Function, so there will be a lot of overlap in the logs.
If you see permission errors then they are almost certainly because you’ve either forgotten to enable the required services, or because you haven’t filled in the configuration file correctly.
Check BigQuery
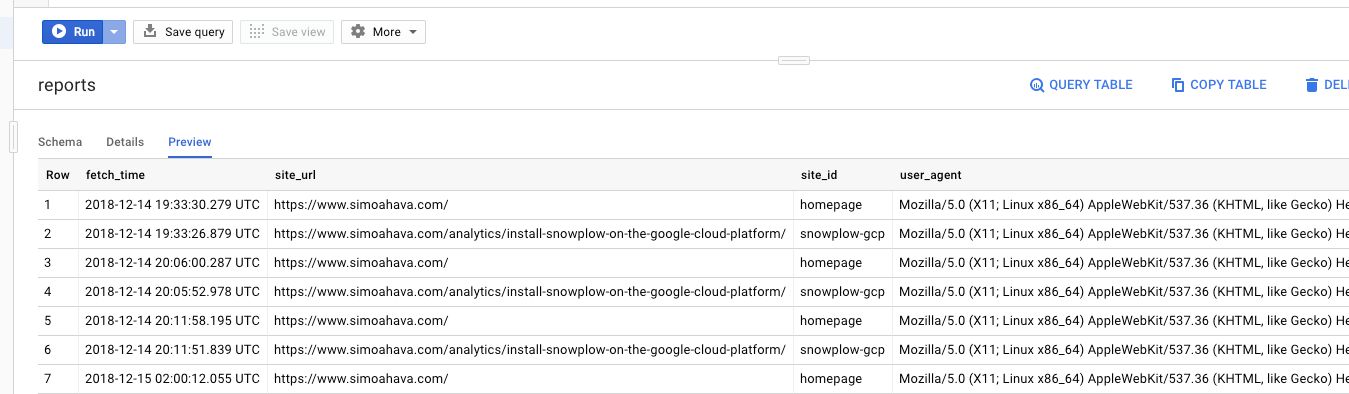
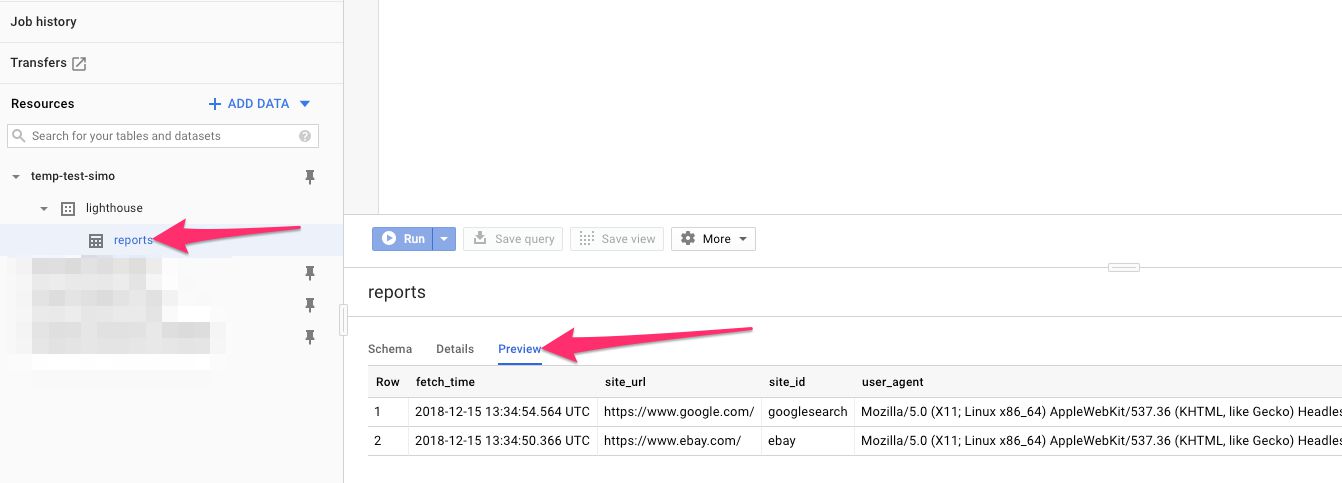
Now, browse to https://console.cloud.google.com/bigquery. Here, click open your project in the left navigation, and choose the dataset you created. You should see a new table under it, named reports. Click it.
In the main console, you should now see a bunch of column definitions. Above those definitions is the link titled Preview, so go ahead and click it. This will “Preview” the BigQuery data stored in the data, and thus not cost you a penny.
Feel free to scroll around the columns.
Do note that the BigQuery schema only contains those audits that have a “weight” in determining the total score. I did this purely out of convenience. I might update the schema at some point to simply contain all the audit fields, but this made more sense to start with.
Check Cloud Storage
Browse to https://console.cloud.google.com/storage/browser and click the bucket name you created earlier. You might see some .appspot.com buckets there, too. Don’t worry - they were created automatically when you deployed your Cloud Function.
You should now see new folders within the bucket - each named after an id value in your configuration file’s source array. You’ll also see the states.json file, which makes sure your function only runs when it’s supposed to.
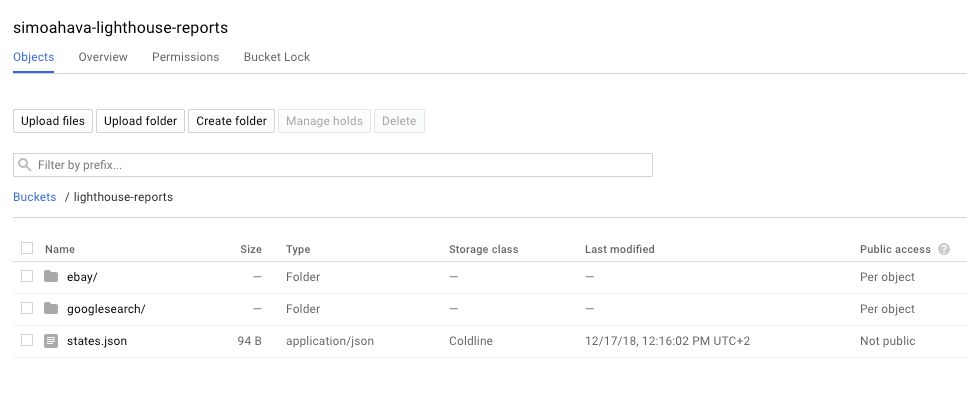
Click one of the folders to see the contents.
If you defined an output array in the Lighthouse flags of the configuration file, you will now see a file prefixed with report_ for each file type you added to the array. Remember, there were three possible reports Lighthouse can provide you: CSV, HTML, and JSON.
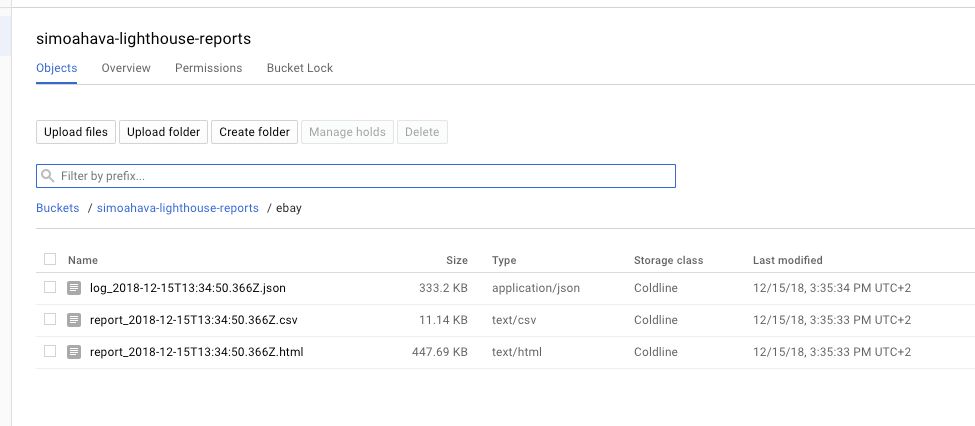
You’ll also see a JSON file prefixed with log_, which will contain the full audit object for you to peruse.
Feel free to download the files and explore them. The HTML report is especially interesting (and visually pleasing) to read.
Things to note
Cloud Scheduler
Don’t forget that you have a Cloud Scheduler running! Periodically, it will push the all message into your Pub/Sub topic, thus auditing each URL in your source list, writing the results into BigQuery, and storing the logs in Cloud Storage.
Manually trigger the audit
You can always trigger the audit manually with
gcloud pubsub topics publish launch-lighthouse --message all
or, if you want to trigger an audit for a specific ID only, the command is
gcloud pubsub topics publish launch-lighthouse --message <id>
where <id> is the ID of the URL you set in the source array of the configuration file.
Cloud Functions don’t have the best performance
Unfortunately, running the headless browser in the Cloud Function is not the most efficient thing in the world. In fact, the Performance report (which is, for many, the most interesting one), will most likely under-report the load times quite severely.
There’s not much to do about this currently. Cloud Functions simply do not have the CPU power required to perform complex or expensive tasks like this.
This has been identified by the developers (see here), and it’s possible that in the near future either Cloud Functions, Puppeteer, or Google Chrome will enable the processes to run smoother and faster.
Updating the configuration file is a bit annoying
Due to how the configuration file has been bundled with the Cloud Function itself, any update to the configuration file requires you to redeploy the Cloud Function itself. This is annoying, since deployment always takes a couple of minutes.
I’m probably going to update the application so that the configuration file is stored in a Google Cloud Storage bucket. That way when you want to update the file, all you need to do is upload it to the bucket using the Google Cloud Console user interface. And that’s really fast.
Other ideas
You can follow the GitHub project to see where things are heading. Especially the Issues page should be of interest, since it’s essentially a to-do list for me.
Final thoughts
This was a fun exercise, and I hope you managed to complete it following the guide above. If not, please let me know in the comments where you had trouble.
I’m not too happy with the fact that Chrome is just too slow when run through a Cloud Function. It’s possible that the whole thing is quite useless until the browser’s performance in the sandbox is improved. I might have to add the option of using an AppEngine or Kubernetes Engine instance instead. This way you could scale the environment as much as you like to improve the accuracy of the performance audit. Naturally, this will incur some costs not present in the current setup.
On the other hand, I love the fact that the data is being collected in BigQuery, since I can create a nice dashboard with Data Studio that shows the performance progress of the URLs I’ve selected for auditing.
Cloud Functions themselves are simply wonderful. Total game-changers. Running serverless applications with almost no cost at all, and triggering them in different ways (HTTP requests, Pub/Sub triggers) has huge potential for the future. Thanks to some background service magic, it’s so refreshing not having to worry about authentication and access control levels - the Cloud Function has all the required access levels for performing a wide variety of tasks.
Check the Cloud Function documentation for inspiration: https://cloud.google.com/functions/docs/tutorials/.
As always, please let me know in comments if you have questions about this setup, or if you have suggestions for improvement.