When looking at Google Analytics reports, you’d think you get a pretty good idea of how people are interacting with your site, right? I mean, you’re tracking events here, pageviews there, and user timings, custom dimensions, custom metrics, and calculated metrics are all part of your daily lingo. But you’re also probably aware of how futile this tracking is. After all, all you’re seeing are numbers that reflect certain outcomes the visitors have produced on the website, and how these outcomes match against your preconceived goals and objectives, right? It’s difficult to wrap your head around the individual use cases that constantly take place on the site, and to draw overarching conclusions or unearth business trends on the basis of these data sets can be very problematic indeed.
In anticipation of my upcoming talk at SMX München, I thought I’d show a pretty nifty way of adjusting what content engagement means on an article-by-article basis, and how to encode this using Google Tag Manager.
Since this blog is pretty much the only digital property I have a stake in, it’s very important to me to uncover meaning in the content data I’m looking at. I’ve done this numerous times before in articles such as:
And so on and so forth. But what I haven’t yet tackled, at least not really, is how much time users are actually spending engaged with my content. In other words, I want to see something like this:
I’m interested in knowing, among other things, out of all of the time users spend on the page, how much of it are they engaged with the page.
!!! UPDATE !!! I’ve had to rewrite parts of this article due to a severe limitation in utilizing User Timings for data collection. Please read on until you reach step 4. User Timings. At the beginning of that step is another UPDATE, where I link you to the revised version of the article. The revised article picks up right after Step 3 and takes you all the way to the end, so you don’t have to jump back here unless you want to enjoy the comments. !!! END UPDATE !!!
Now, this is a very difficult topic to breach, so I had to ground it somewhere. Enter Yleisradio (YLE; Finnish Broadcasting Company) and Chartbeat.
The Simmer Newsletter
Follow this link to subscribe to the Simmer Newsletter! Stay up-to-date with the latest content from Simo Ahava and the Simmer online course platform.
YLE and Chartbeat
A week ago I had the pleasure of visiting some friends at YLE with a group of like-minded people, all interested in analytics. What Jaakko Ojalehto, Leevi Kokko, and Sami Mattila, the guys from YLE, showed us, was how they’ve replicated Chartbeat’s research on engagement, and how they’re utilizing this data to feed their reporters and journalists with more actionable data about how their content is faring on this enormous digital property.
Chartbeat’s research showed, among other things, that the engagement window of a single user averages at around 5 seconds. So after interacting with the page with clicks, mouse movements, keyboard presses, and scrolls, the user would stay engaged for another 5 seconds, before starting to idle or changing to another window or browser tab:
Chartbeat’s JavaScript is constantly listening for acts of engagement on the in-focus webpage within an active browser (full list of events indicating engagement included below). These checks indicate when a user is actively engaged on the page and, based on a study conducted by Chartbeat, will likely remain so for five additional seconds.
As this quote from their “Description of Methodology” page implies, engagement is something we can, and should, measure.
So I wanted to replicate what the YLE guys have been doing while replicating what Chartbeat have been doing. And I wanted to provide a simple means of doing so via Google Tag Manager. Thus the rest of this blog post will cover the steps required to send timing data to Google Analytics, where you’re measuring the cumulative time each visitor is engaged with any piece of content on your site.
This will give you a better understanding of active time spent on the page, as the Average Time On Page just doesn’t describe accurately the complexity of engagement. Time On Page is, after all, quite a complex and misleading metric, even if there are some excellent ways to improve it.
What you’ll need
To make it all work, you’ll need:
Custom HTML Tag (GTM) - To setup the script which measures engagement time
Custom Event Trigger (GTM) - To fire the User Timings Tag when the timings have been calculated
Data Layer Variable (GTM) - To pick up the time engaged from
dataLayerUser Timings Universal Analytics Tag (GTM) - To send the timing data to Google Analytics
Calculated Metric (GA) - To calculate the average time engaged per page
Custom Report (GA) - To display the data correctly
Note that there are some caveats to what you can do in Google Analytics, which depend on whether you’re already using User Timings in your data collection. I’ll get back to those when discussing the calculated metric you need to create.
1. Custom HTML Tag
Create a new Custom HTML Tag, give it some fancy name, and copy-paste the following code within:
<script>
  (function() {
    var startEngage = new Date().getTime();
    var timeEngaged = 0;
    var idleTime = 0;
    var idle = true;
    var idleReport = false;
    var idleTimer, reportTimer;

    /*  Set the user as idle, and calculate the time
        they were non-idle */
    var setIdle = function() {
      idleTime = new Date().getTime();
      timeEngaged += idleTime - startEngage;
      idle = true;
    };

    /*  Reset the 5 second idle timer.
        If the user was idle, start the non-idle timer */
    var pulse = function(evt) {
      if (idle) {
        idle = false;
        startEngage = new Date().getTime();
        idleReport = false;
      }
      window.clearTimeout(idleTimer);
      idleTimer = window.setTimeout(setIdle, 5000);
    };

    //  Utility function for attaching listeners to the window
    var addListener = function(evt, cb) {
      if (window.addEventListener) {
        window.addEventListener(evt, cb);
      } else if (window.attachEvent) {
        window.attachEvent('on' + evt, cb);
      }
    };

    /* Push an event to dataLayer every 15 seconds
       unless the user is idle.
       Also, push an event when the user leaves the page */
    var report = function(evt) {
      if (!idle) {
        timeEngaged += new Date().getTime() - startEngage;
      }

      // Push the payload to dataLayer, and only push valid time values
      if (!idleReport && timeEngaged > 0 && timeEngaged < 3600000) {
	    window.dataLayer.push({
    	  'event' : 'nonIdle',
          'nonIdleTimeElapsed' : timeEngaged
        });
      }
      if (idle) {
        idleReport = true;
      }

      // Fix possible beforeunload duplication problem
      if (evt && evt.type === 'beforeunload') {
	    window.removeEventListener('beforeunload', report);
      }
      timeEngaged = 0;
      startEngage = new Date().getTime();
      reportTimer = window.setTimeout(report, 15000);
    };

    addListener('mousedown', pulse);
    addListener('keydown', pulse);
    addListener('scroll', pulse);
    addListener('mousemove', pulse);
    addListener('beforeunload', report);
    idleTimer = window.setTimeout(setIdle, 5000);
    reportTimer = window.setTimeout(report, 15000);
  })();
</script>
Let’s take a look at the script, just briefly and superficially, so that you have an idea of what you’re doing.
At the very end, you have the following lines:
addListener('mousedown', pulse);
addListener('keydown', pulse);
addListener('scroll', pulse);
addListener('mousemove', pulse);
addListener('beforeunload', report);
idleTimer = window.setTimeout(setIdle, 5000);
reportTimer = window.setTimeout(report, 15000);
Here, you’re binding the events mousedown (when a mouse button is depressed), keydown (when a key is depressed), scroll (when the page is scrolled), and mousemove (when the mouse is moved) to send a pulse that the user is engaged. If there’s a 5000 millisecond (5 second) delay between pulses, the user is set as idle.
Finally, every 15 seconds the cumulative engaged time is sent to Google Analytics, resetting the time engaged for the next 15 second stretch.
So this is the heart of the script. The events are taken directly from Chartbeat’s study, and nicely cover pretty much all of the ways in which the user can tell the browser they haven’t fallen asleep. Whether or not they model engagement is another, more philosophical, question, but at least they model interaction.
As you can see, mobile-specific events such as touchstart and touchend are missing. This is because, first of all, the way you interact with a page while reading on your phone is different from the idle doodling you do while using a mouse. Secondly, following Chartbeat’s conclusions, creating arbitrary handlers for purely mobile browser events can be risky due to how browsers interpret touch interactions. So this is something to keep in mind when segmenting the data.
The three methods we use, setIdle, report, and pulse are described here:
setIdlesets the user as idle every 5 seconds of non-interaction. When the user is idle, the timer calculating engagement will be paused. Also, only the first “report” todataLayerwill be pushed. After that, nothing is pushed todataLayeruntil the user starts engaging with the page again.reportpushes the current time engaged todataLayer, and resets all necessary timers and variables.pulseis what keeps the user “active”. If the user was idle, it sets their idle status to false, and the 5 second idling timer is also reset at this point.
It might seem complicated (I sure hope it doesn’t), but it’s actually a very simple set of scripts.
Set this Custom HTML Tag to fire on a Page View / DOM Ready Trigger. You want to start engagement calculations only after the page content can be interacted with.
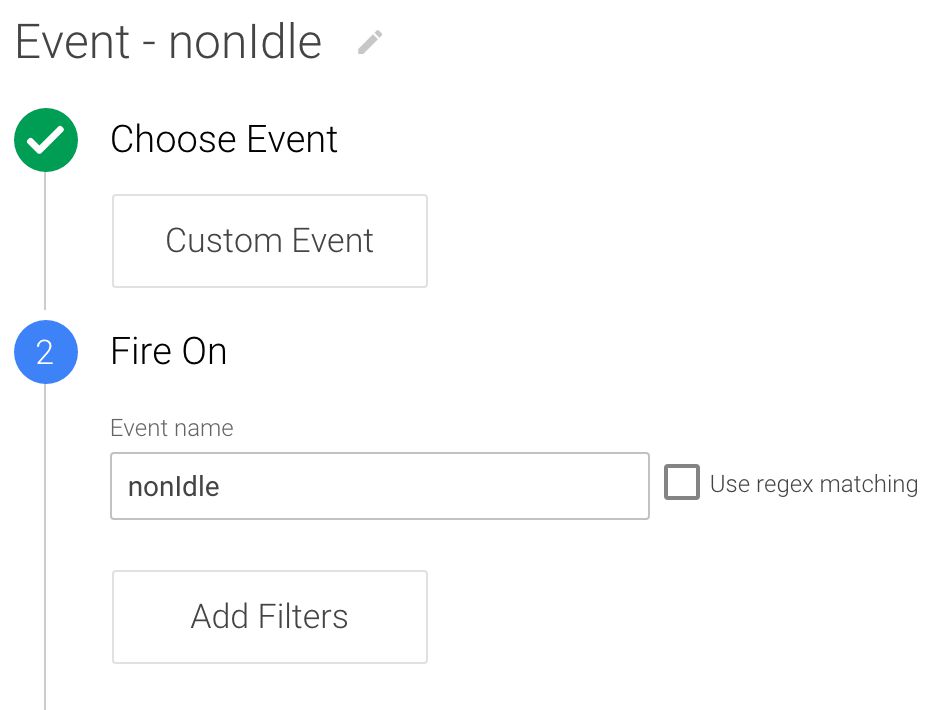
2. Custom Event Trigger
To fire your User Timings Tag (coming to that soon) when the engagement time is pushed into dataLayer every 15 seconds, you only need a Custom Event Trigger. It should look like this:
Hooray, that was easy.
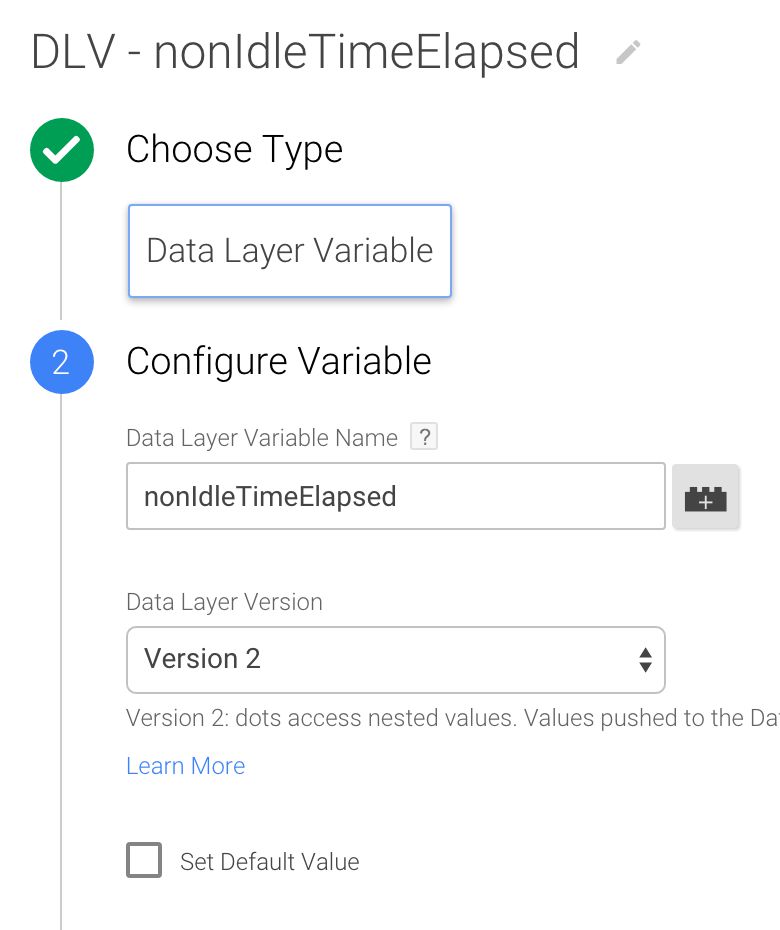
3. Data Layer Variable
You’ll need to grab the time engaged from dataLayer, so create the following Data Layer Variable:
Quite simple as well, right?
4. User Timings Tag
!!! UPDATE !!! User Timings has one major flaw: it has a daily limit of 10,000 hits, which includes Page Timings. This means that if your site is even marginally at risk of collecting this many timings altogether, the rest of this article will not work for you. In fact, I strongly recommend you stop reading the rest of the steps here, and jump instead to the revised steps I wrote, which utilize an Event Tag and a Custom Metric Tag. I’m sorry for making you jump between texts, but the truth is that User Timings have proven to be a subpar data collection method, even if I think they’re excellent in so many other ways. So, read the rest of this article at your own peril, as the actual average engagement you’ll be collecting might well be very much off the mark. !!! END UPDATE !!!
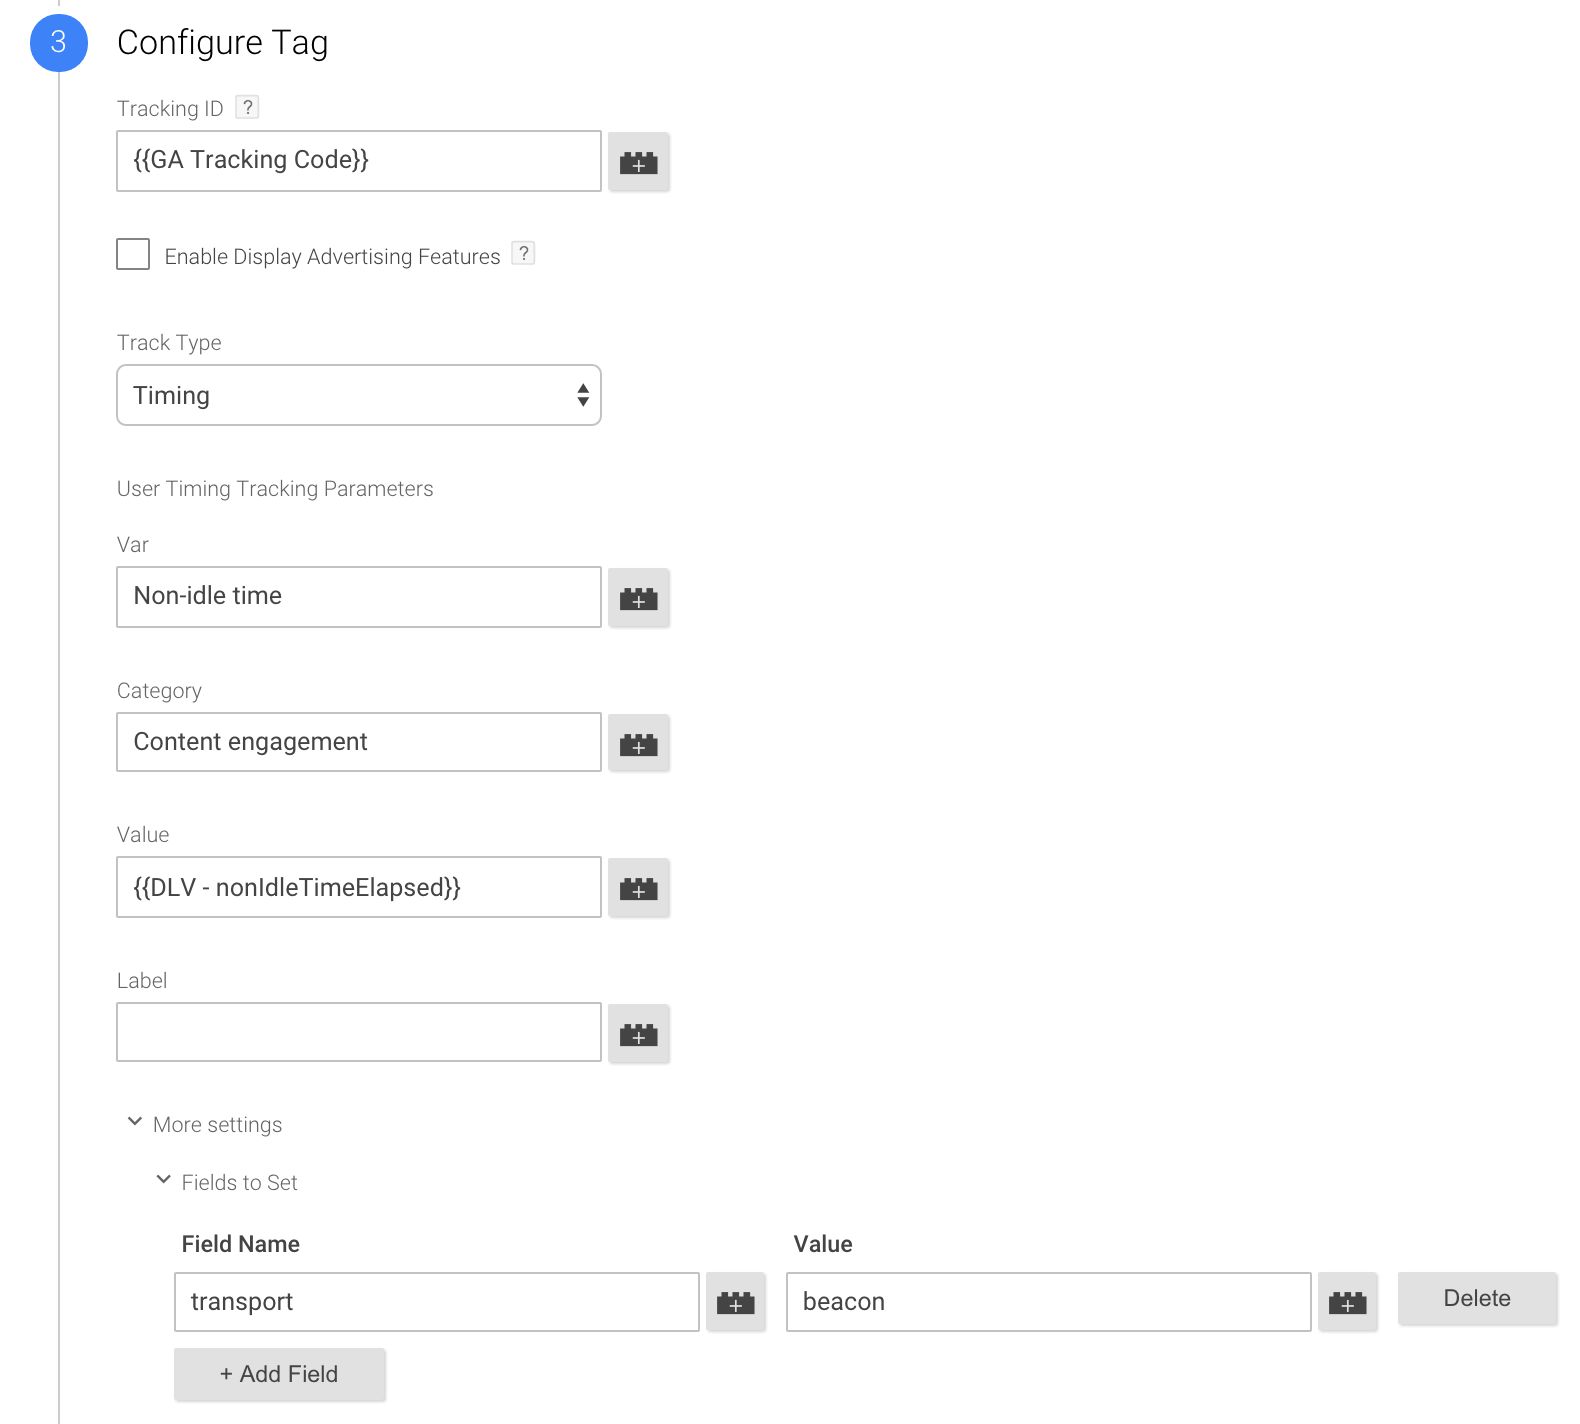
So now you’ll need a Tag which pulls all this information together, and dispatches it to Google Analytics.
We’ll use the amazing User Timings Tag Type for this. User Timings, if you didn’t know, are just about the coolest feature of Google Analytics, and ridiculously useful for collecting arbitrary time measurements. I’ve written about them before a number of times:
So, create the Tag and make it look something like this:
Remember to set the transport : beacon field in the Fields to Set. This is a very useful, albeit poorly supported, feature of Google Analytics, which attempts to preserve any hits that are sent while the user is leaving the page. I have, of course, written about this before, too.
Make this User Timings Tag fire on the Custom Event Trigger you created earlier.
And that’s it for data collection! Now Google Tag Manager will send a User Timings hit to Google Analytics every 15 seconds, where the timing value will be the time the user spent interacting with the page during that 15 second stretch.
Now we’ll want to look at this data in Google Analytics, so that we can get an idea of how much people are interacting, by average, which each page on the site.
Caveat
There’s a very important caveat to discuss before proceeding. To calculate Average Engagement Time, you’d want to calculate the total milliseconds spent engaged with the Pageviews for each page. Unfortunately, User Timings are not bound to a Pageview, as they exist as their own hit type. In other words, it’s impossible to request only specific User timings per specific Pageviews in a calculated metric or by using a custom report with report filters.
So, the only way the following will work is if this is the only User Timing you’re measuring, because then you can create a calculated metric which calculates the average of all User Timings per all Pageviews, giving you what we’re after.
If this isn’t possible in your case, you might want to pull both Pageview and User Timings data out of Google Analytics, and join them together in Google Sheets or a tool like Klipfolio.
If you have a good idea on how to circumvent this problem in Google Analytics, I’m all ears. Using the default Avg. User Timing metric will not work, as that’s bound to the size of the User Timing Sample, and not Pageviews. Using Custom Metrics might work, but I’m having a hard time figuring out how to align them with Pageviews.
5. The Calculated Metric
Calculated Metrics are cool. No, they’re awesome. They let you do calculations! On metrics! COOL AND AWESOME!
Before you proceed, don’t forget to checkout some of the amazing articles my friends have written about Calculated Metrics:
Analytics Pros - 25 Calculated Metrics For Google Analytics
Bounteous - New Calculated Metrics In Google Analytics
Avinash Kaushik - Excellent Analytics Tip #27: Chase Smart Calculated Metrics!
Peter O’Neill - A Powerful Use Case for GA Calculated Metrics
Yehoshua Coren - Google Analytics Custom Metrics And Calculated Metrics
Honestly, seems like anybody who’s a somebody in web analytics has written about this feature, and that speaks heaps about how useful calculated metrics are!
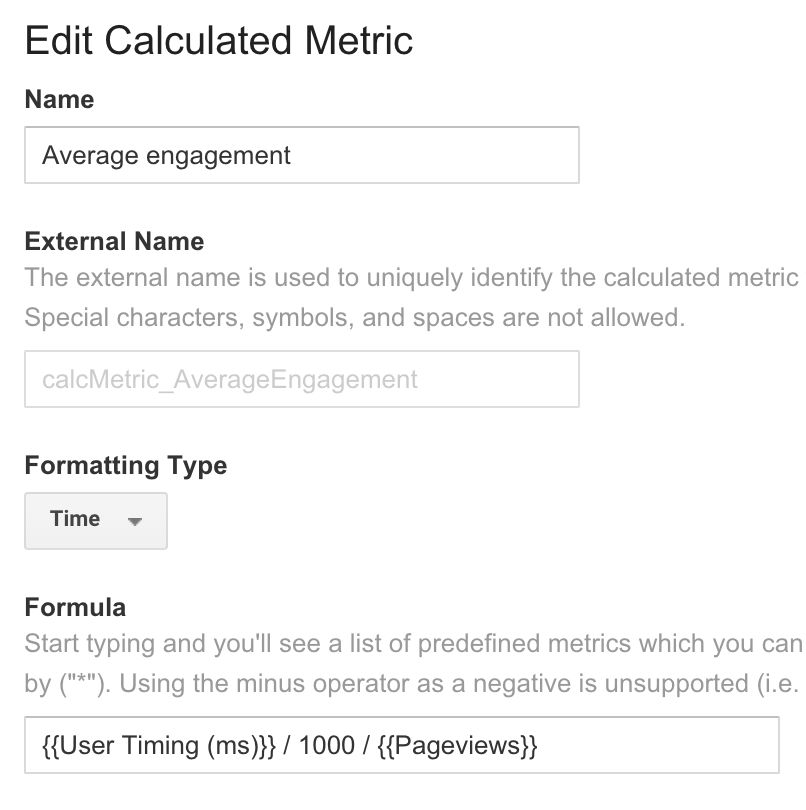
So, the metric we’ll use will calculate the average user timing by the simple formula of total User Timing value / total Pageviews. Since the Time formatting type expects seconds as the input value, we’ll need to divide the total user timings value by 1000 to convert milliseconds to the required format. Anyway, the metric setup looks like this:
To find this screen, go to your View Settings in GA Administration, and choose Calculated Metrics (BETA). Next, click the ominous, big, red button labelled + New Calculated Metric, and make sure the settings match with the screenshot above.
6. The Custom Report
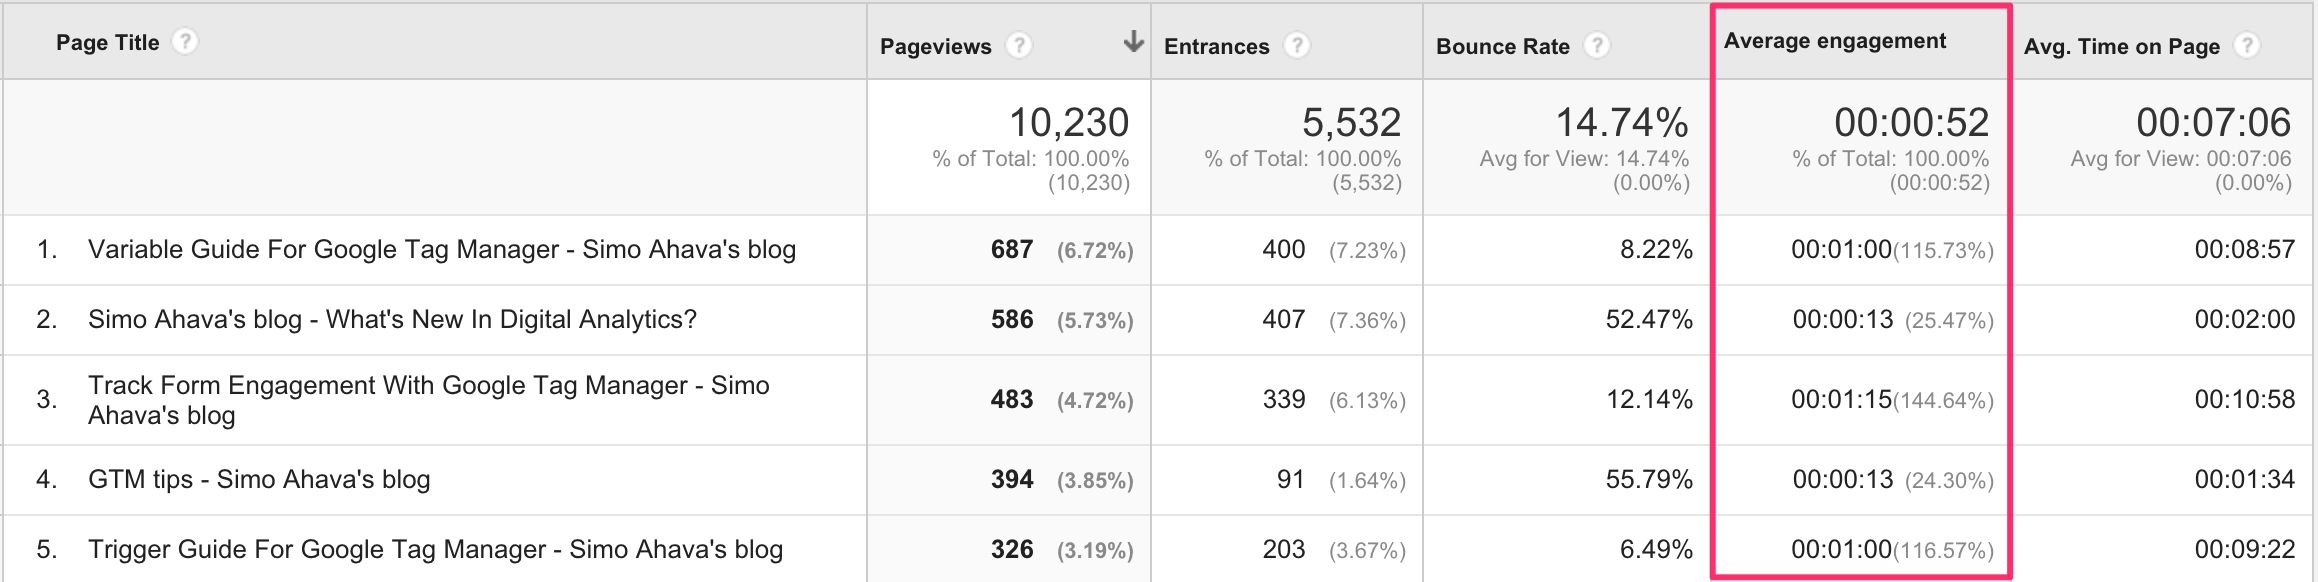
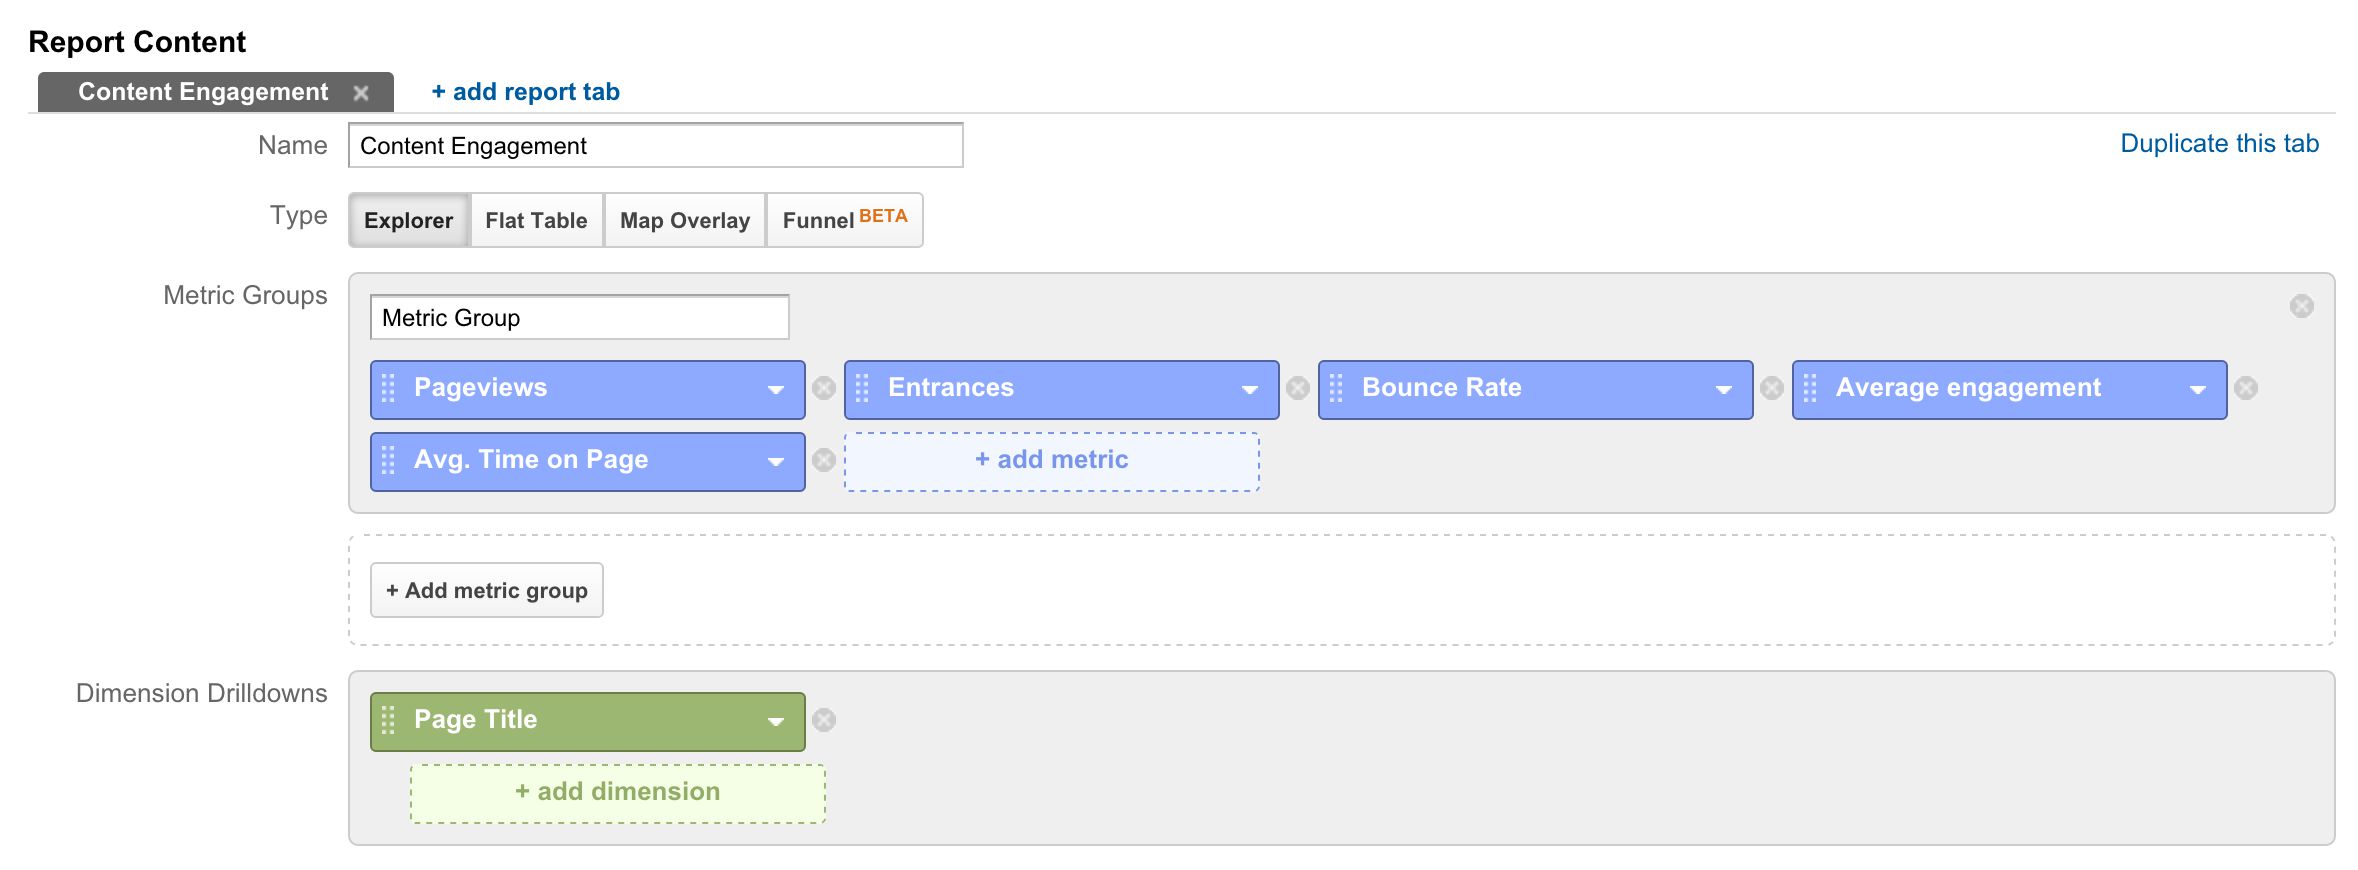
Finally, let’s pull it all together in a Custom Report. You can see a screenshot of the report itself at the beginning of this post, so here’s what the report settings would look like:
I’ve got Bounce Rate and Entrances there as well, so that I can get an idea of how sessions with these Page Views actually performed in terms of bounces and initial acquisition, but what’s important is the juxtaposition of Page Views, Average Engagement, and Average Time On Page.
Summary
Looking at Average Engagement versus Average Time On Page is illuminating. ATOP tells us how much time it took from one page view to another, but it doesn’t tell us anything about the quality of that time. With Average Engagement, we’re measuring the time user interacted with the page, i.e. kept it in focus and did something.
Does this tell us anything about whether the user read the page or how they digested the contents? No, of course not. We’d need a probe in their brain to uncover intent like that. But this data increases the significance and the meaning of the Time On Page metric, by describing actual, interactive time rather than just arbitrary time between two pageviews. It’s a far more powerful indicator than any of the out-of-the-box metrics in Google Analytics, and a crucial cog in the machine you’re building, whose job is to slowly, painfully open the lid on the can of worms, with the huge label of “USER INTENT” plastered on the side.
Again, huge thanks to the guys at YLE and to Chartbeat for the interesting and pioneering work they’ve done. I hope the steps within this tutorial will help you in uncovering yet another interesting aspect of the users’ browsing behavior on your site!