This is a guest post – the first one in a long time! The foreword and summary are written by me, Simo, and the rest is by my esteemed guest author.
How fortunate was I to have been contacted by Arben Kqiku, Digital Marketing & Data Manager from comtogether. Arben is one of our many Simmer students, and he’s walked through the Query GA4 Data In Google BigQuery course, learning a lot along the way.
He wanted to share with me this wonderful case study he wrote using the lessons learned during that course and his prior knowledge of tools and languages like R, Google Sheets, and Google Data Studio.
In this article, Arben tackles the age-old question of how to measure a blog’s effectiveness. The data is based on a BigQuery dataset generated from this blog, which is available to all who take the BigQuery course at Simmer.
The Simmer Newsletter
Follow this link to subscribe to the Simmer Newsletter! Stay up-to-date with the latest content from Simo Ahava and the Simmer online course platform.
A web analysis of Simo Ahava’s blog
Recently, I finished the Query GA4 Data in Google BigQuery course, produced by Simo Ahava and taught by Johan van de Werken. As the name suggests, you learn how to query Google Analytics 4 data by using Google BigQuery, in this case specifically Simo Ahava’s GA4 blog data.
I wanted to test my newly acquired knowledge and this is why I wrote this article.
How to measure a blog’s effectiveness?
A blog is composed of articles, so, logically we need to compare these articles to understand which performs the best. However, what KPIs should we use?
We could use page views – the more page views an article generates the better. This certainly makes sense since page views can be interpreted as a proxy for interest. However, this metric has some limitations. For instance, people could visit an article and leave it right away without reading it. So, we need a metric that indicates whether someone has read an article or not.
We could use the Google Analytics 4 scroll event for this purpose. GA4 records a scroll event each time a user scrolls to 90% of the total length of a page. You can instruct GA4 to automatically collect this event and others from the GA4 interface.
However, this metric also has its limitations. Namely, the length between articles varies greatly. A page with only 300 words will generate more scroll events than a page with 8,000 words, simply because it’s easier to reach the end of it. Therefore, we need to find a way to integrate an article’s length into the equation.
A formula to measure an article’s attractiveness
First of all, we could use scroll events and page views to calculate the scroll conversion rate by using the following formula:
scrolls / page views
However, we could have 2 pages with the same scroll conversion rate, one page with 10 views and the other with 1,000 views. Obviously, a page with 1,000 views is more valuable, so we need to refine our approach.
As mentioned earlier, a scroll is more valuable on a page with 8,000 words than on a page with 300 words. So, we could use a formula that weighs the number of scrolls by the number of words present in an article:
scrolls * words_count
In this way, we give more weight to longer articles.
Now that the abstract part of the article is done, let’s move to the juicy part, the code.
Performance score of each article with scrolls and word count
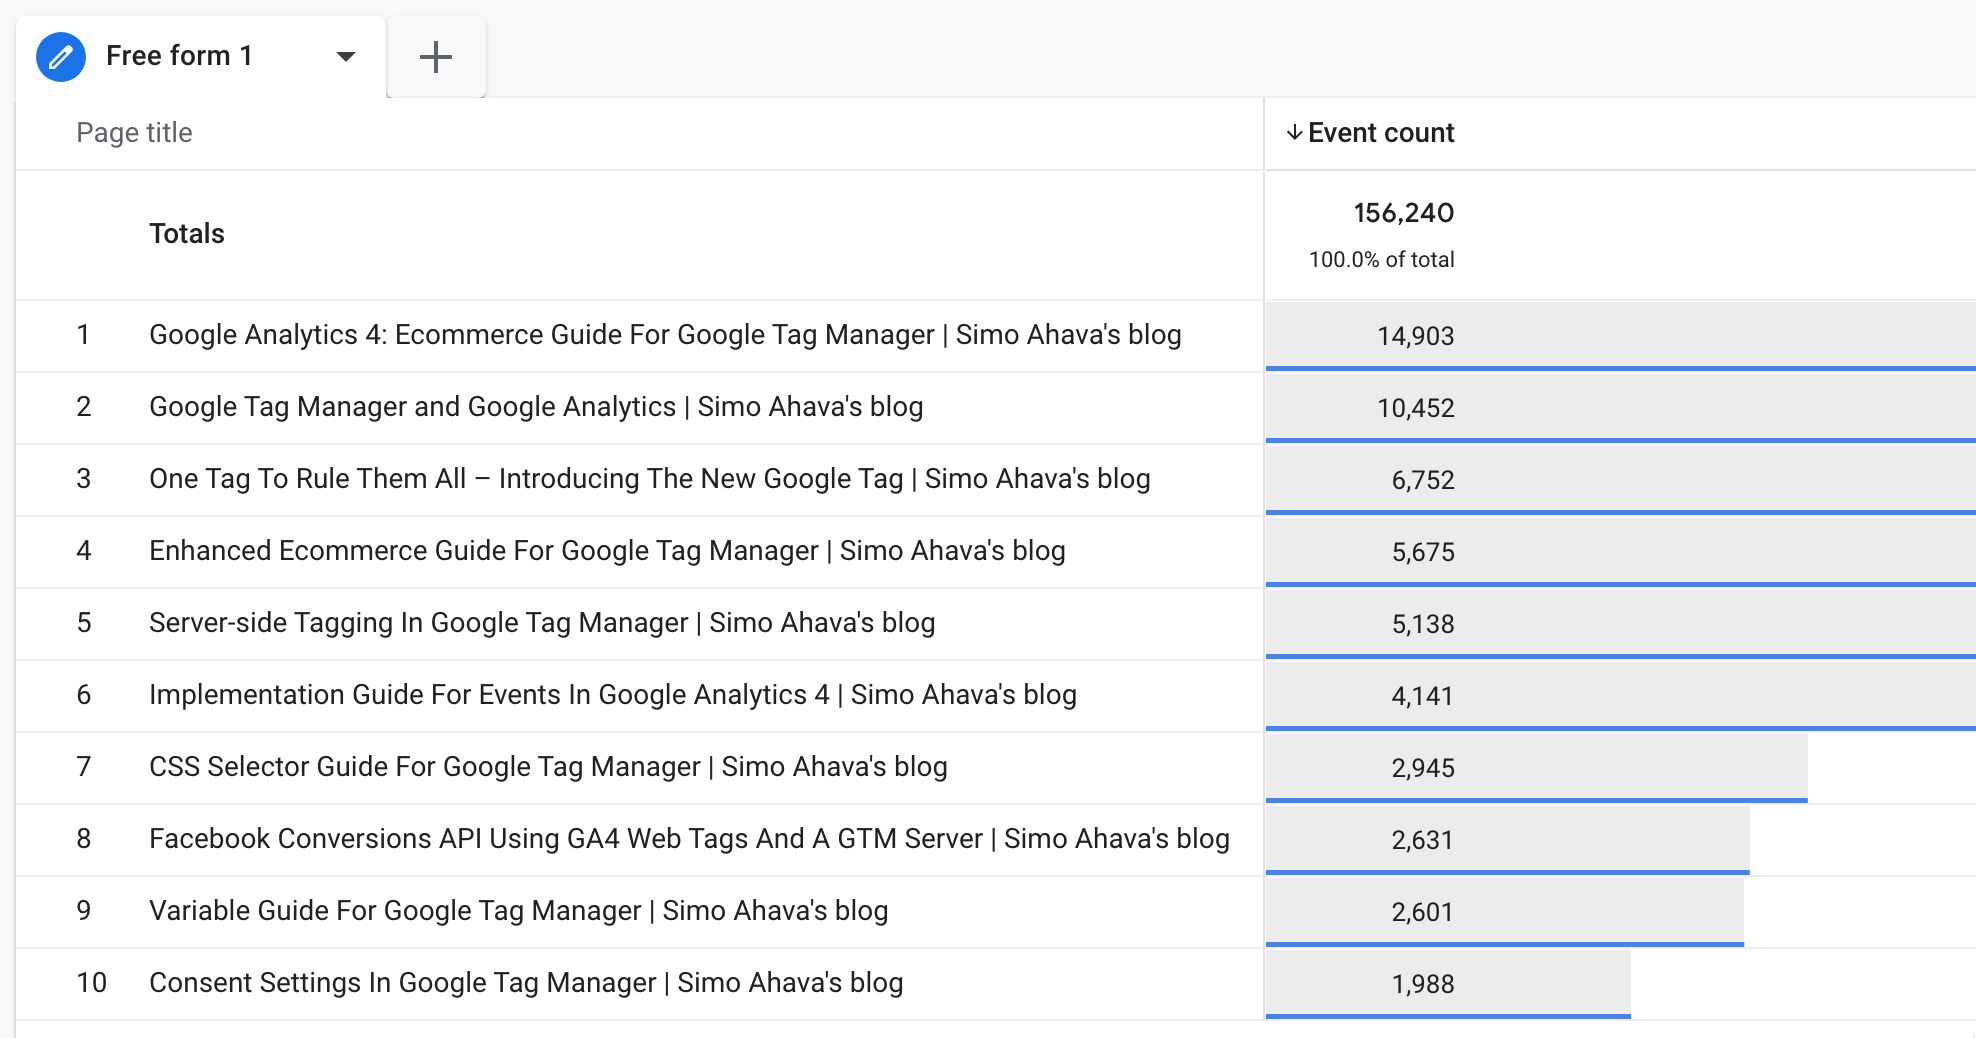
In BigQuery, it’s fairly easy to extract scrolls per page.
select
  (select value.string_value from unnest(event_params) where key = 'page_location') as page_location,
  countif(event_name = 'scroll') as scrolls
from
  `dataset.table.events_*`
where
  _table_suffix between '20220601' and '20220831'
group by
  page_location
order by
  page_views desc
Let’s take a closer look.
First, with the following code, we need to extract the page_location event parameter. To do so, we first need to unnest the event parameters and then select the page_location parameter.
(select value.string_value from unnest(event_params) where key = 'page_location') as page_locationScroll events are easier to extract – we simply need to tell BigQuery to count an event each time it encounters a scroll event while parsing the source table.
countif(event_name = 'scroll') as scrollsFinally, we need to group by page_location, because we want to use the scrolls per page in our formula.
group by
  page_location
Extracting the word count
To extract the word count per page, additional tools are required. For this, I used R and Google Sheets.
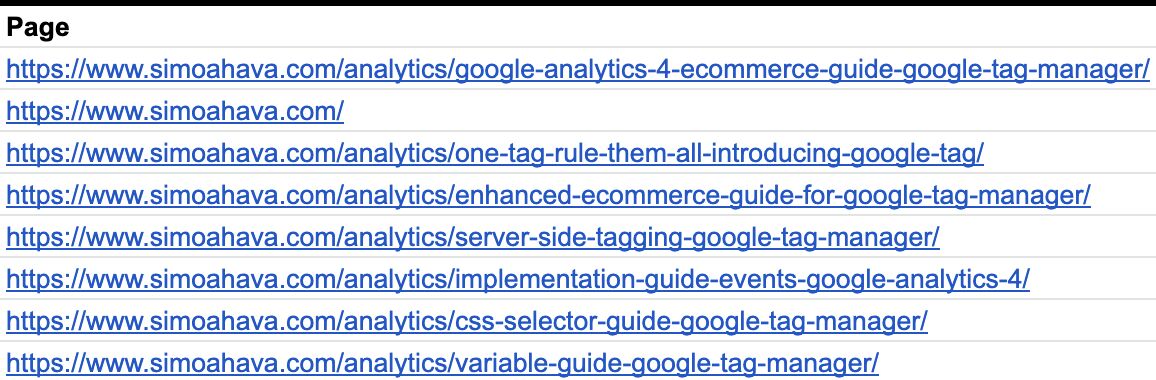
The first thing I did was to extract the pages that had at least 100 page views between June 1st and August 31st, and I pasted the results into this Google Sheet.
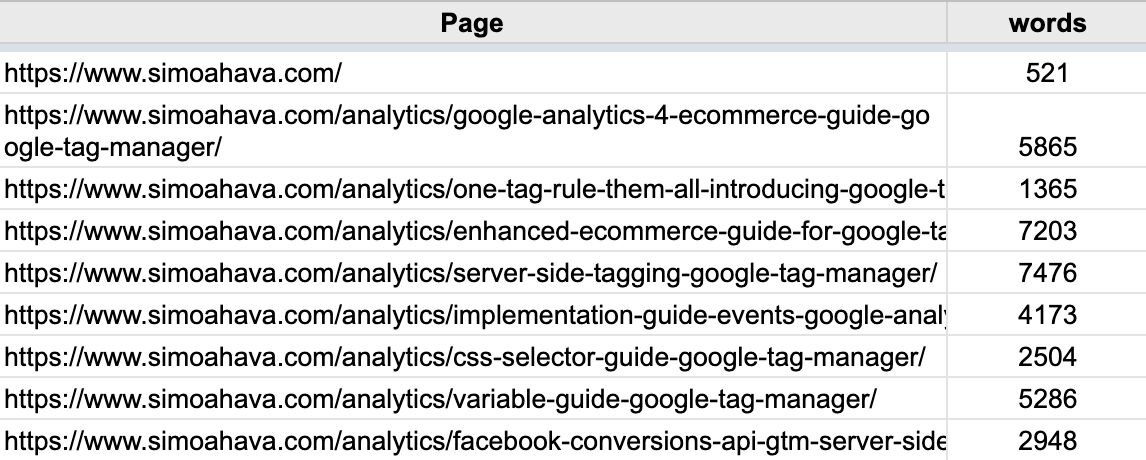
Then, I used R to calculate the word count of each page.
However, I encountered one obstacle when retrieving the HTML pages. Namely, there was a lot of information that did not correspond to real words, such as JavaScript code snippets and CSS styling. This is why I compared each word to an English dictionary and only counted real English words.
Here are the concrete steps I took in R:
- Load packages
- Retrieve all page URLs from the Google Sheet linked to above
- Retrieve an English dictionary from GitHub
- For each page:
4.1. Retrieve all the words
4.2. Clean the words
4.3. Join with the English dictionary
4.4. See if there is a match in the dictionary. If there is, count it as 1 (TRUE)
4.5. Sum all the words that have a match in the dictionary - Output the result in the same Google Sheet
This is what the output looks like.
And this is the R code I used.
# Packages
library(tidyverse)
library(googlesheets4)
library(rvest)

# Retrieve data from Google sheet
sheet_URL = 'https://docs.google.com/spreadsheets/d/1tkOnw41zj7lQLonV-bEjJFszY5jSlMylmn9ntQO2qcA/edit#gid=0'
sheet_id = gs4_get(sheet_URL)
page_data = range_read(sheet_id)

# Retrieve English dictionary
dict = read.table(file = url("https://github.com/dwyl/english-words/raw/master/words_alpha.txt"), col.names = "words") %>%
   as_tibble() %>%
   mutate(condition = TRUE)

# Read data from web pages and count words per page
words_per_page = page_data %>%
   mutate(words = map(Page, ~return_words(web_page = .x))) %>%
   mutate(words = words %>% unlist())

# Output data to Google sheets
sheet_write(words_per_page, sheet = 'output', ss = sheet_id)

# Functions
return_words = function(web_page){
   words = web_page %>%
       read_html() %>%
       html_text() %>%

       # clean words for table
       tolower() %>%
       str_remove_all(pattern = '"') %>%
       str_remove_all(pattern = ",|:|\\.|\\\n") %>%
       strsplit(' ') %>%
       as_tibble('words') %>%
       set_names("words") %>%

       # join with English dictionary
       left_join(dict) %>%

       # keep only words from the english dictionary
       filter(condition == TRUE) %>%
       pull(condition) %>%
       sum()

   return(words)
}
Next, in Google Sheets, I created a case...when statement for each page in order to create a column for word count in BigQuery.
Later, I copied all these case...when statements and pasted them back to BigQuery. To avoid showing a query with 358 case...when statements, I’ll only display a handful of them here.
with prep as (
select
  (select value.string_value from unnest(event_params) where key = 'page_location') as page_location,
  countif(event_name = 'scroll') as scrolls
from
  `simoahava-com.analytics_206575074.events_*`
where
  _table_suffix between '20220601' and '20220831'
group by
  page_location
order by
  page_views desc),

prep_words as (
select
  *,
  case
    when page_location = 'https://www.simoahava.com/analytics/google-analytics-4-ecommerce-guide-google-tag-manager/' then 5865
    when page_location = 'https://www.simoahava.com/' then 521
    when page_location = 'https://www.simoahava.com/analytics/one-tag-rule-them-all-introducing-google-tag/' then 1365
    else null end as words_per_article
from
  prep)

select
  *,
  scrolls * words_per_article as performance_score
from
  prep_words
order by
  performance_score desc
Load it all in Google Data Studio
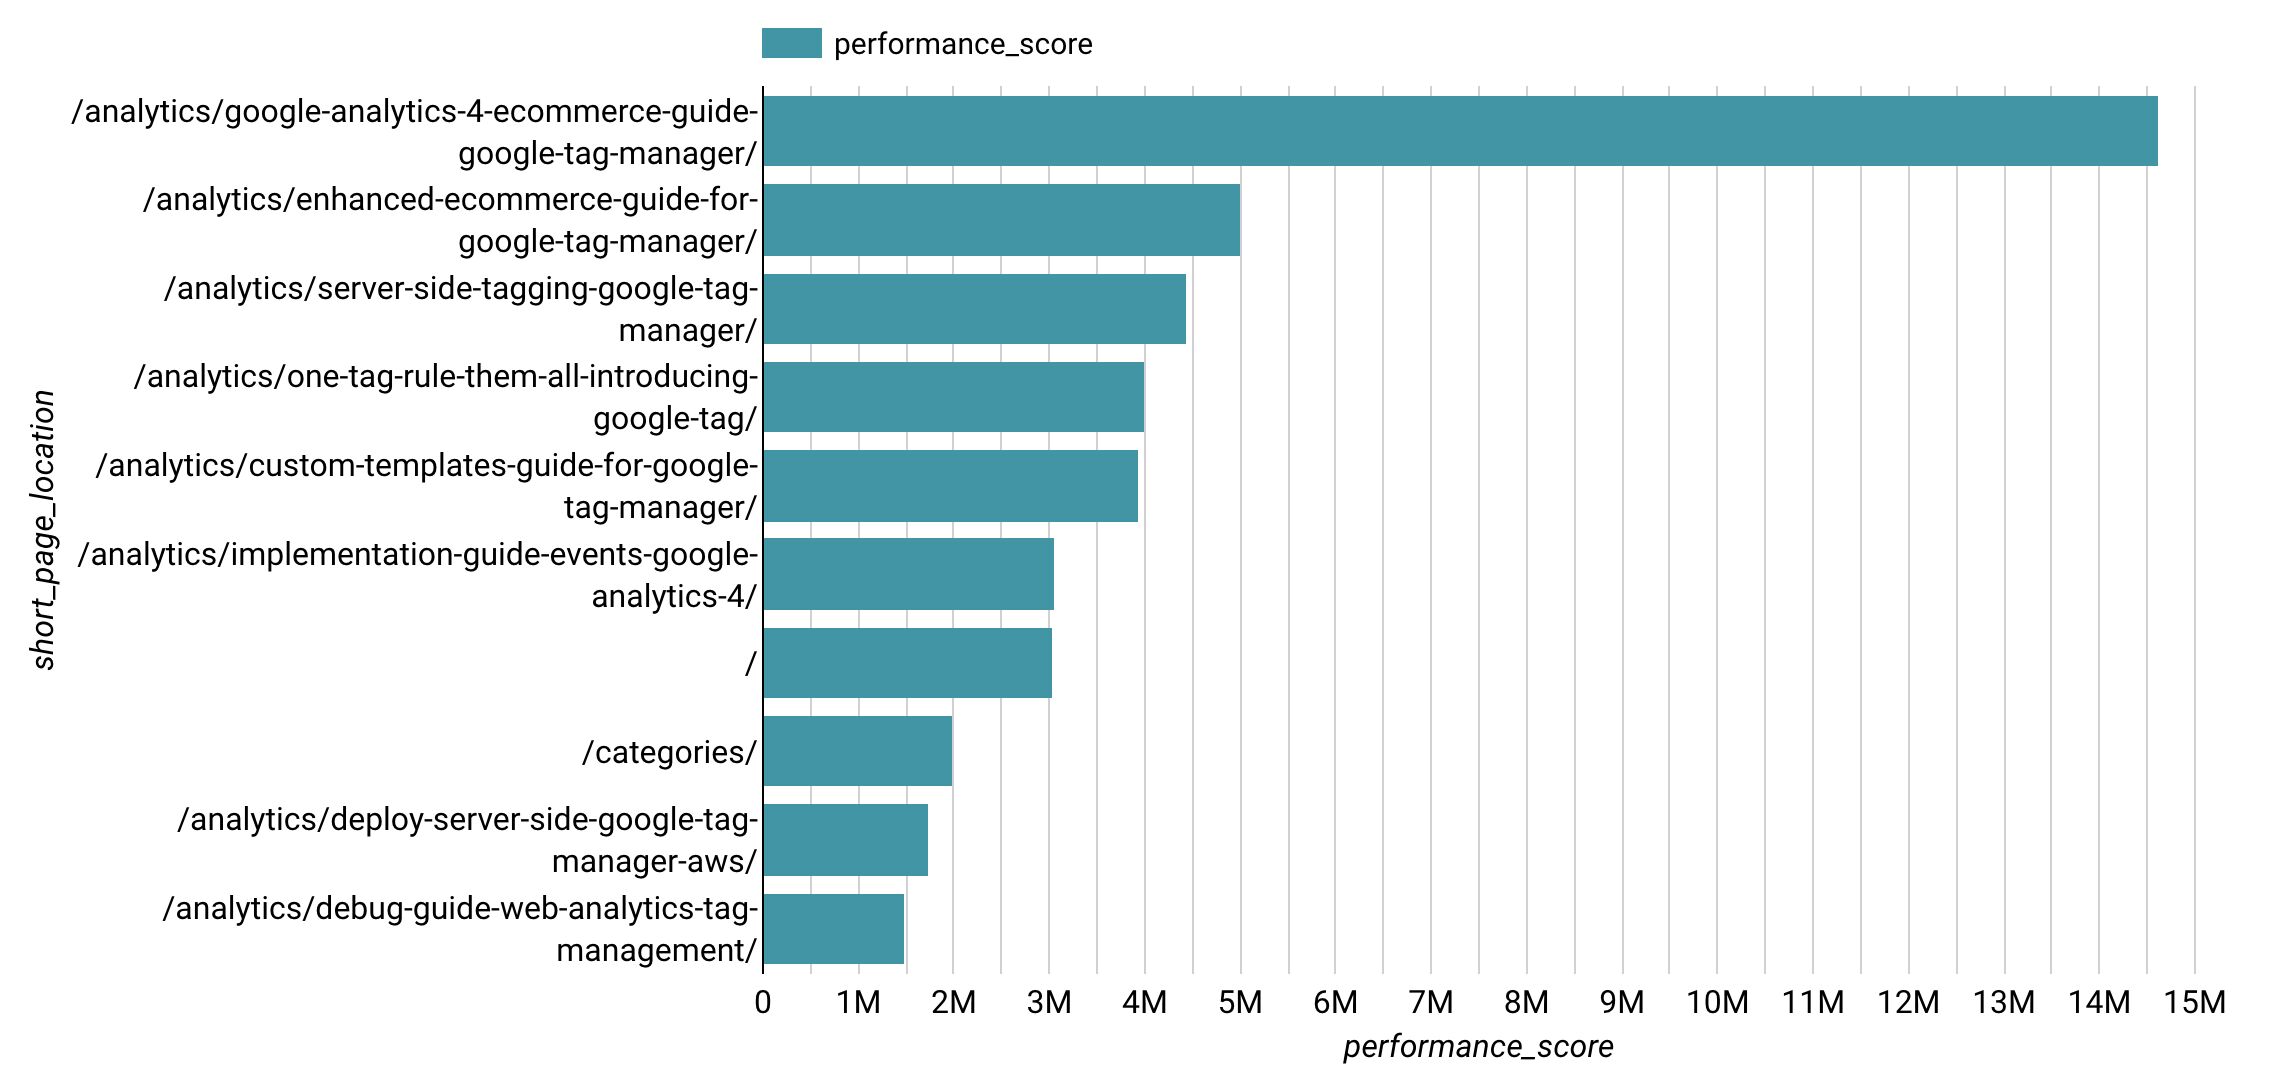
With Google Data Studio, I created this horizontal bar chart which displays the performance score by page.
We can clearly see that the article Google Analytics 4: Ecommerce Guide For Google Tag Manager dominates the results.
Performance score by page and source / medium
In addition to knowing which articles have the best performance score, it would be interesting to see how they compare when segmented by source / medium. It may be that certain source / medium combinations could bring more interested users.
with prep as (
select
  concat(traffic_source.source, " / ", traffic_source.medium) as source_medium,
  (select value.string_value from unnest(event_params) where key = 'page_location') as page_location,
  countif(event_name = 'scroll') as scrolls
from
  `simoahava-com.analytics_206575074.events_*`
where
  _table_suffix between '20220601' and '20220831'
group by
  source_medium,
  page_location
order by
  scrolls desc),

prep_words as (
select
  *,
  case
    when page_location = 'https://www.simoahava.com/analytics/google-analytics-4-ecommerce-guide-google-tag-manager/' then 5865
    when page_location = 'https://www.simoahava.com/' then 521
    when page_location = 'https://www.simoahava.com/analytics/one-tag-rule-them-all-introducing-google-tag/' then 1365
    else null end as words_per_article
from
  prep)

select
  source_medium,
  page_location,
  sum(page_views) as page_views,
  sum(scrolls) as scrolls,
  sum(words_per_article) as words_per_article,
  sum(scrolls * sum(words_per_article) as performance_score
from
  prep_words
group by
  source_medium,
  page_location
having
  words_per_article is not null
  and scrolls > 100
order by
  page_views desc
Note from Simo: this query uses the
traffic_source.*dimensions for source / medium. These are actually the first acquisition campaign details rather than the session-scoped campaign metadata that this query would benefit from to a greater degree. Unfortunately, at the time of writing this article, session-scoped data like this is unavailable in the BigQuery export, so usingtraffic_source.*is a decent enough proxy.
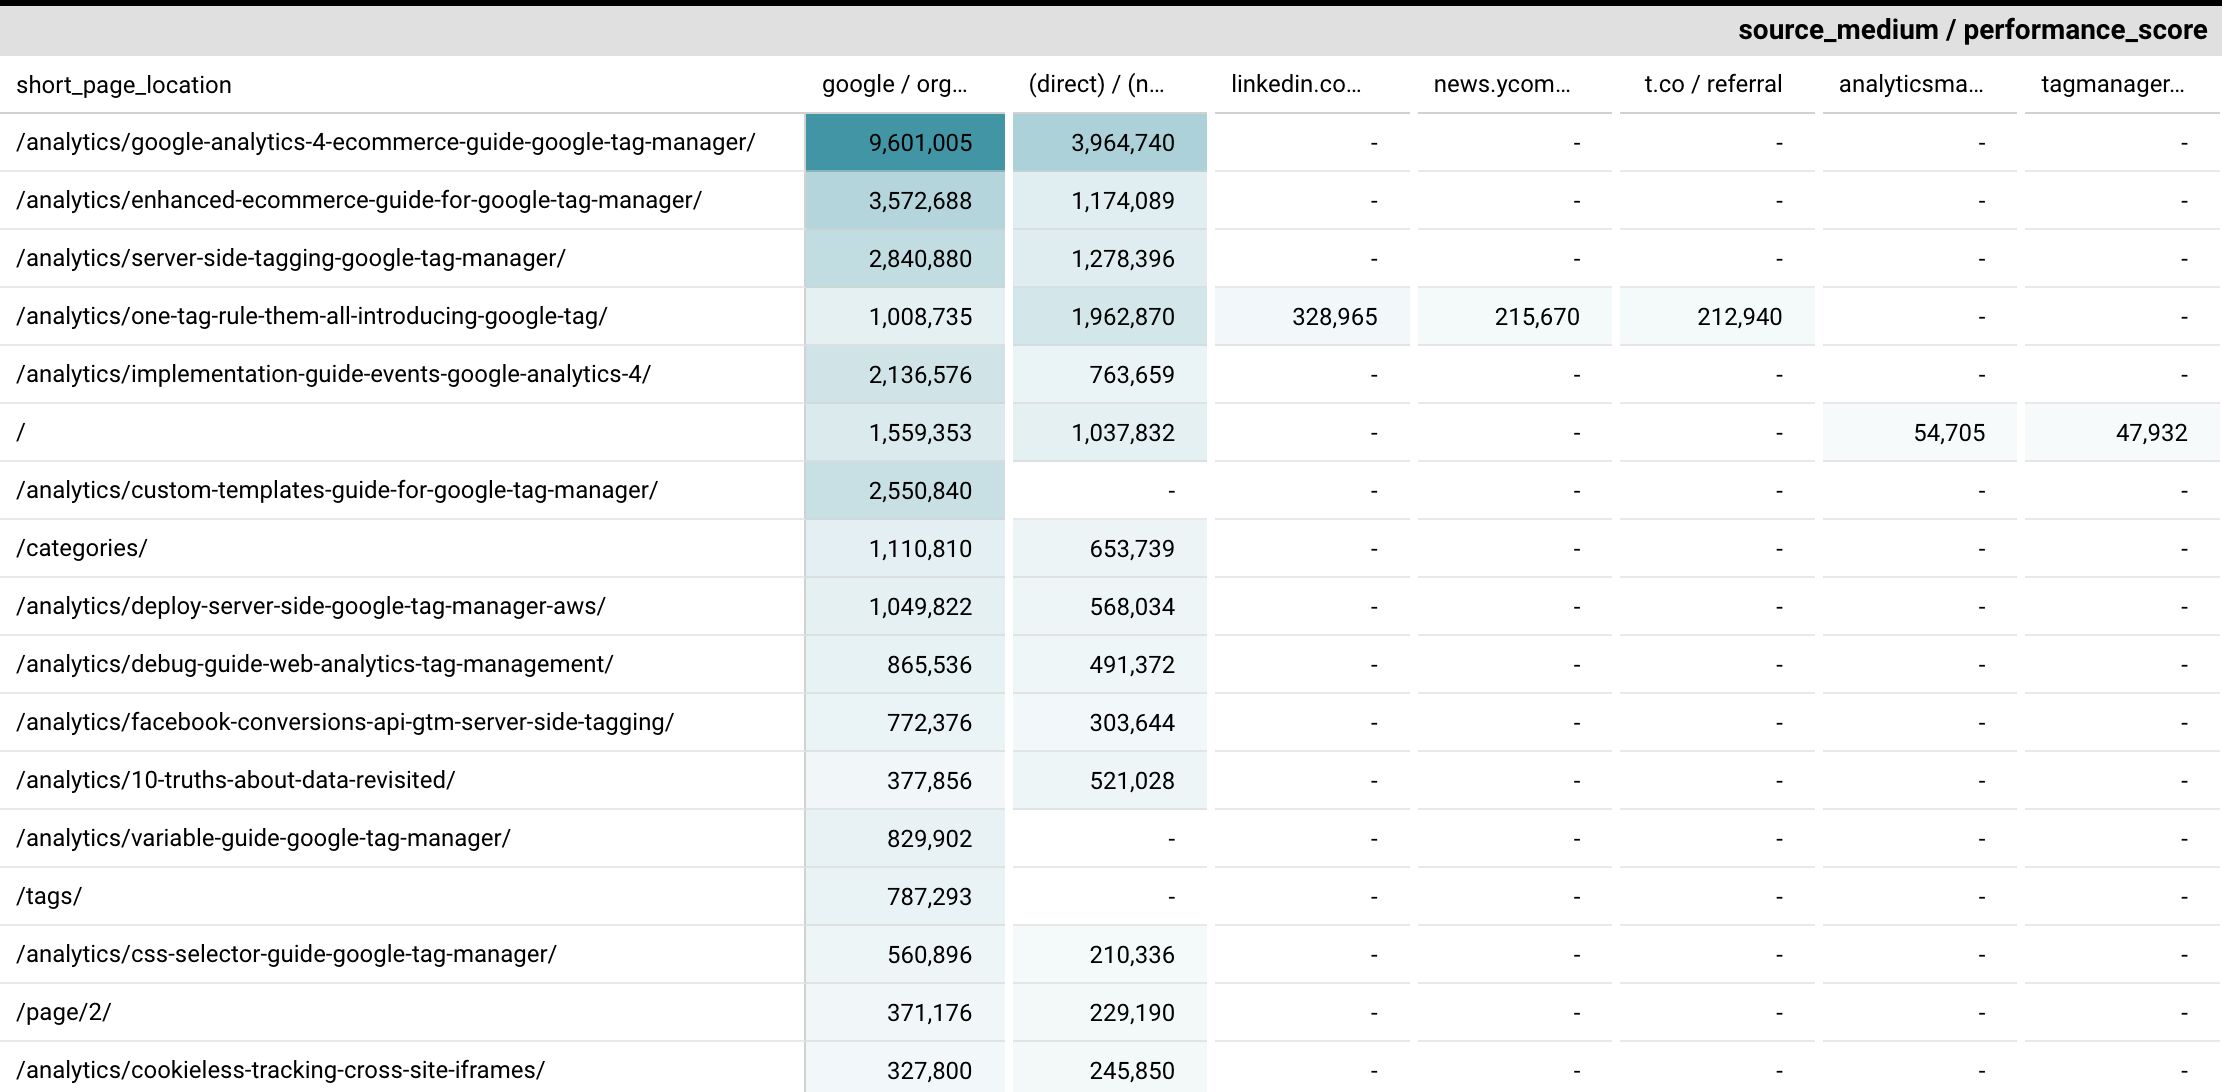
When you split the data between two dimensions, it’s sometimes useful to visualize it with a heatmap.
In this case, we can see that the source / medium with the highest performance score is google / organic.
I only selected combinations with at least 100 scrolls. That’s why the right-hand side of the heatmap is mostly empty.
However, it’s interesting to note that the fourth article in the list, One Tag To Rule Them All: Introducing The New Google Tag, has a performance score for other sources as well.
This tells us that the article in question has a more widespread penetration in terms of acquisition channels.
Attribute a performance score to each user
To associate a performance score to each user, we’ll use the GA4 field user_pseudo_id, which stores the client identifier that GA4 attributes to each browser instance. Although it doesn’t necessarily reflect the actual number of people that visit the site, it’s again a decent enough proxy to get us some useful results.
First thing to do is to create the query which aligns the user_pseudo_id together with page_location, the number of scroll events, and the word count for each page.
with prep as (
select
user_pseudo_id,
(select value.int_value from unnest(event_params) where key = 'ga_session_id') as session_id,
(select value.string_value from unnest(event_params) where key = 'page_location') as page_location,
countif(event_name = 'scroll') as scrolls,
from
`simoahava-com.analytics_206575074.events_*`
where
_table_suffix between '20220601' and '20220831'
group by
user_pseudo_id,
session_id,
page_location
order by
scrolls desc)
select
user_pseudo_id,
session_id,
page_location,
case
when page_location = 'https://www.simoahava.com/analytics/google-analytics-4-ecommerce-guide-google-tag-manager/' then 5865
when page_location = 'https://www.simoahava.com/' then 521
when page_location = 'https://www.simoahava.com/analytics/one-tag-rule-them-all-introducing-google-tag/' then 1365
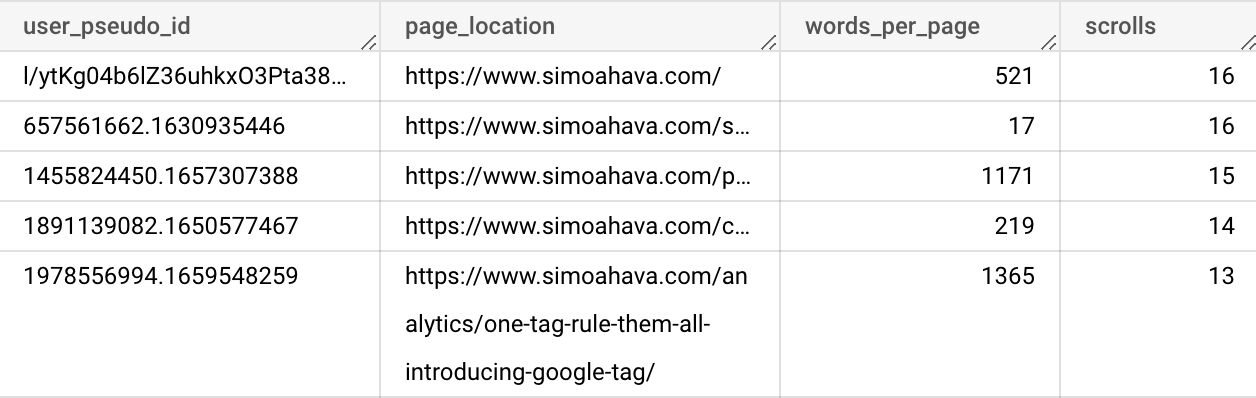
else null end as words_per_page,
scrolls
from
prepThis is what the query results look like.
Now I can create a query to parse the results table shown above and get the performance score per user.
with prep as (
select
  user_pseudo_id,
  sum(words_per_page) as words_per_page,
  sum(scrolls) as scrolls
from
  `dataset.result_table`
group by
  user_pseudo_id
having
  words_per_page is not null)

select
  user_pseudo_id,
  scrolls,
  words_per_page,
  scrolls * words_per_page as performance_score
from
  prep
order by
  performance_score desc
Here is the result.
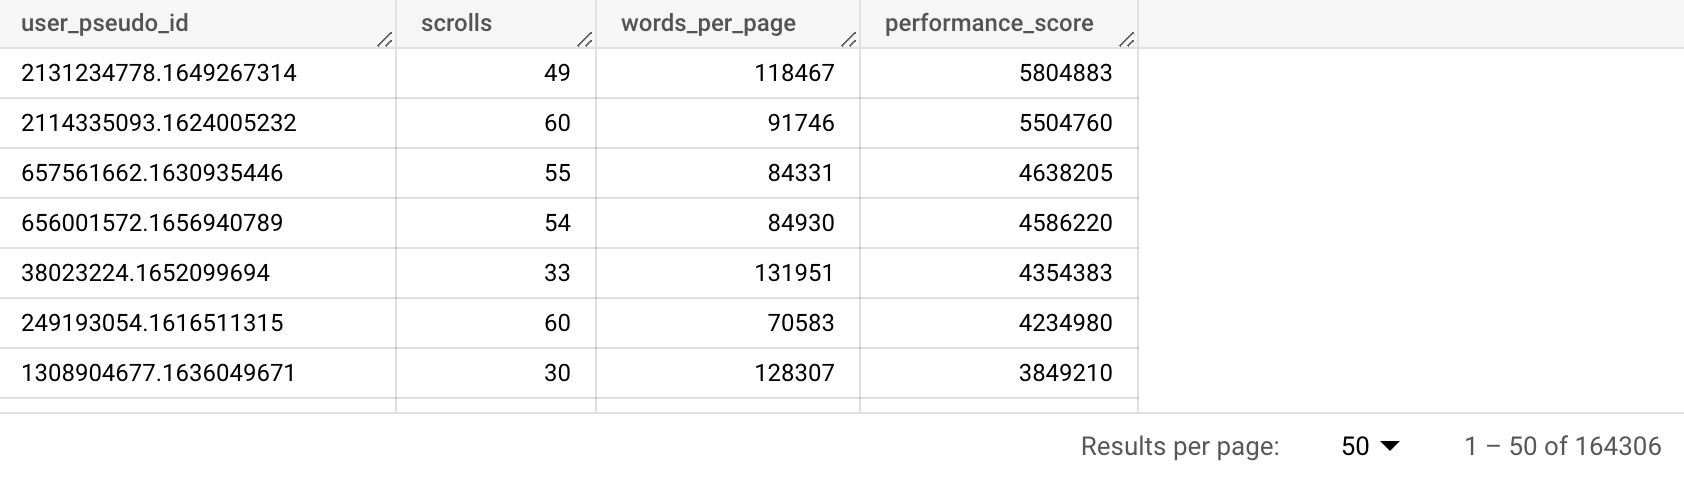
In total, we’ve been able to attribute a performance score to 164,306 users. We could use this information to create remarketing audiences by importing the data in GA4. Alternatively, we could add this information to our CRM and use it as a lead scoring system to power up our email campaigns.
Summary (by Simo)
Thank you, Arben!
Content effectiveness is brutally difficult to measure. I’ve tried, and tried, and tried to visit this topic over and over again in the history of this blog, and I’ve never quite figured out what formula would work best.
I’m not saying Arben has cracked the puzzle, but he does raise an important point about drilling down deeper than what the default metrics offer us.
Engagement is ultimately something ephemeral enough to resist being pigeonholed into a universal formula. I’ve always disliked it when analytics platforms try to insert meaning into clinical metrics by naming them something like “Engagement Rate” or “Bounce Rate”. They’re just metrics. Whether they describe engagement is a different discussion altogether.
I hope you were inspired by Arben’s exploration of the different tools available in the analyst’s arsenal. You can get far with just Google BigQuery, but using R and Google Sheets for creating the base dataset can prove extremely valuable in the long run.
Please check out Arben’s profile on LinkedIn, connect with him, and share your thoughts about his work with him!