Last updated 12 February 2021: Clarified how Preview is shared.
Your favorite tagging platform, Google Tag Manager, now comes equipped with a completely revamped preview mode experience.
Gone are the days of having to minimize the debug pane to prevent it from hogging up screen real estate on the website.
Gone are the days of having to use browser extensions to see what happened in GTM on previous page loads.
Gone are the days of trying to squint really hard at the illegible debug pane while in mobile emulation mode.
The new preview mode is now integrated into the Google Tag Assistant ecosystem. If this makes you nervous, I don’t blame you. Over the years, Google Tag Assistant has been lagging behind the development of Google’s tagging tools.
However, with the release of Google Tag Assistant recordings a few years back, and now with the reimagined preview experience, Google Tag Assistant has suddenly jumped to the foreground when discussing which tools to most rely on for debugging the tags on a given website.
In this article, I’ll walk you through the ins and outs of this new Tag Assistant. It’s not quite perfect yet - there are still some rough edges. But it’s obvious that Google is pushing a lot of resources to improve the debugging experience, as data quality issues that could be nipped at the bud at collection time are still prevalent across tagging setups.
The Simmer Newsletter
Follow this link to subscribe to the Simmer Newsletter! Stay up-to-date with the latest content from Simo Ahava and the Simmer online course platform.
Video
Check out the video below for a walkthrough of the new features.
If you want to watch the video in YouTube, please follow this link.
Comparison: old vs. new
There are obviously some pretty big differences between how preview mode used to be done vs. how it’s done with Tag Assistant.
| Preview mode | Tag Assistant |
|---|---|
Embedded on the page in an <iframe>. | Contained in its own window/tab. |
| Practically impossible to debug mobile browsers. | Mobile debugging is trivial thanks to the detached preview interface. |
| State is managed with a third-party cookie. | State is managed with first-party storage (cookie and localStorage). |
Shows dataLayer interactions for the current page only. | Shows all API interactions (gtag.js, dataLayer) for all the pages navigated to within the previewed site. |
| Designed specifically to be used with web containers. | Now under the Tag Assistant suite - unifies design with server-side tagging. |
| Requires authentication (e.g. through a shared preview link). | Debugging Google Tag Manager does require authentication, but gtag.js API calls and hits can be debugged without. |
If you also have the Google Tag Assistant browser extension installed and active, some additional features are enabled for debugging.
The following chapters detail the key features of the new Tag Assistant in Google Tag Manager.
Key features
Tag Assistant preview interface
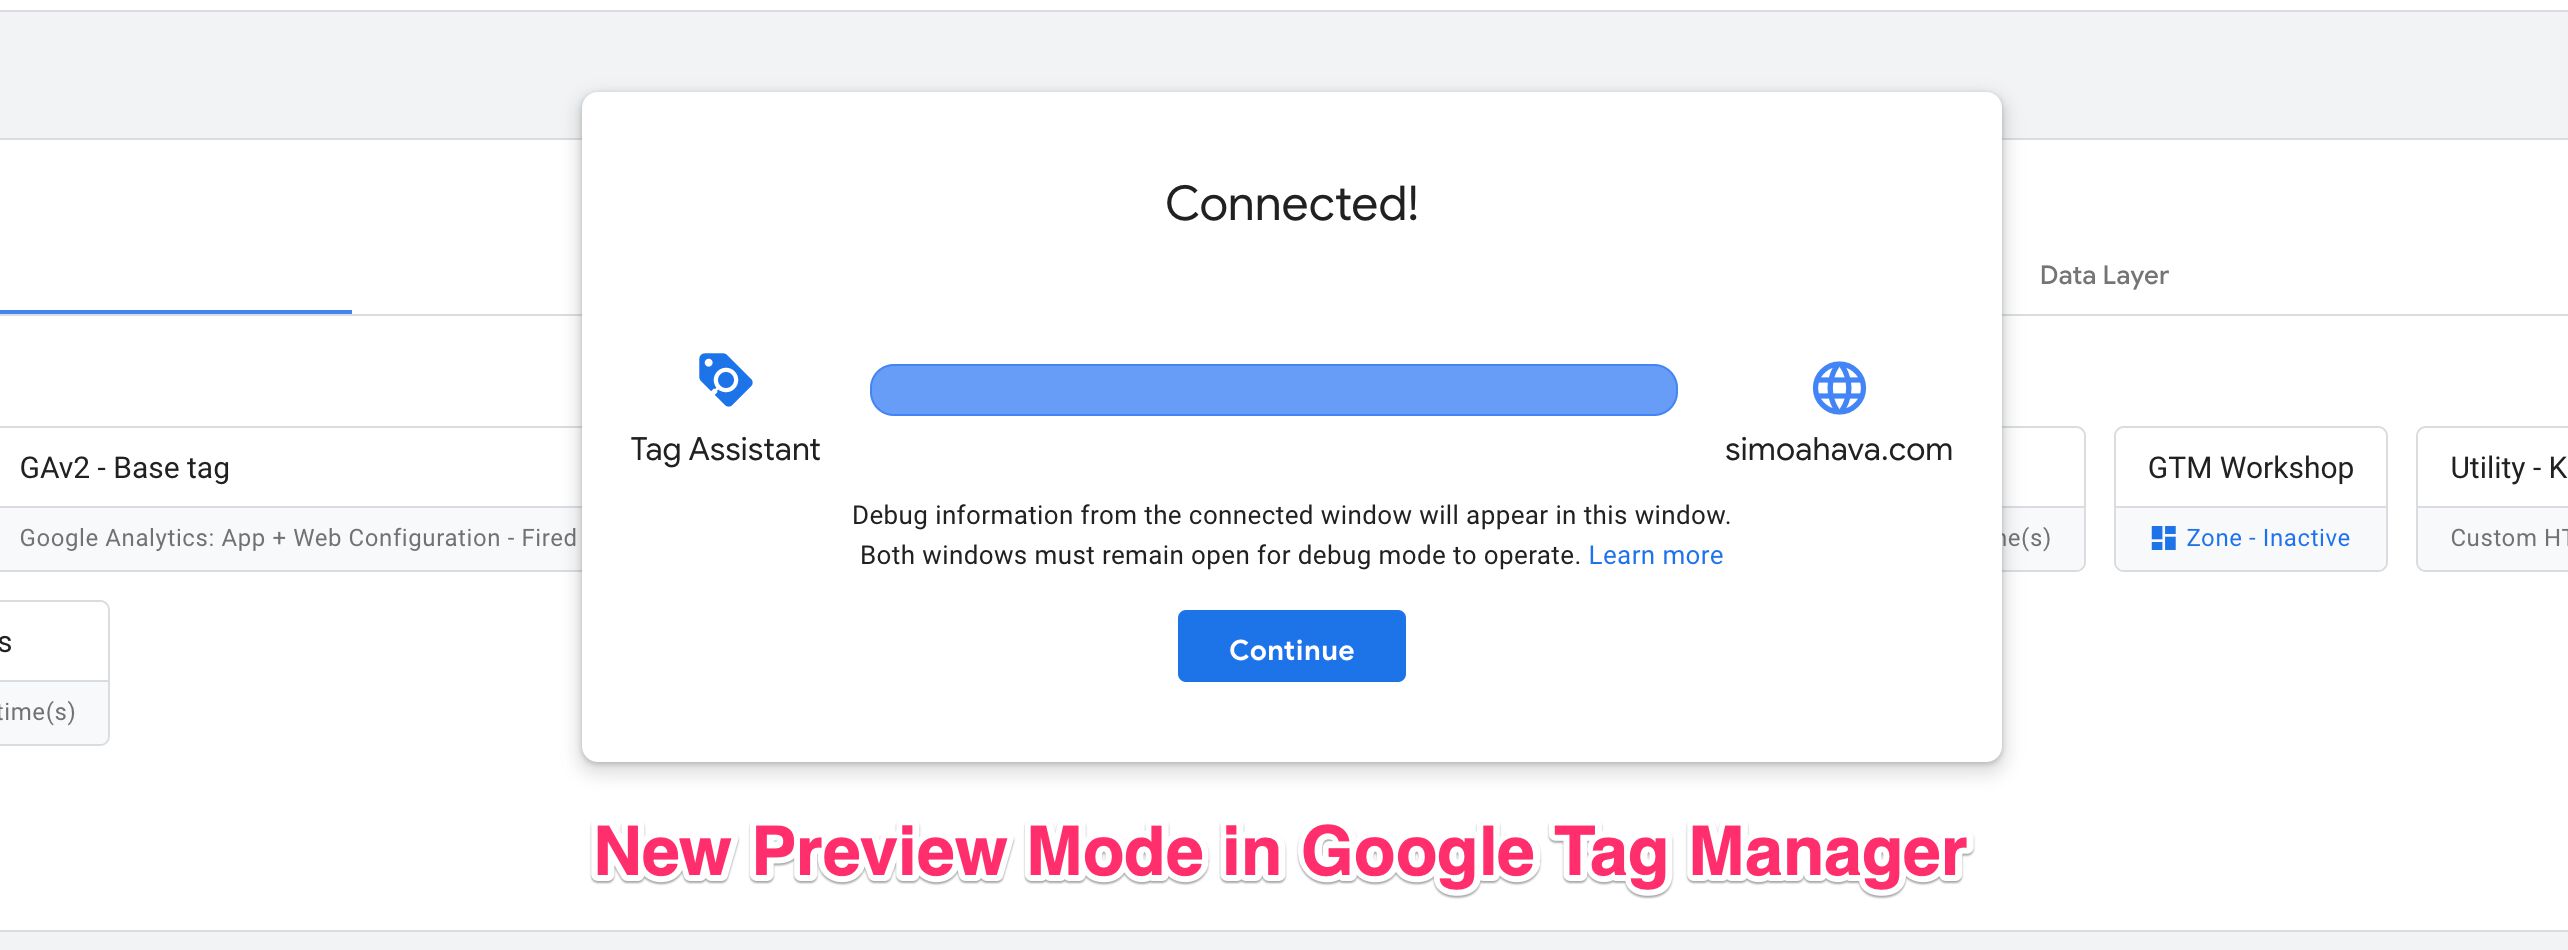
Instead of a preview pane as before, we now have Tag Assistant’s preview interface.
This bears a striking resemblance to the preview mode in server-side tagging, and no, this isn’t a coincidence.
The Tag Assistant browser tab is connected to a single debug window (the page / site being previewed). If you have the Tag Assistant extension, you can debug multiple windows in the same Tag Assistant preview interface.
Tag Assistant collects information across pages. So even if you reload the debug window or if you navigate from one page to another, Tag Assistant will show all interactions collected from all these pages. This makes parsing dataLayer history much easier than before.
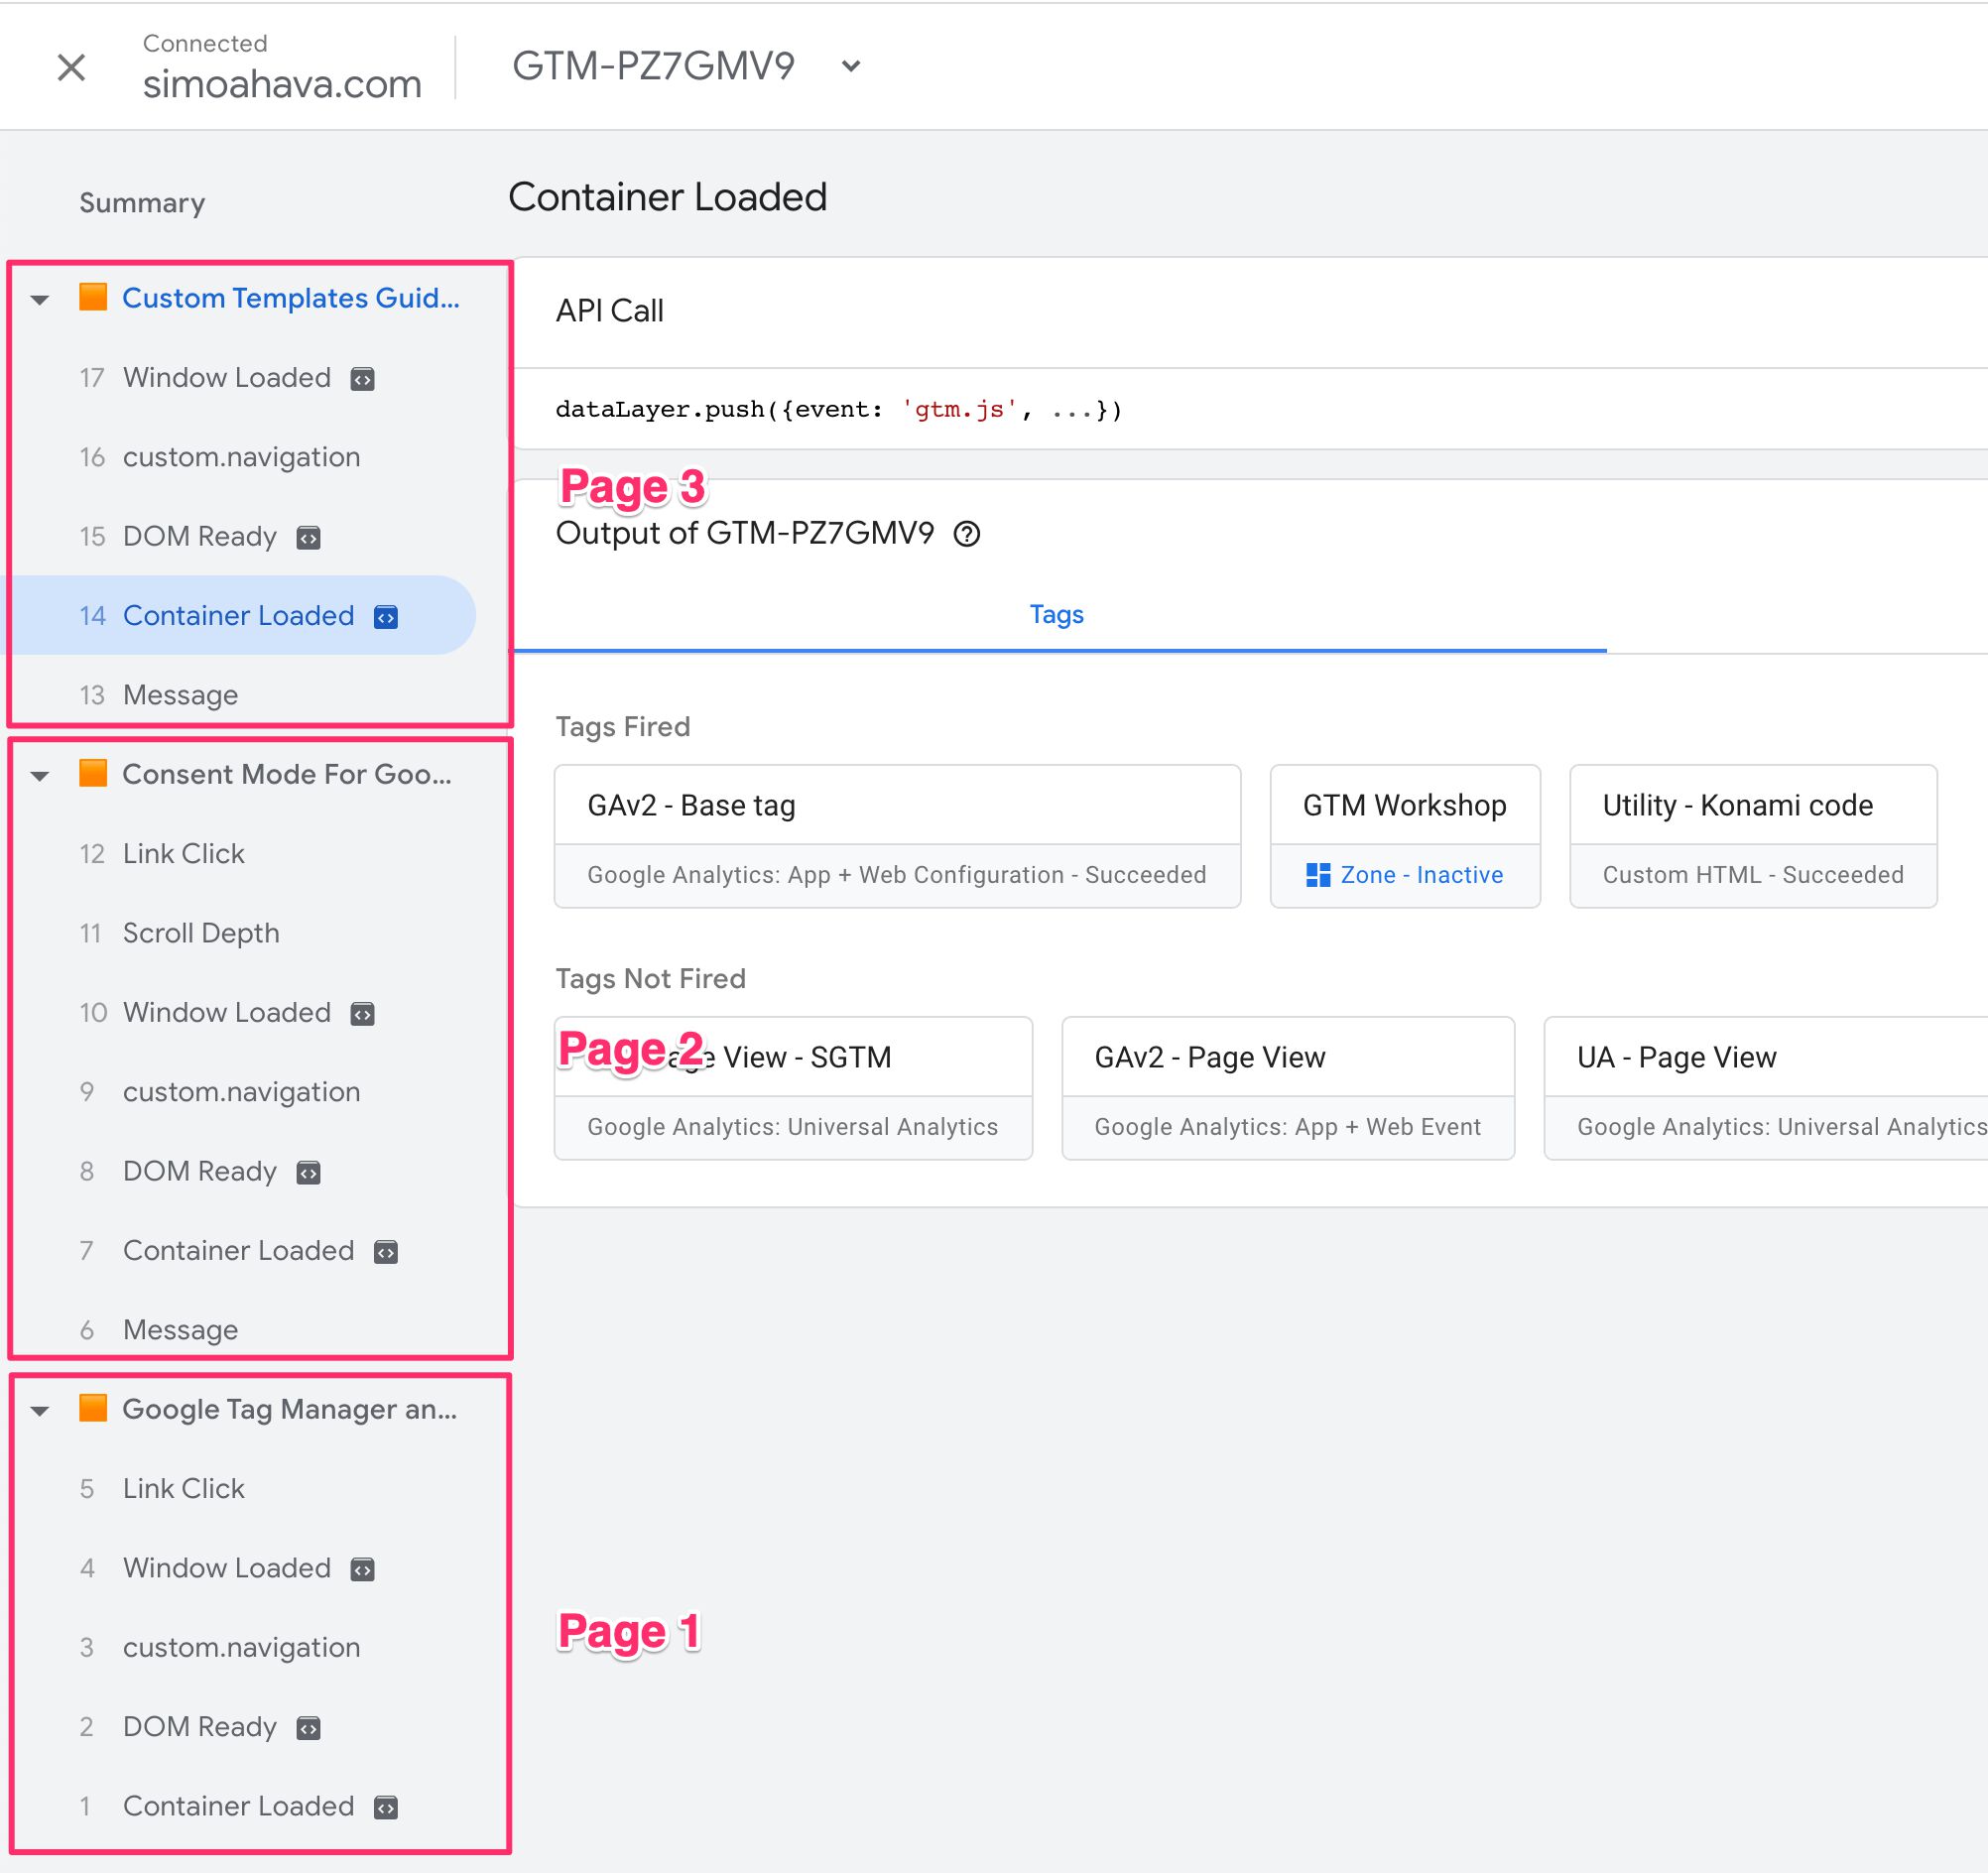
If your site is running both gtag (e.g. via Google Analytics 4) and dataLayer APIs, you can select the different containers from the drop-down menu in the header.
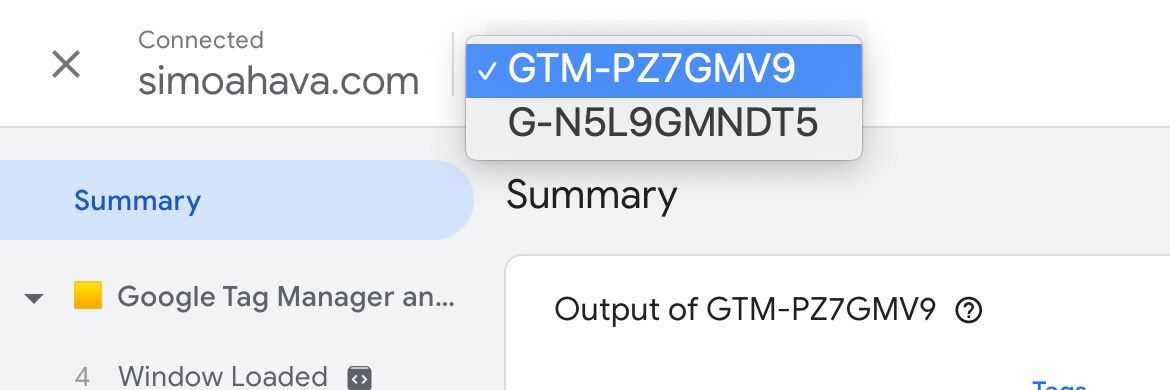
Depending on the APIs the library uses, you’ll might see different configurations in the preview interface itself. You can jump to the chapter on gtag.js integration to see how that approach changes what you see in the preview interface.
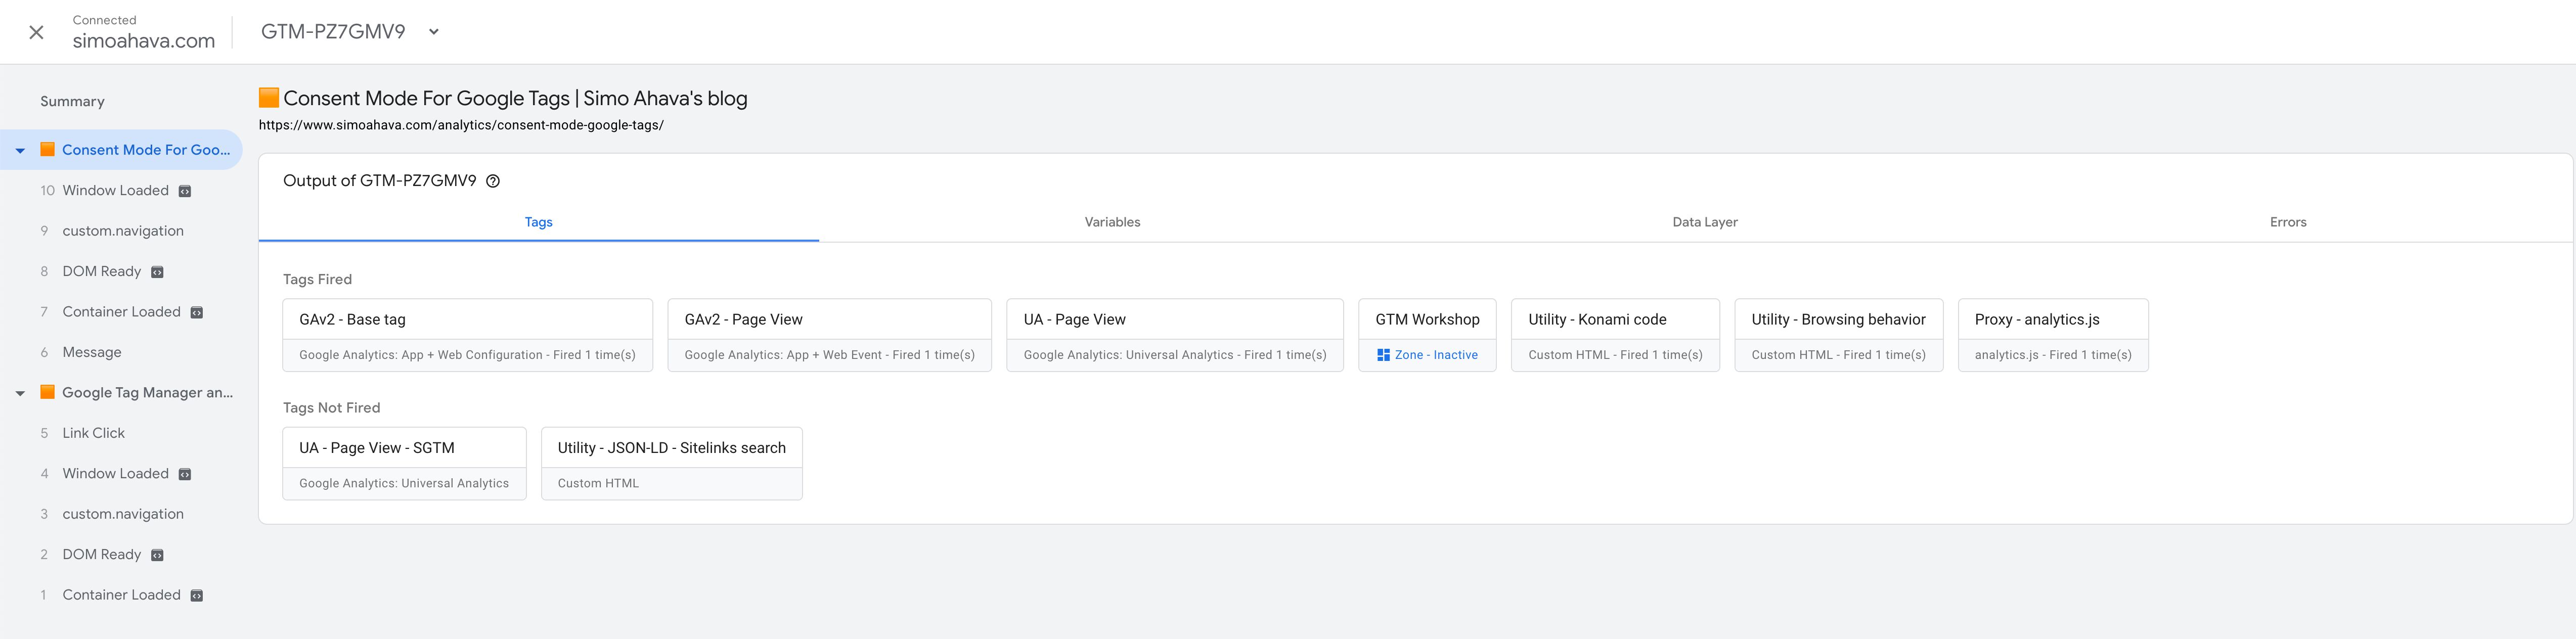
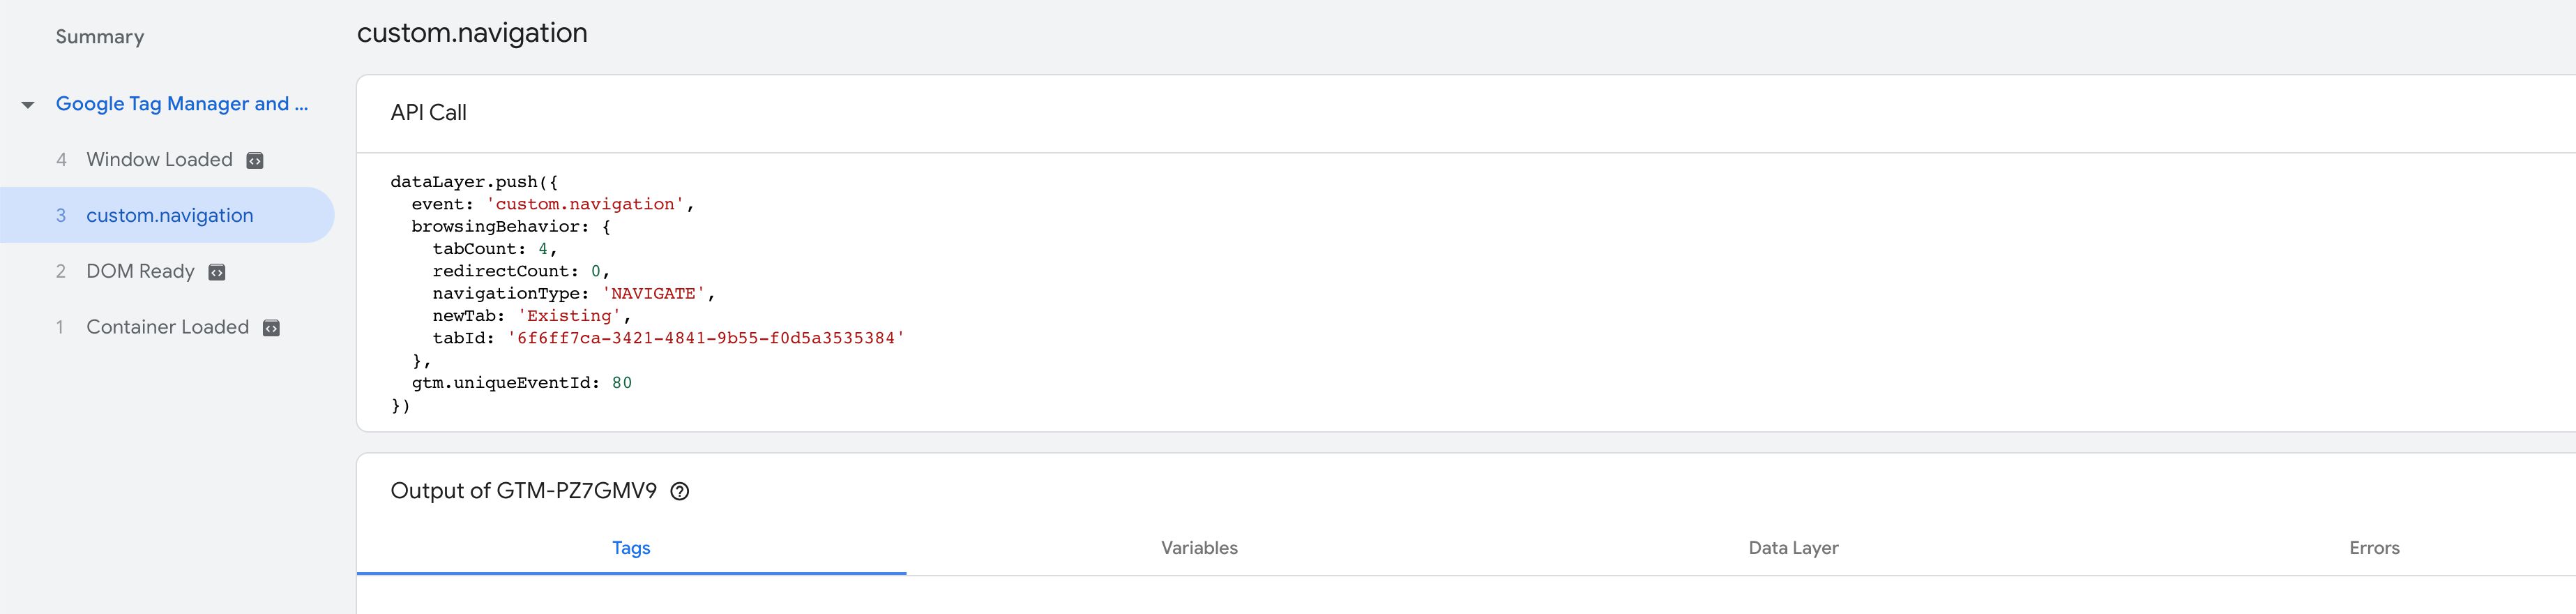
Apart from these changes, the actual capabilities of Tag Assistant are very similar to what we had before. You can see the API interactions (gtag() or dataLayer.push()) in the left-hand side navigation.
If you select an API call, you can see the contents of that call as well as the Tags (or Hits), Variables, Data Layer contents, and Errors caused by that message.
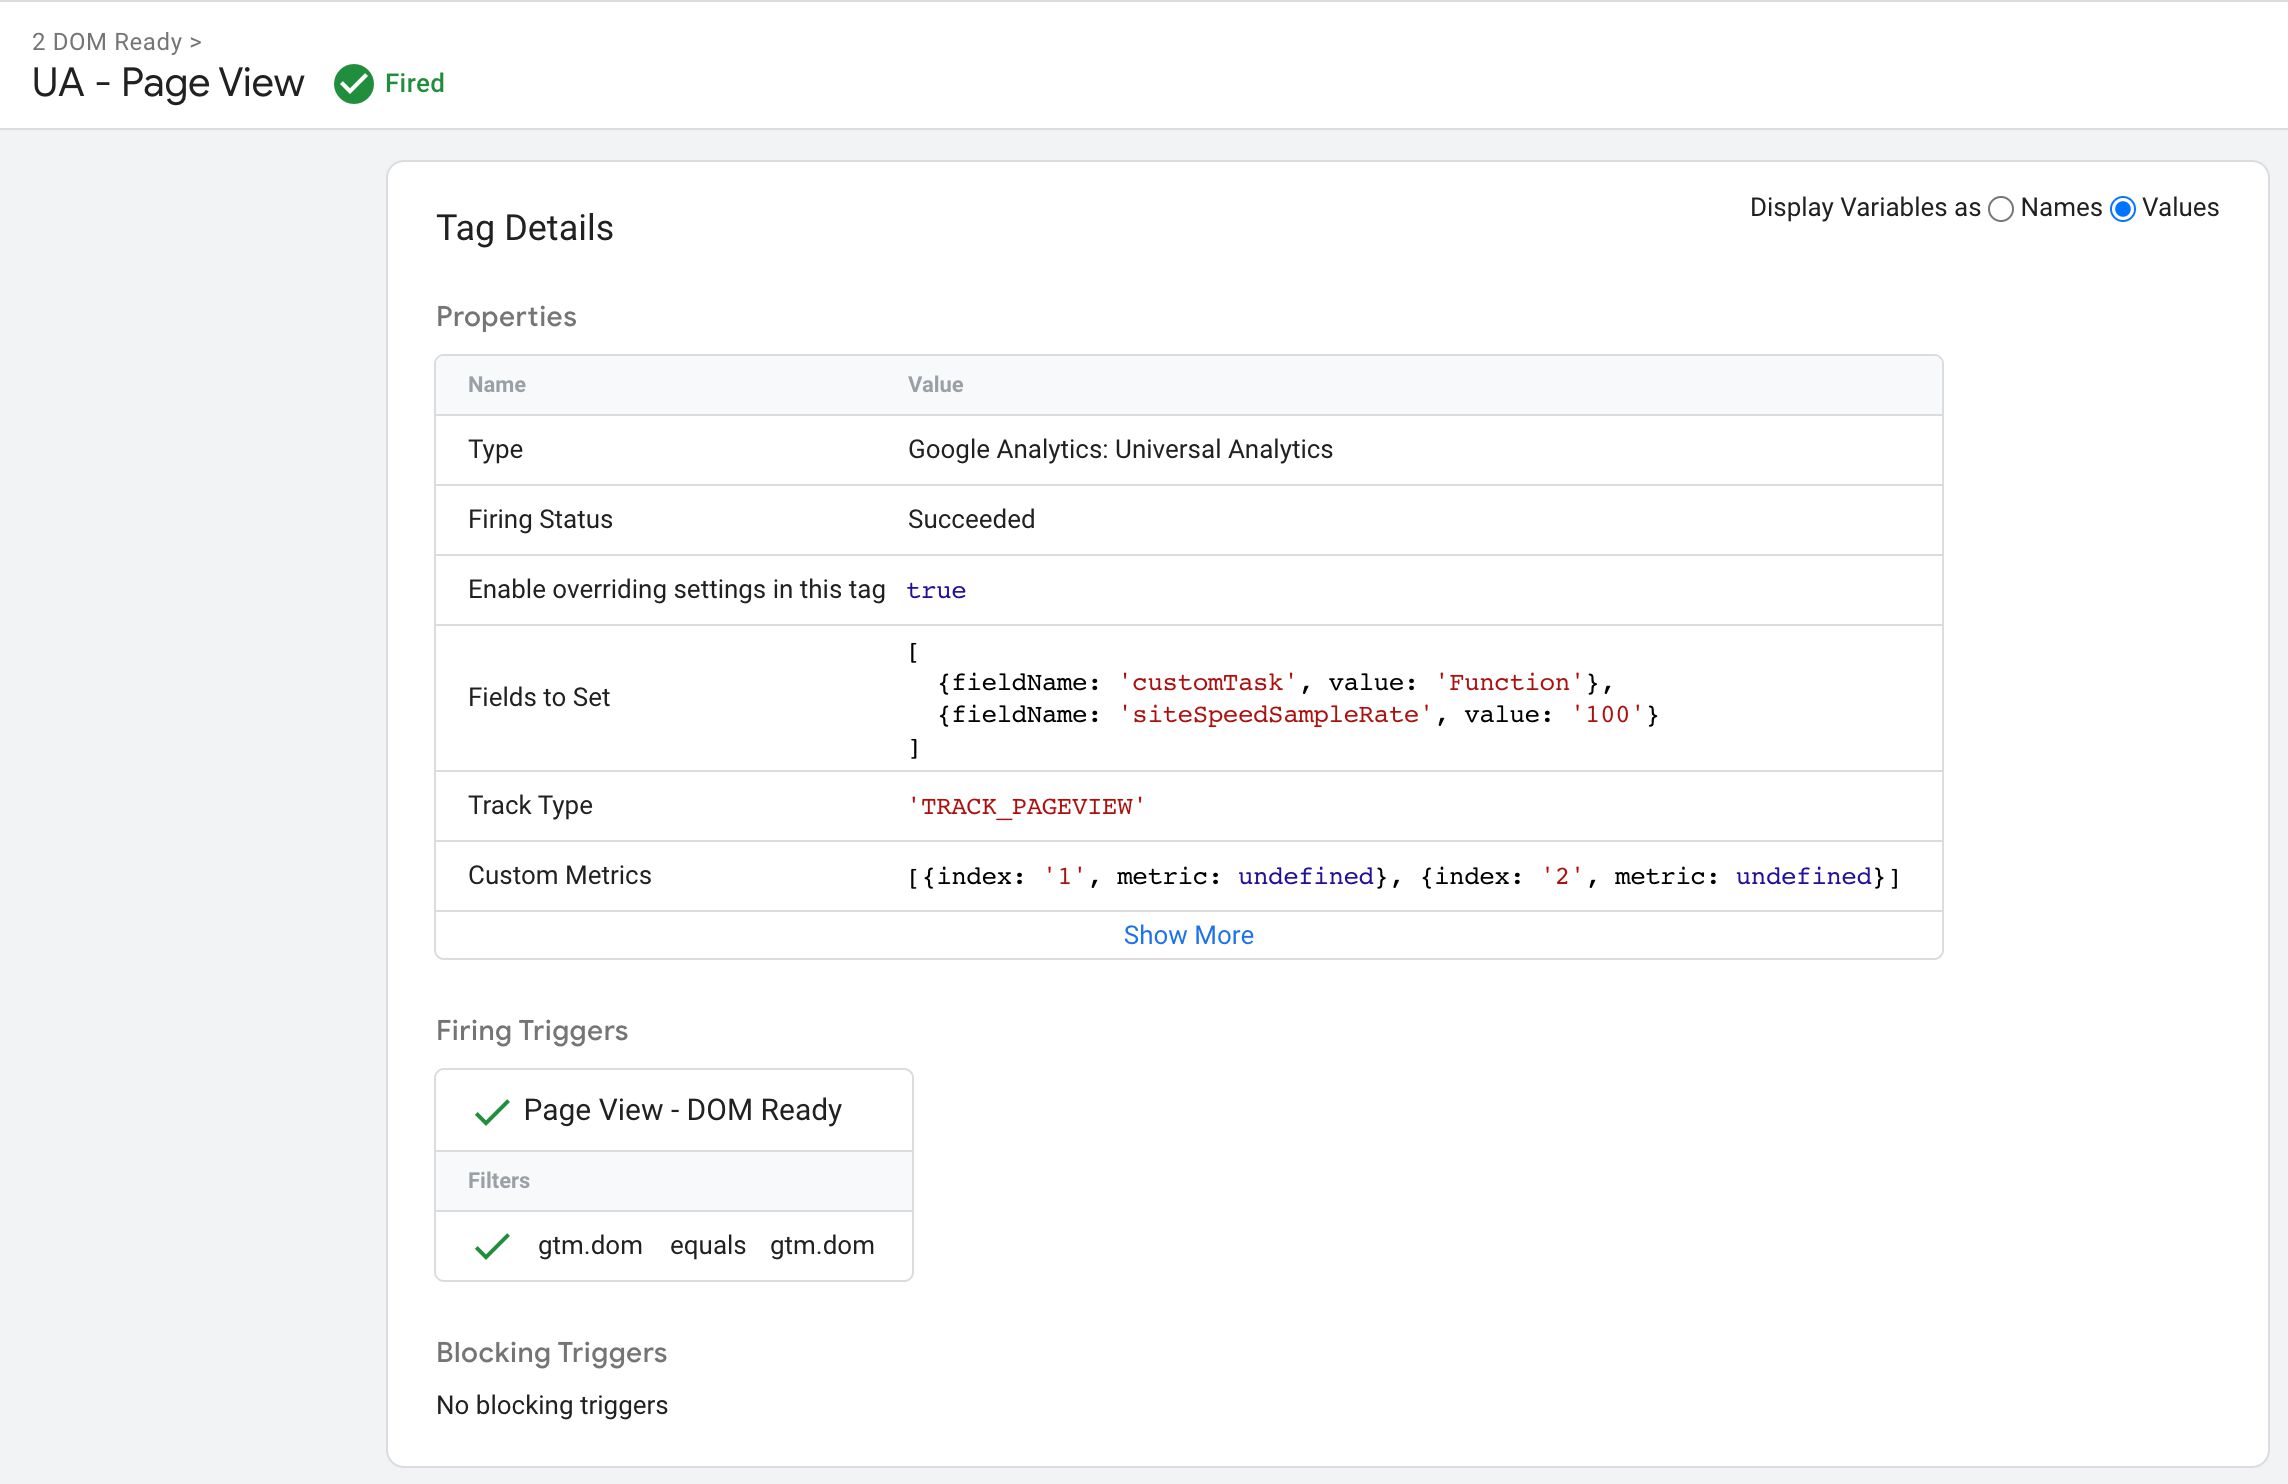
And similarly, if you open a tag, you can see the settings configured for the tag, as well as details about its triggers and exceptions:
The user experience has changed a little and will likely require some getting used to.
Start preview
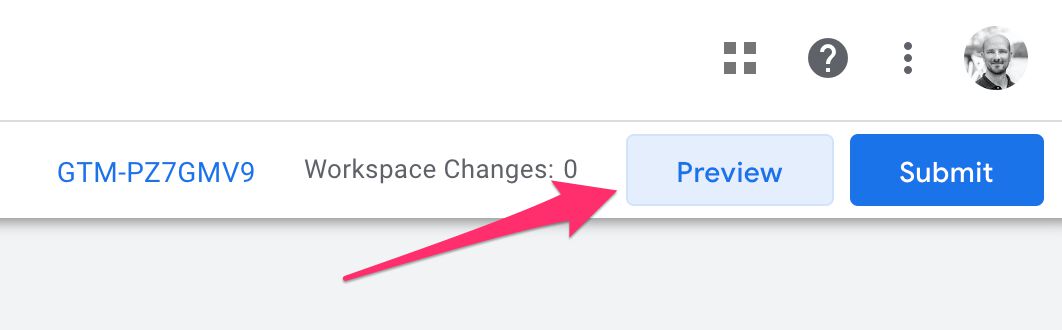
To start previewing a container, you’ll do exactly as you’ve done before. You can click the Preview button in the Google Tag Manager user interface to preview the current workspace draft.
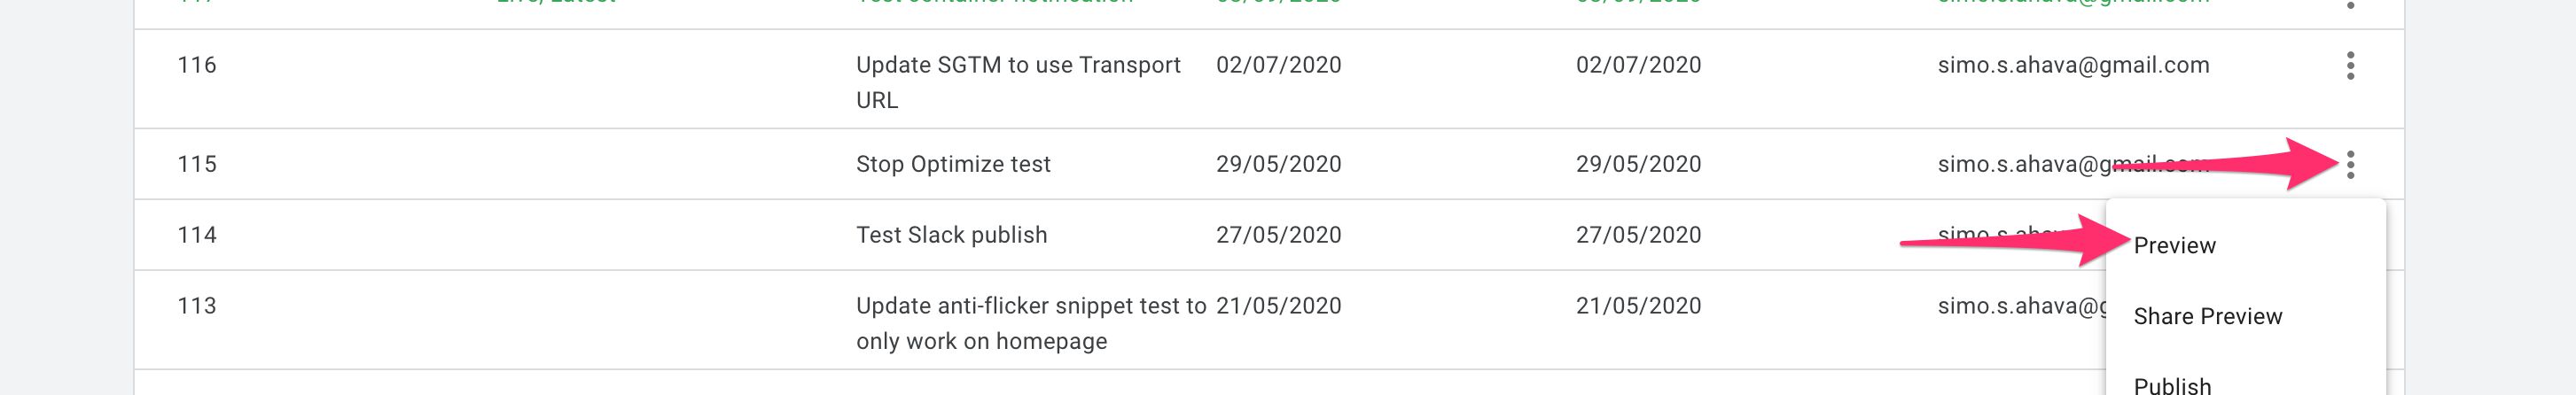
You can also go to the Versions tab, choose a version, click the overflow menu, and then Preview to start previewing a version instead.
Once you click the preview link, a new browser tab will open with the new Tag Assistant interface. It will also automatically pop up an overlay, where you need to input a URL that Tag Assistant will next open the channel for.
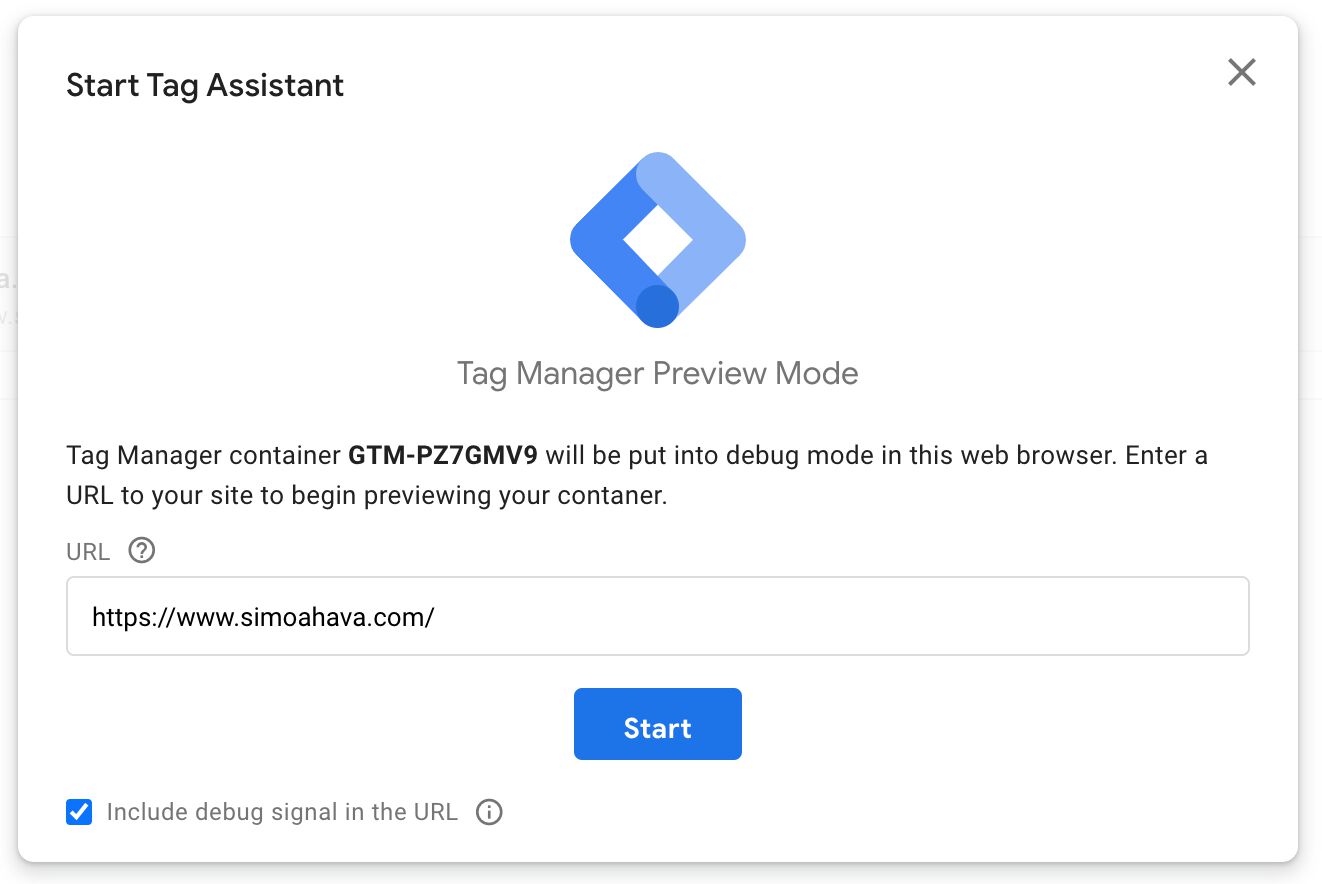
Unless your site is allergic to arbitrary URL parameters, keep the Include debug signal in the URL option checked. This makes establishing the channel far more reliable on most modern browsers.
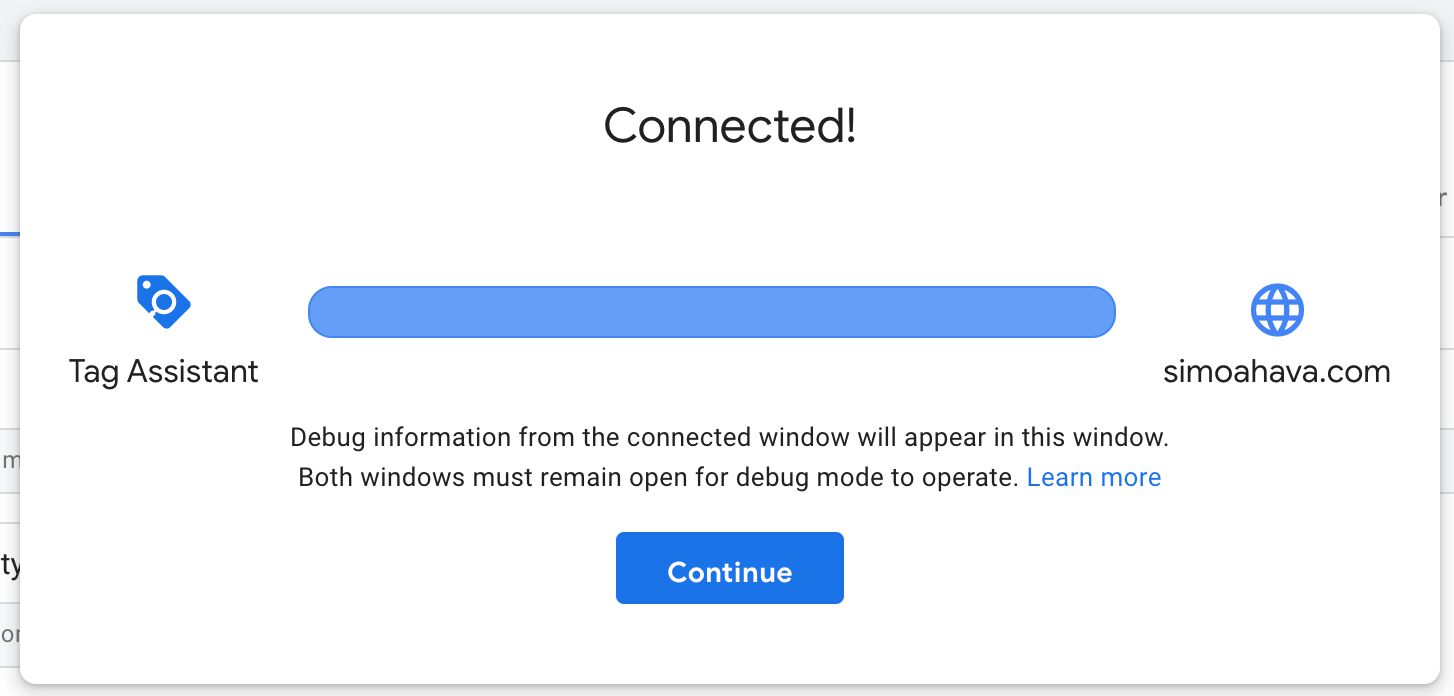
Once you click Start, Tag Assistant will first look for a tab or window that you might have previously opened from Tag Assistant and re-establish the preview channel with it. If no such tab or window is found, a new debug window is opened with the URL you configured.
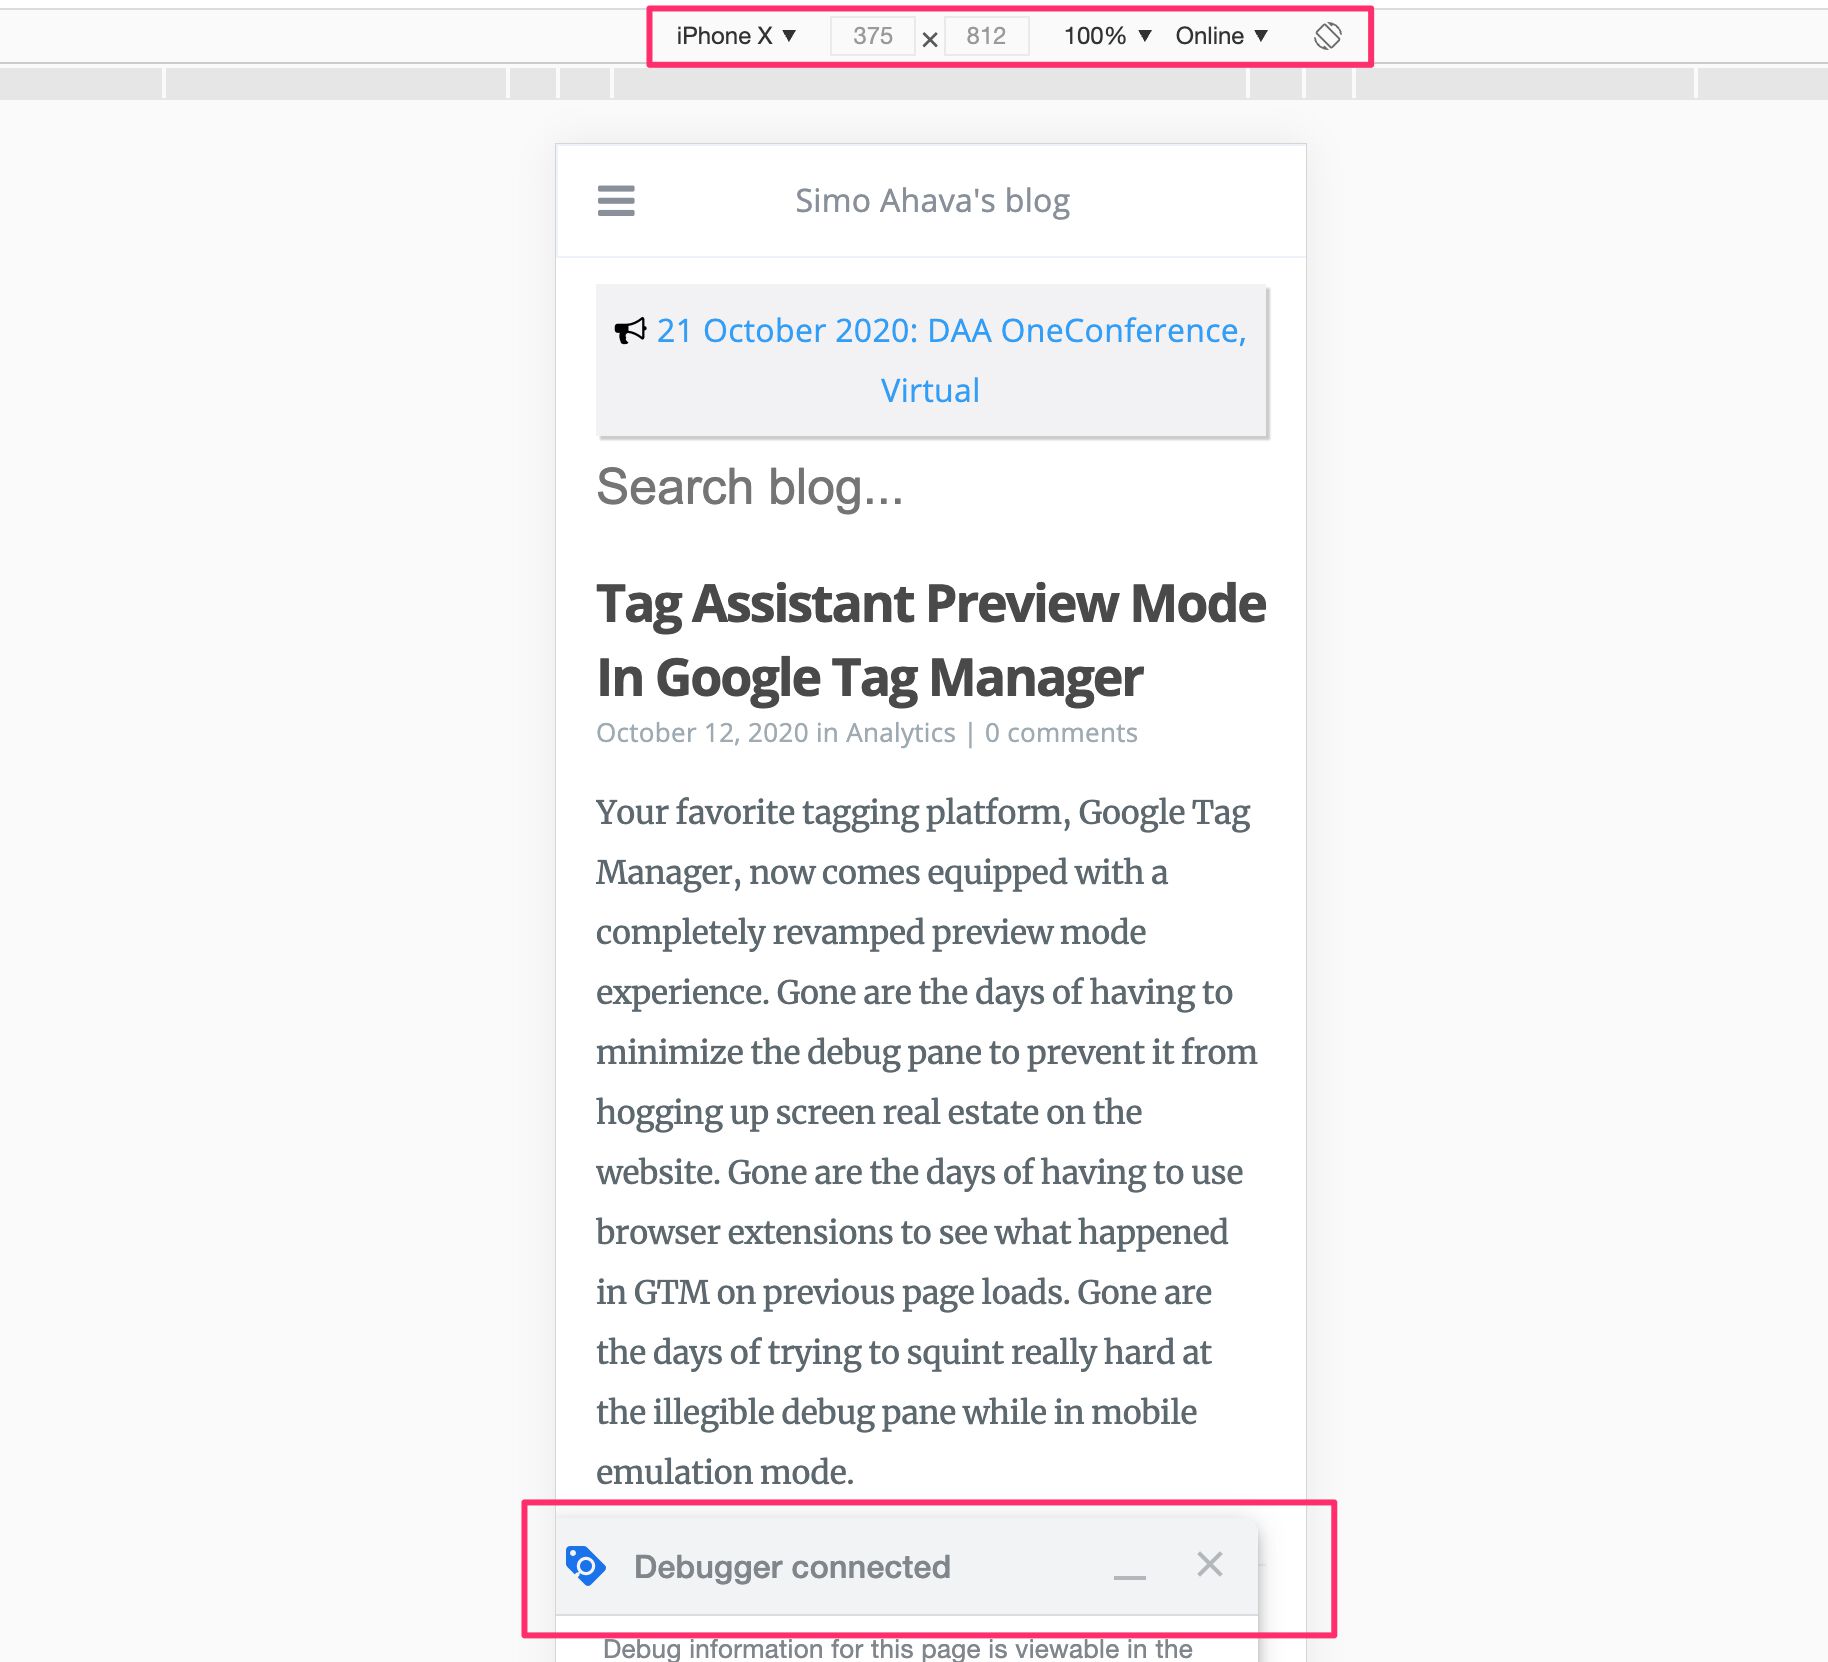
In the debug window, you should see a new preview badge appear in the lower corner of the page.
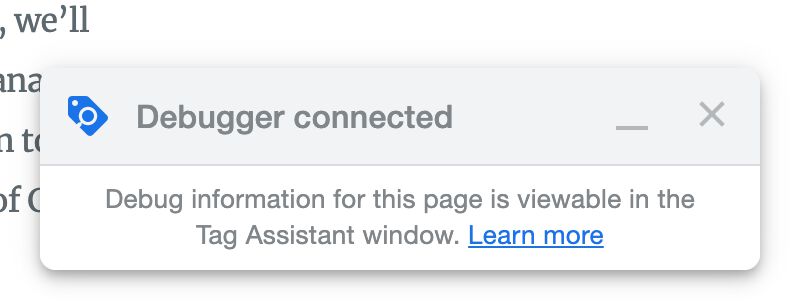
The preview badge will look for a channel with Tag Assistant, and if one is found, all Google Tag Manager and gtag.js interactions that happen in the debug window will be relayed to Tag Assistant.
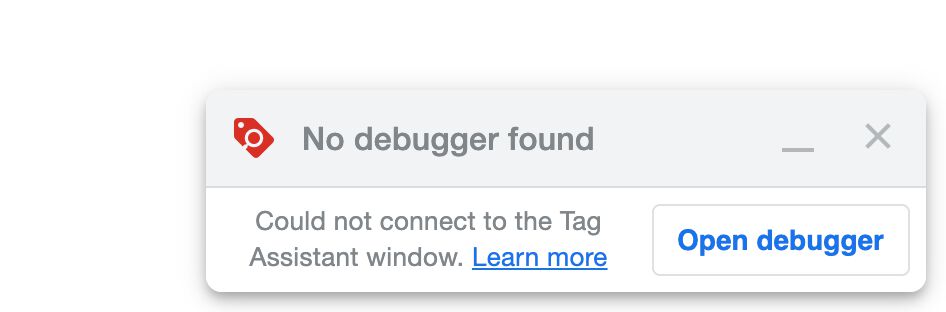
If no channel is found, the preview badge will show an error (No debugger found). You can initialize a new Tag Assistant preview process by clicking the Open debugger button in the badge.
Share preview
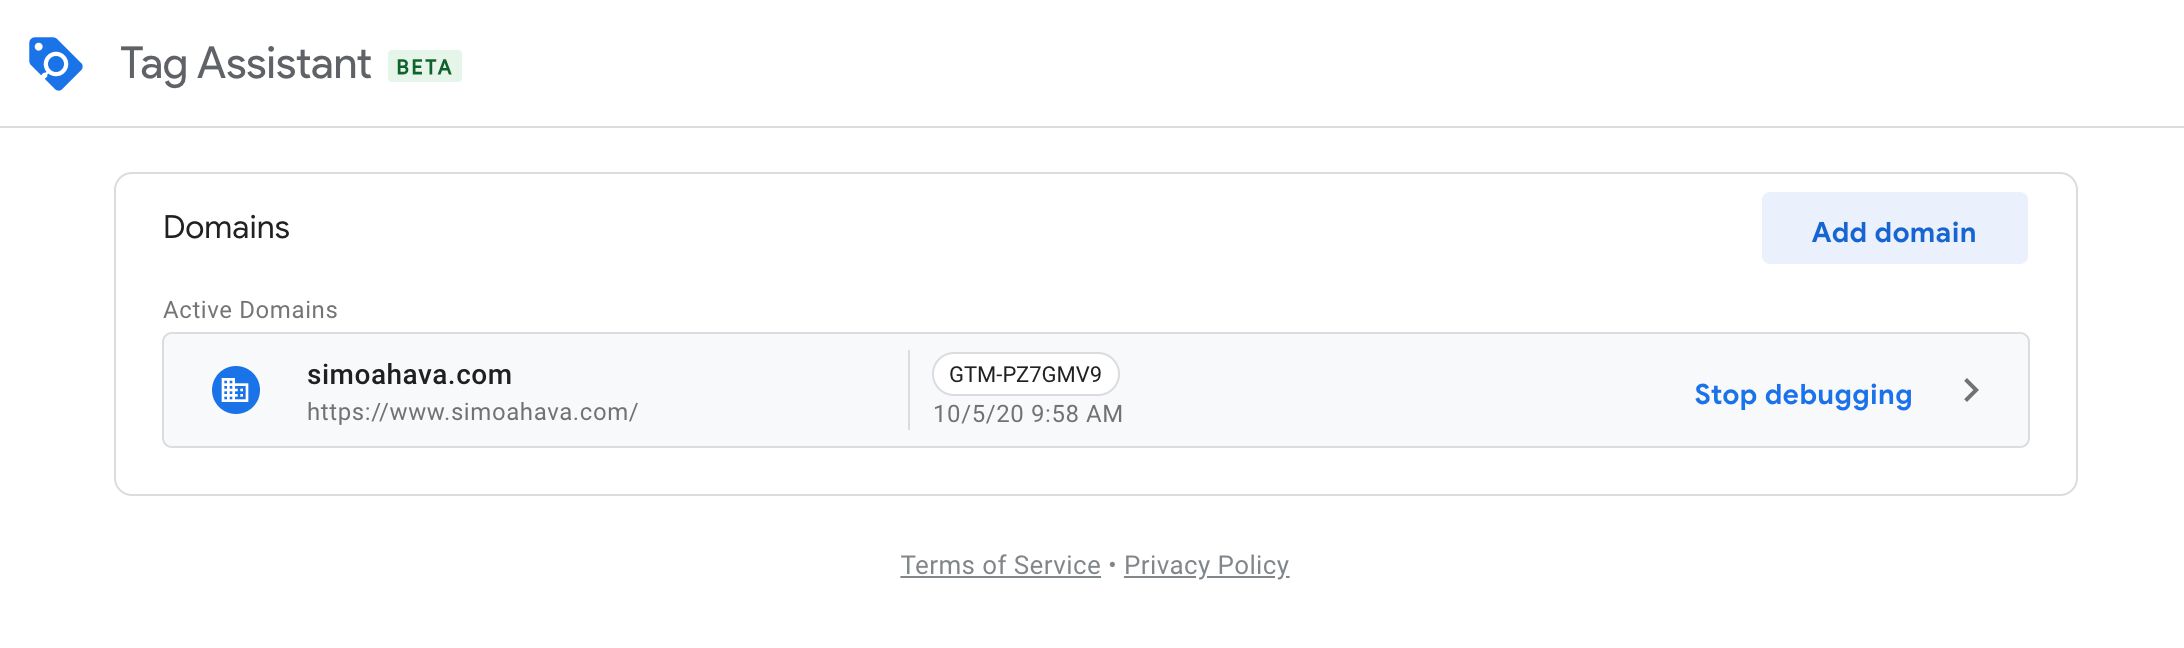
You can share a preview link from two places.
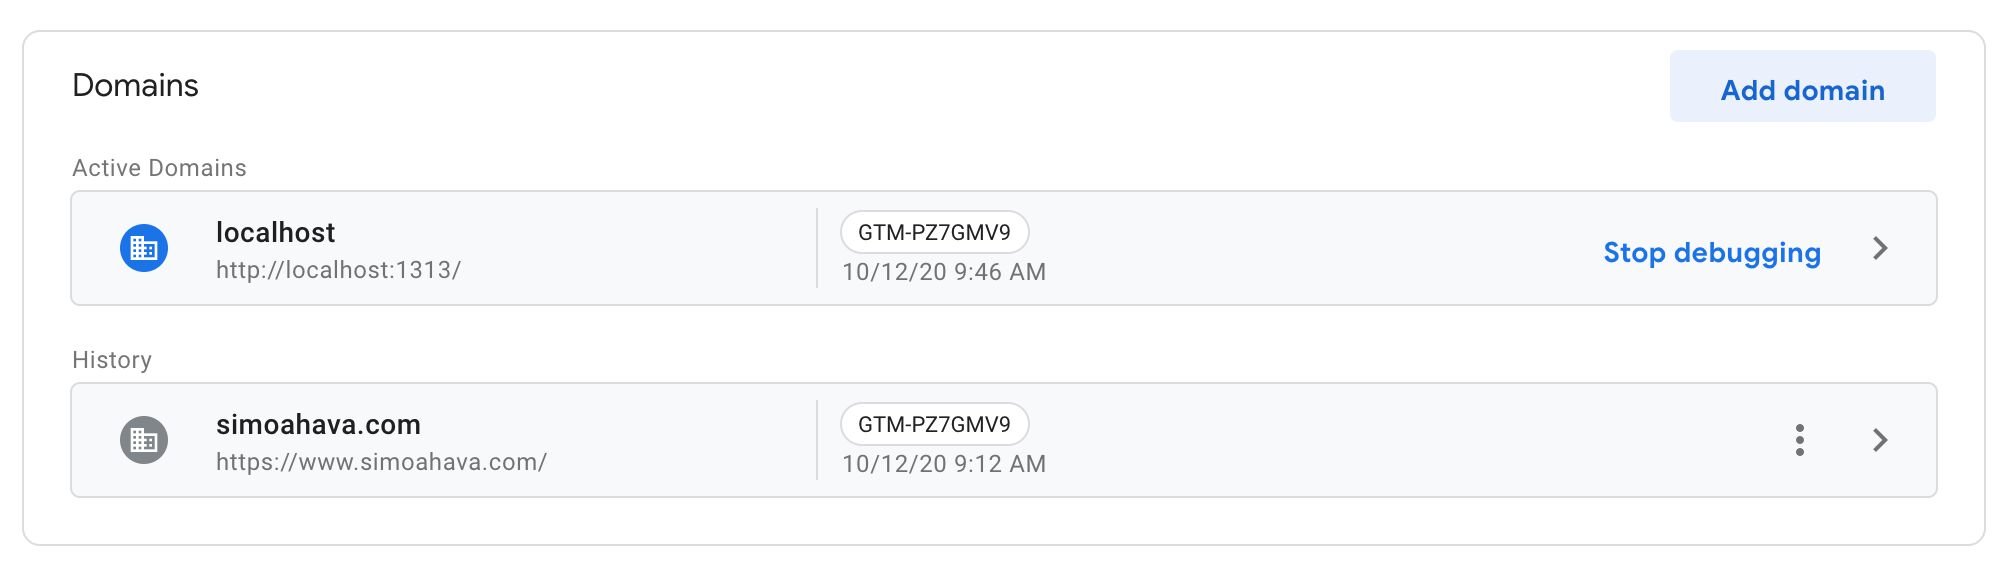
First, there’s the Tag Assistant overview where all the domains that have been enabled for debugging are listed. By clicking the action menu for a domain, you can choose the Share option to open the share modal.
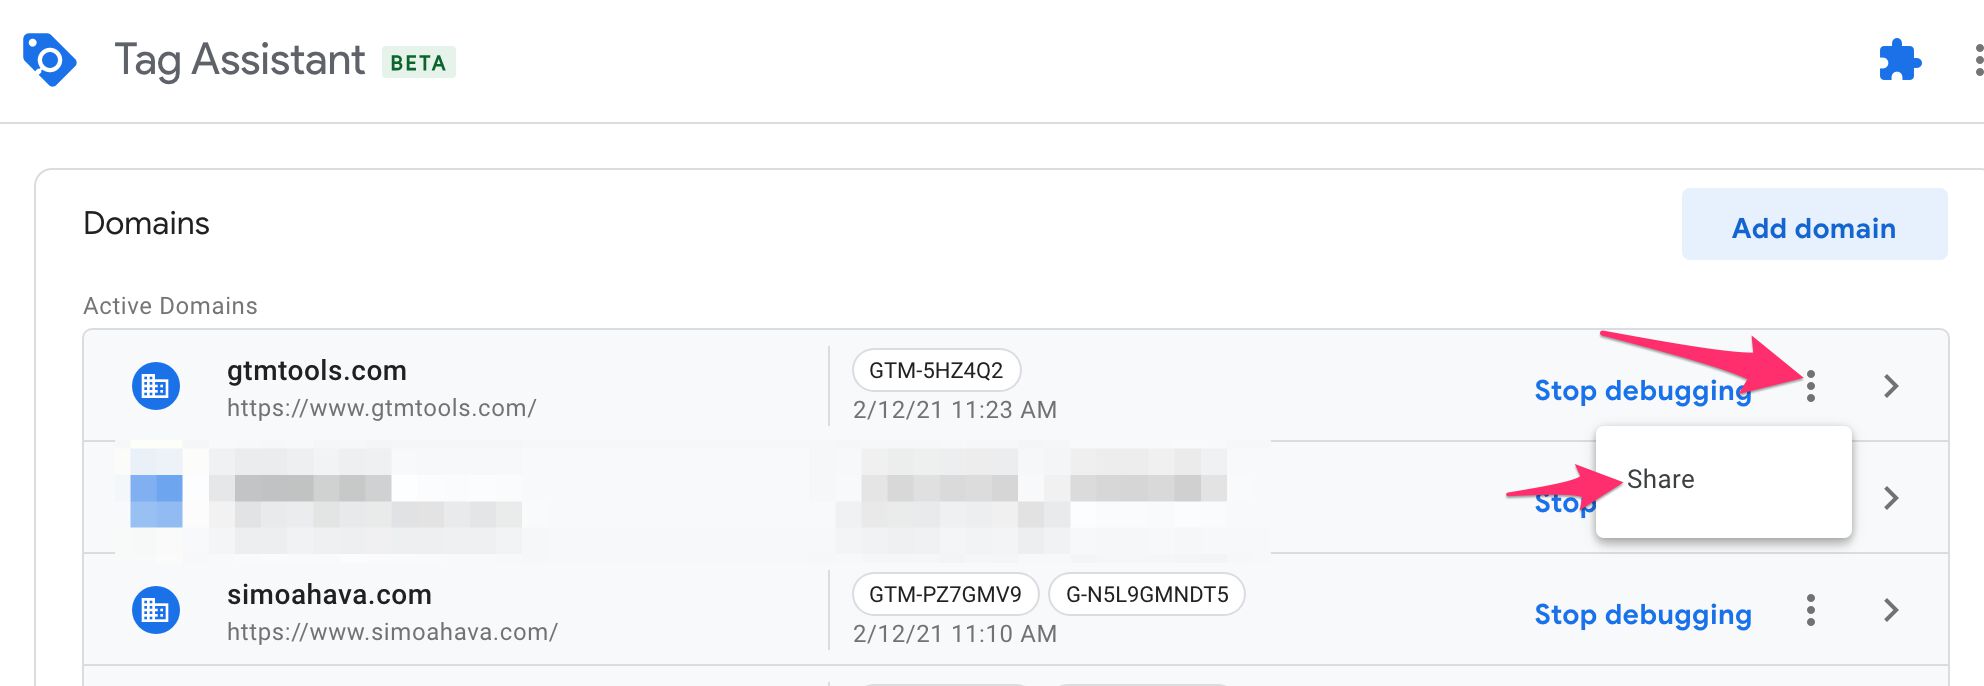
The other option is to share it directly from the Tag Assistant preview window when debugging a website. In this case, select the overflow menu in the top corner of the debug window and choose Share.
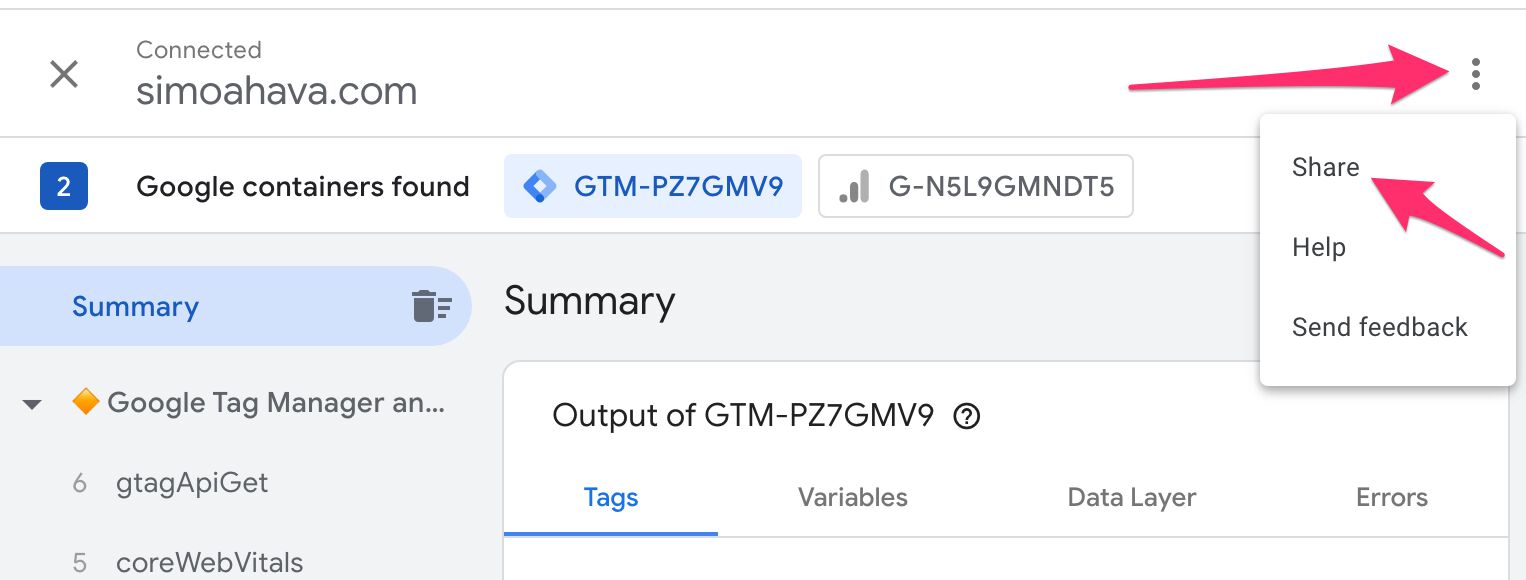
In both cases, the Share modal opens.
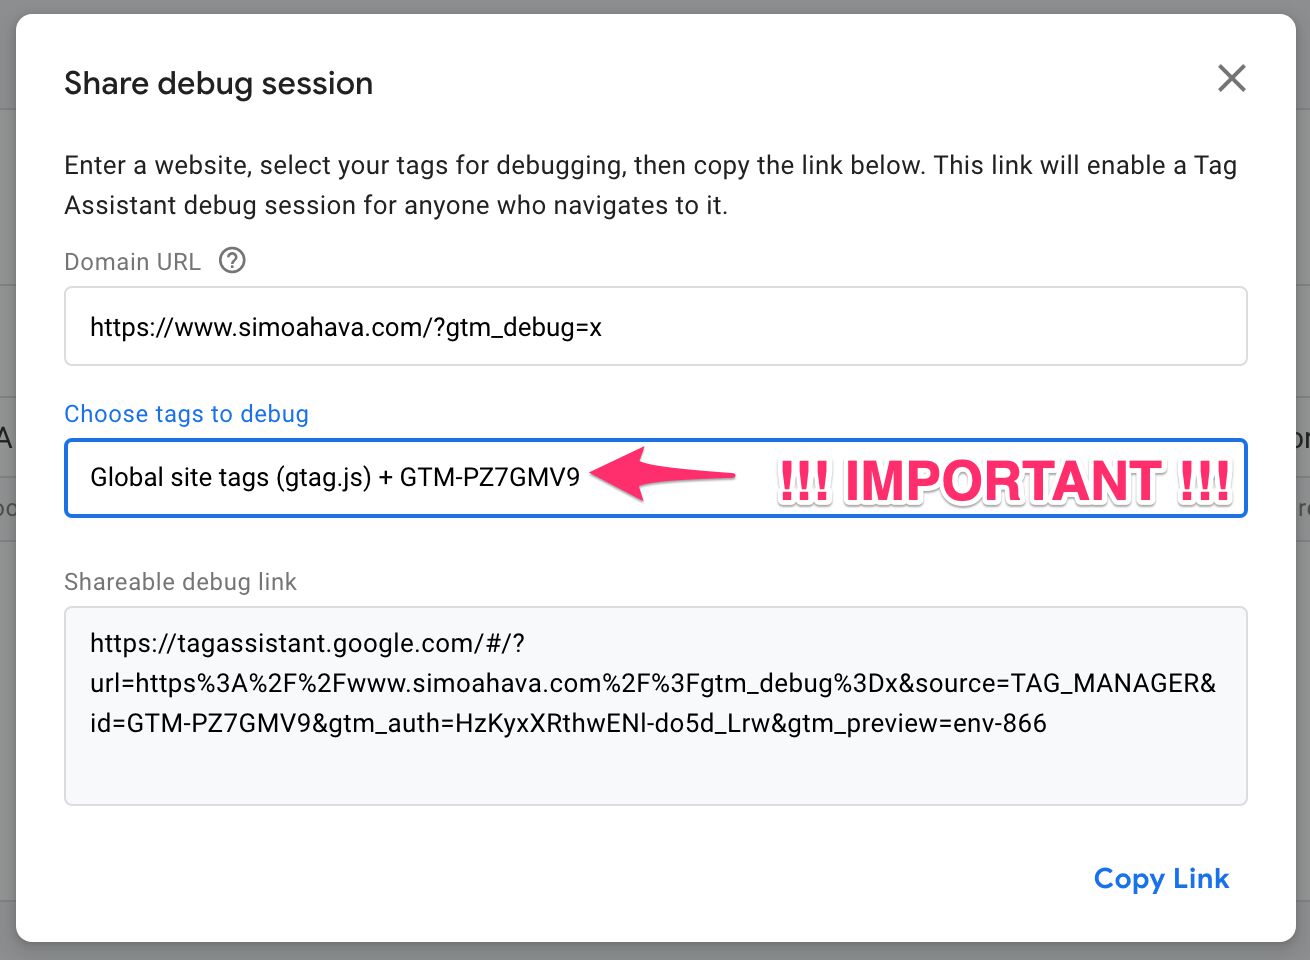
In the Share modal, you can add a URL which is then auto-filled into the preview mode settings when someone clicks the shared link.
In the Choose tags to debug option you can select either Global site tags (gtag.js) (always available), or Global site tags (gtag.js) + GTM-XXXXXX (available if you’ve enabled that container for preview in your computer).
If you want the person who receives the link to be able to debug GTM tags, triggers, and variables, you must share the latter link. Sharing only the gtag.js link will allow the user to debug outgoing hits (as this doesn’t require authentication), but they will not be able to see what happens in GTM.
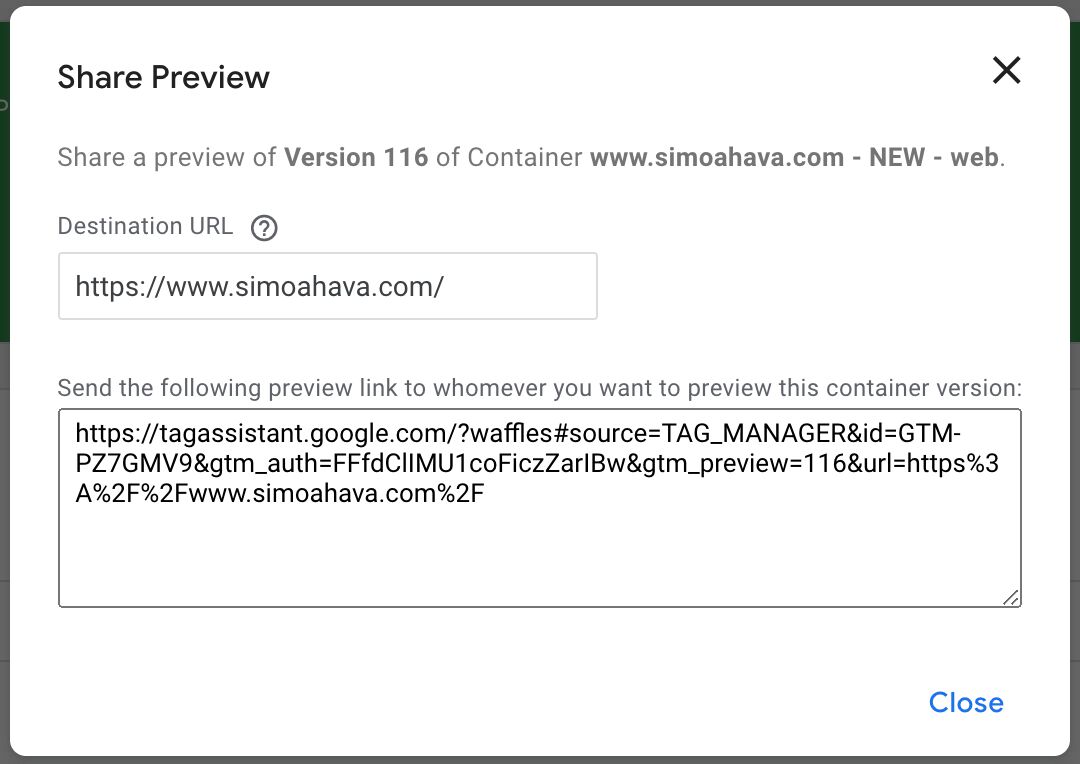
If you want to share preview for a version, you’d do exactly as you’ve done before. Go to the Versions tab in the Google Tag Manager user interface, choose the version whose preview you want to share, and then click the Share Preview link in the overflow menu.
Share this URL with someone else and they’ll be able to establish Tag Assistant’s preview mode with the version you shared.
Quit preview
If the preview connection is alive, meaning the debug window is sending data to Tag Assistant, you can quit preview mode in one of two ways:
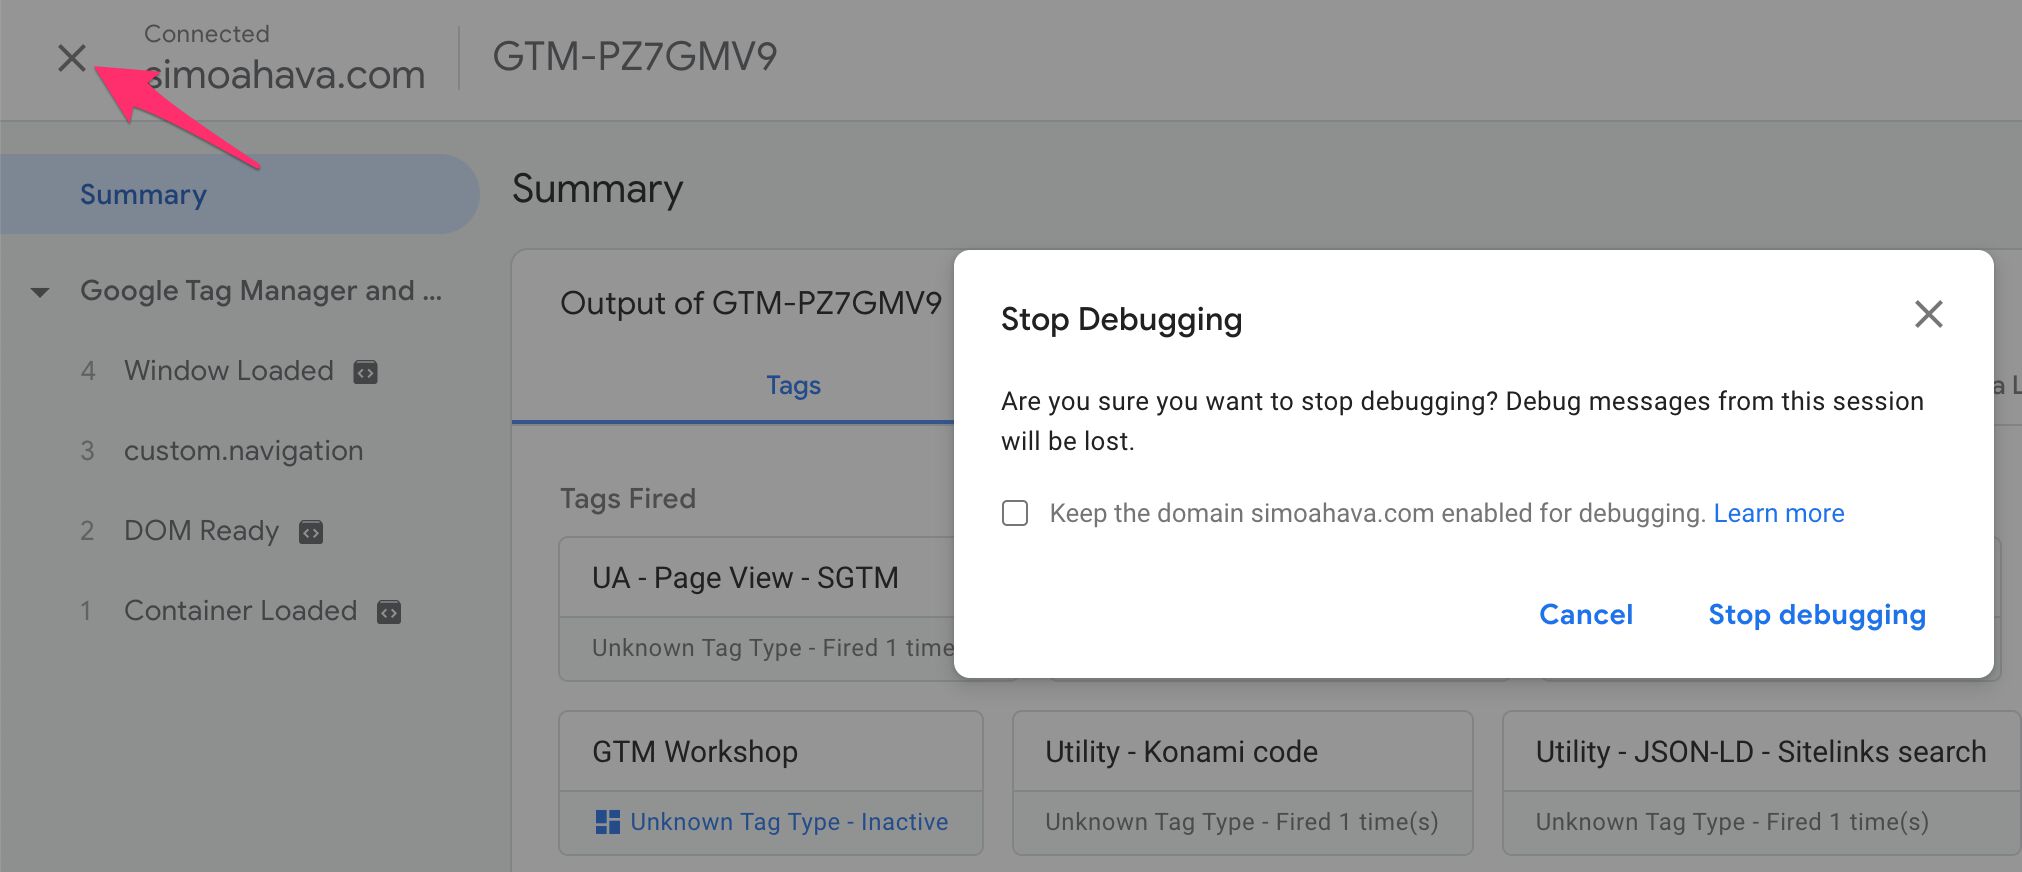
- Click the X in the top-left corner of a Tag Assistant tab.
- Close the preview badge while browsing the site in a debug window.
When you click to stop debugging via Tag Assistant, you can choose whether to keep the domain enabled for debugging or not. If you choose to not keep the domain enabled, Tag Assistant will signal the site to delete the first-party __TAG_ASSISTANT cookie and sever the connection until a new one is established via Tag Assistant.
If you do choose to keep the connection alive, it just means that the first-party cookie is not deleted. As long as you don’t close the debug window, you can always re-establish preview mode through Tag Assistant.
If you try to exit preview mode via Tag Assistant and there is no active connection with a debug window, then the first-party cookie is not deleted. In this scenario, you need to visit the site and close the preview badge to clear the first-party cookie.
Google Tag Assistant extension
There’s an issue with some browsers (e.g. Chrome) that requires Tag Assistant to open the debug window in a new browser window rather than a browser tab.
Specifically, if the user types something into the URL bar of the debug window, the window.postMessage channel is severed, and debugging will no longer work even if the user returns to the site being debugged.
For this reason, Tag Assistant opens the debug site in a browser window, as the pop-up allows it to make the URL bar inaccessible. The other benefit of having a dedicated browser window is that you have a dedicated browser window just for debugging a site. This makes it less likely that you’ll unintentionally sever the connection.
While this makes debugging simple, it might not be the preferred flow for some users. For instance, it’s not possible to do (Google Chrome) mobile emulation in a browser window like this, and utilizing developer tools can be a bit annoying as they are opened in yet another window by default.
Luckily, if you use the Google Tag Assistant browser extension, this limitation is lifted.
Using the Tag Assistant extension is not required but is recommended.
If the browser has the extension, Tag Assistant will detect it and automatically use it to enhance the preview experience. The following features are enabled as a result.
- You can debug multiple windows in a single Tag Assistant instance.
- You can debug content in iframes.
- You can open debug windows in tabs instead of pop-up windows.
The Tag Assistant extension integration works automatically. As long as you have Tag Assistant enabled in your browser, the preview interface will make note of this and apply the enhancements automatically.
The most significant enhancement is, of course, that the debug window is opened in a browser tab rather than a window itself.
Running in a browser tab also enables debugging via mobile emulation.
None of these enhancements really degrades the experience at all (I wouldn’t call them enhancements if they did), so using the Tag Assistant extension when working with the new preview experience is practically mandatory, in my opinion.
gtag.js integration
Tag Assistant can automatically debug all the hits collected with the Global Site Tag.
In this case, the Preview interface simply shows the gtag() API calls and all the hits dispatched by gtag.js. Because of this, you can use the Tag Assistant debugger for gtag.js hits without having to authenticate or anything.
For example, a simple way to initiate a new Tag Assistant preview channel for a site running gtag.js is to load a page on the site with gtm_debug=x in the URL. This pops up the preview badge, where you can then click Open debugger to start a new preview instance.
After adding the site to the list of domains to debug, a new browser tab is opened with the debug window, and you can proceed to use Tag Assistant to debug all the gtag() API calls and hits that happen in the debug window.
API calls made with gtag() appear in the list of messages, and you can see what was actually called by expanding the API call itself.
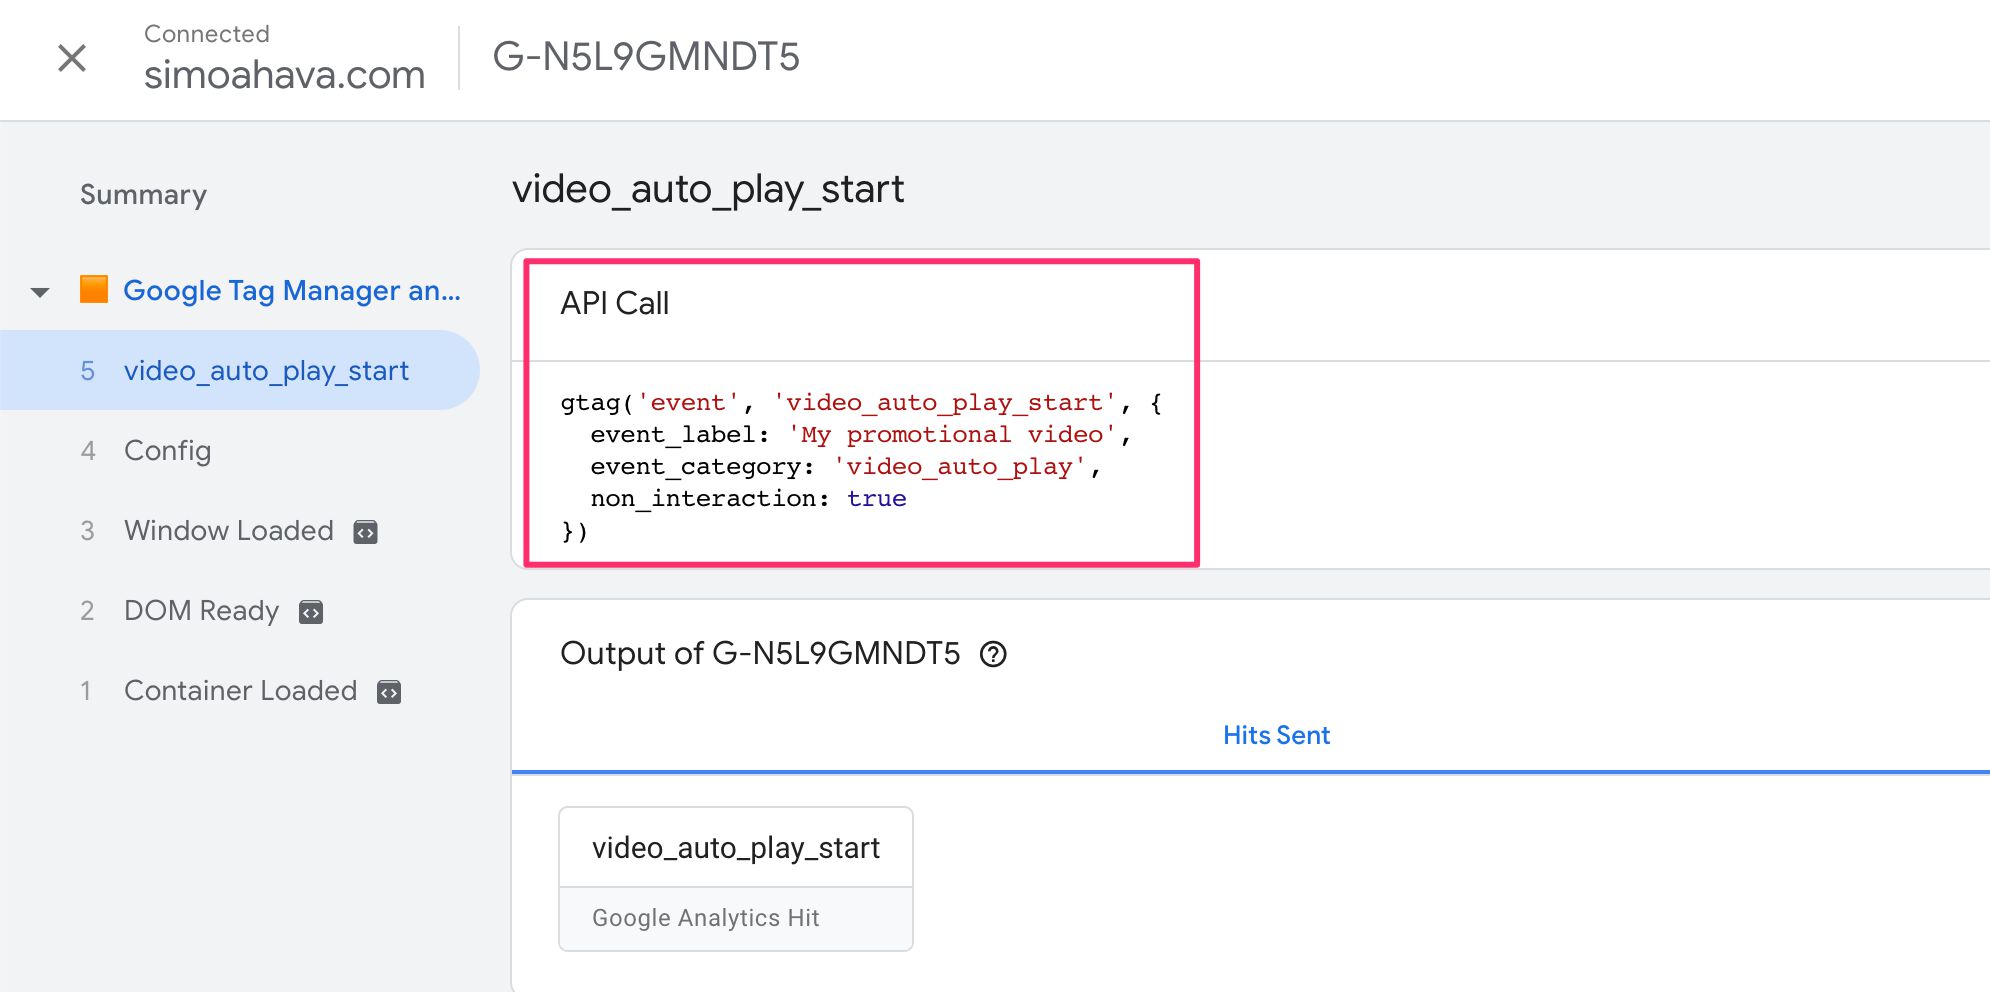
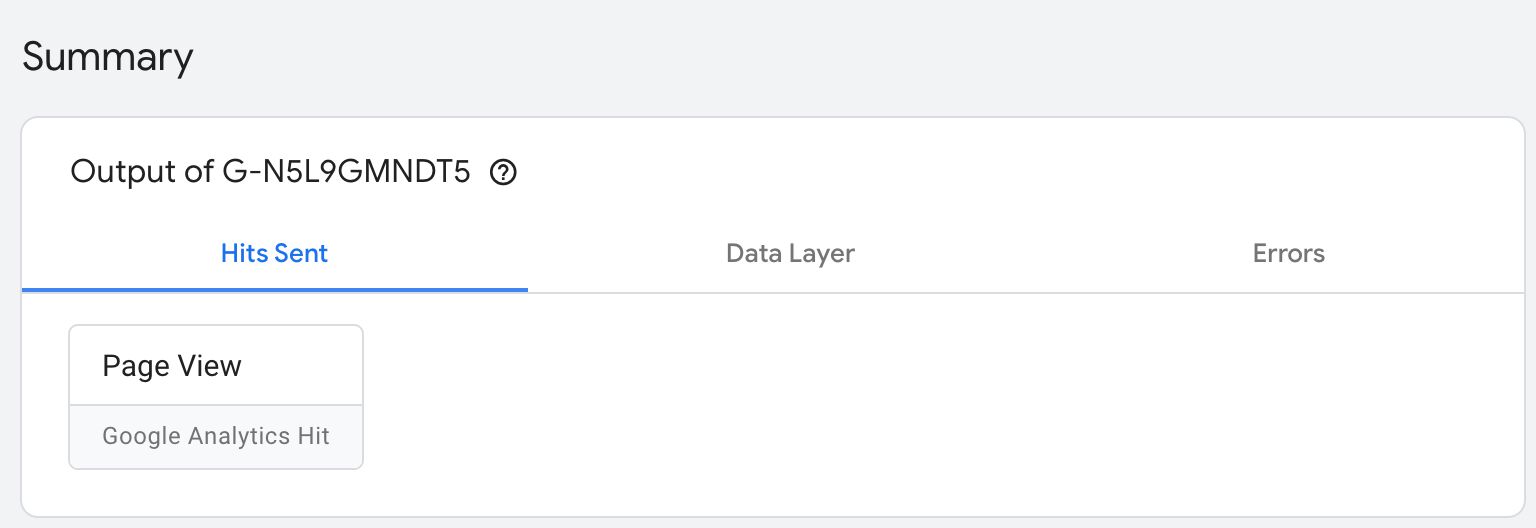
The Hits sent will display all the calls to Google servers that were initiated with these API calls. You can see the list of parameters and values (in human-readable format) by clicking one the sent hits.
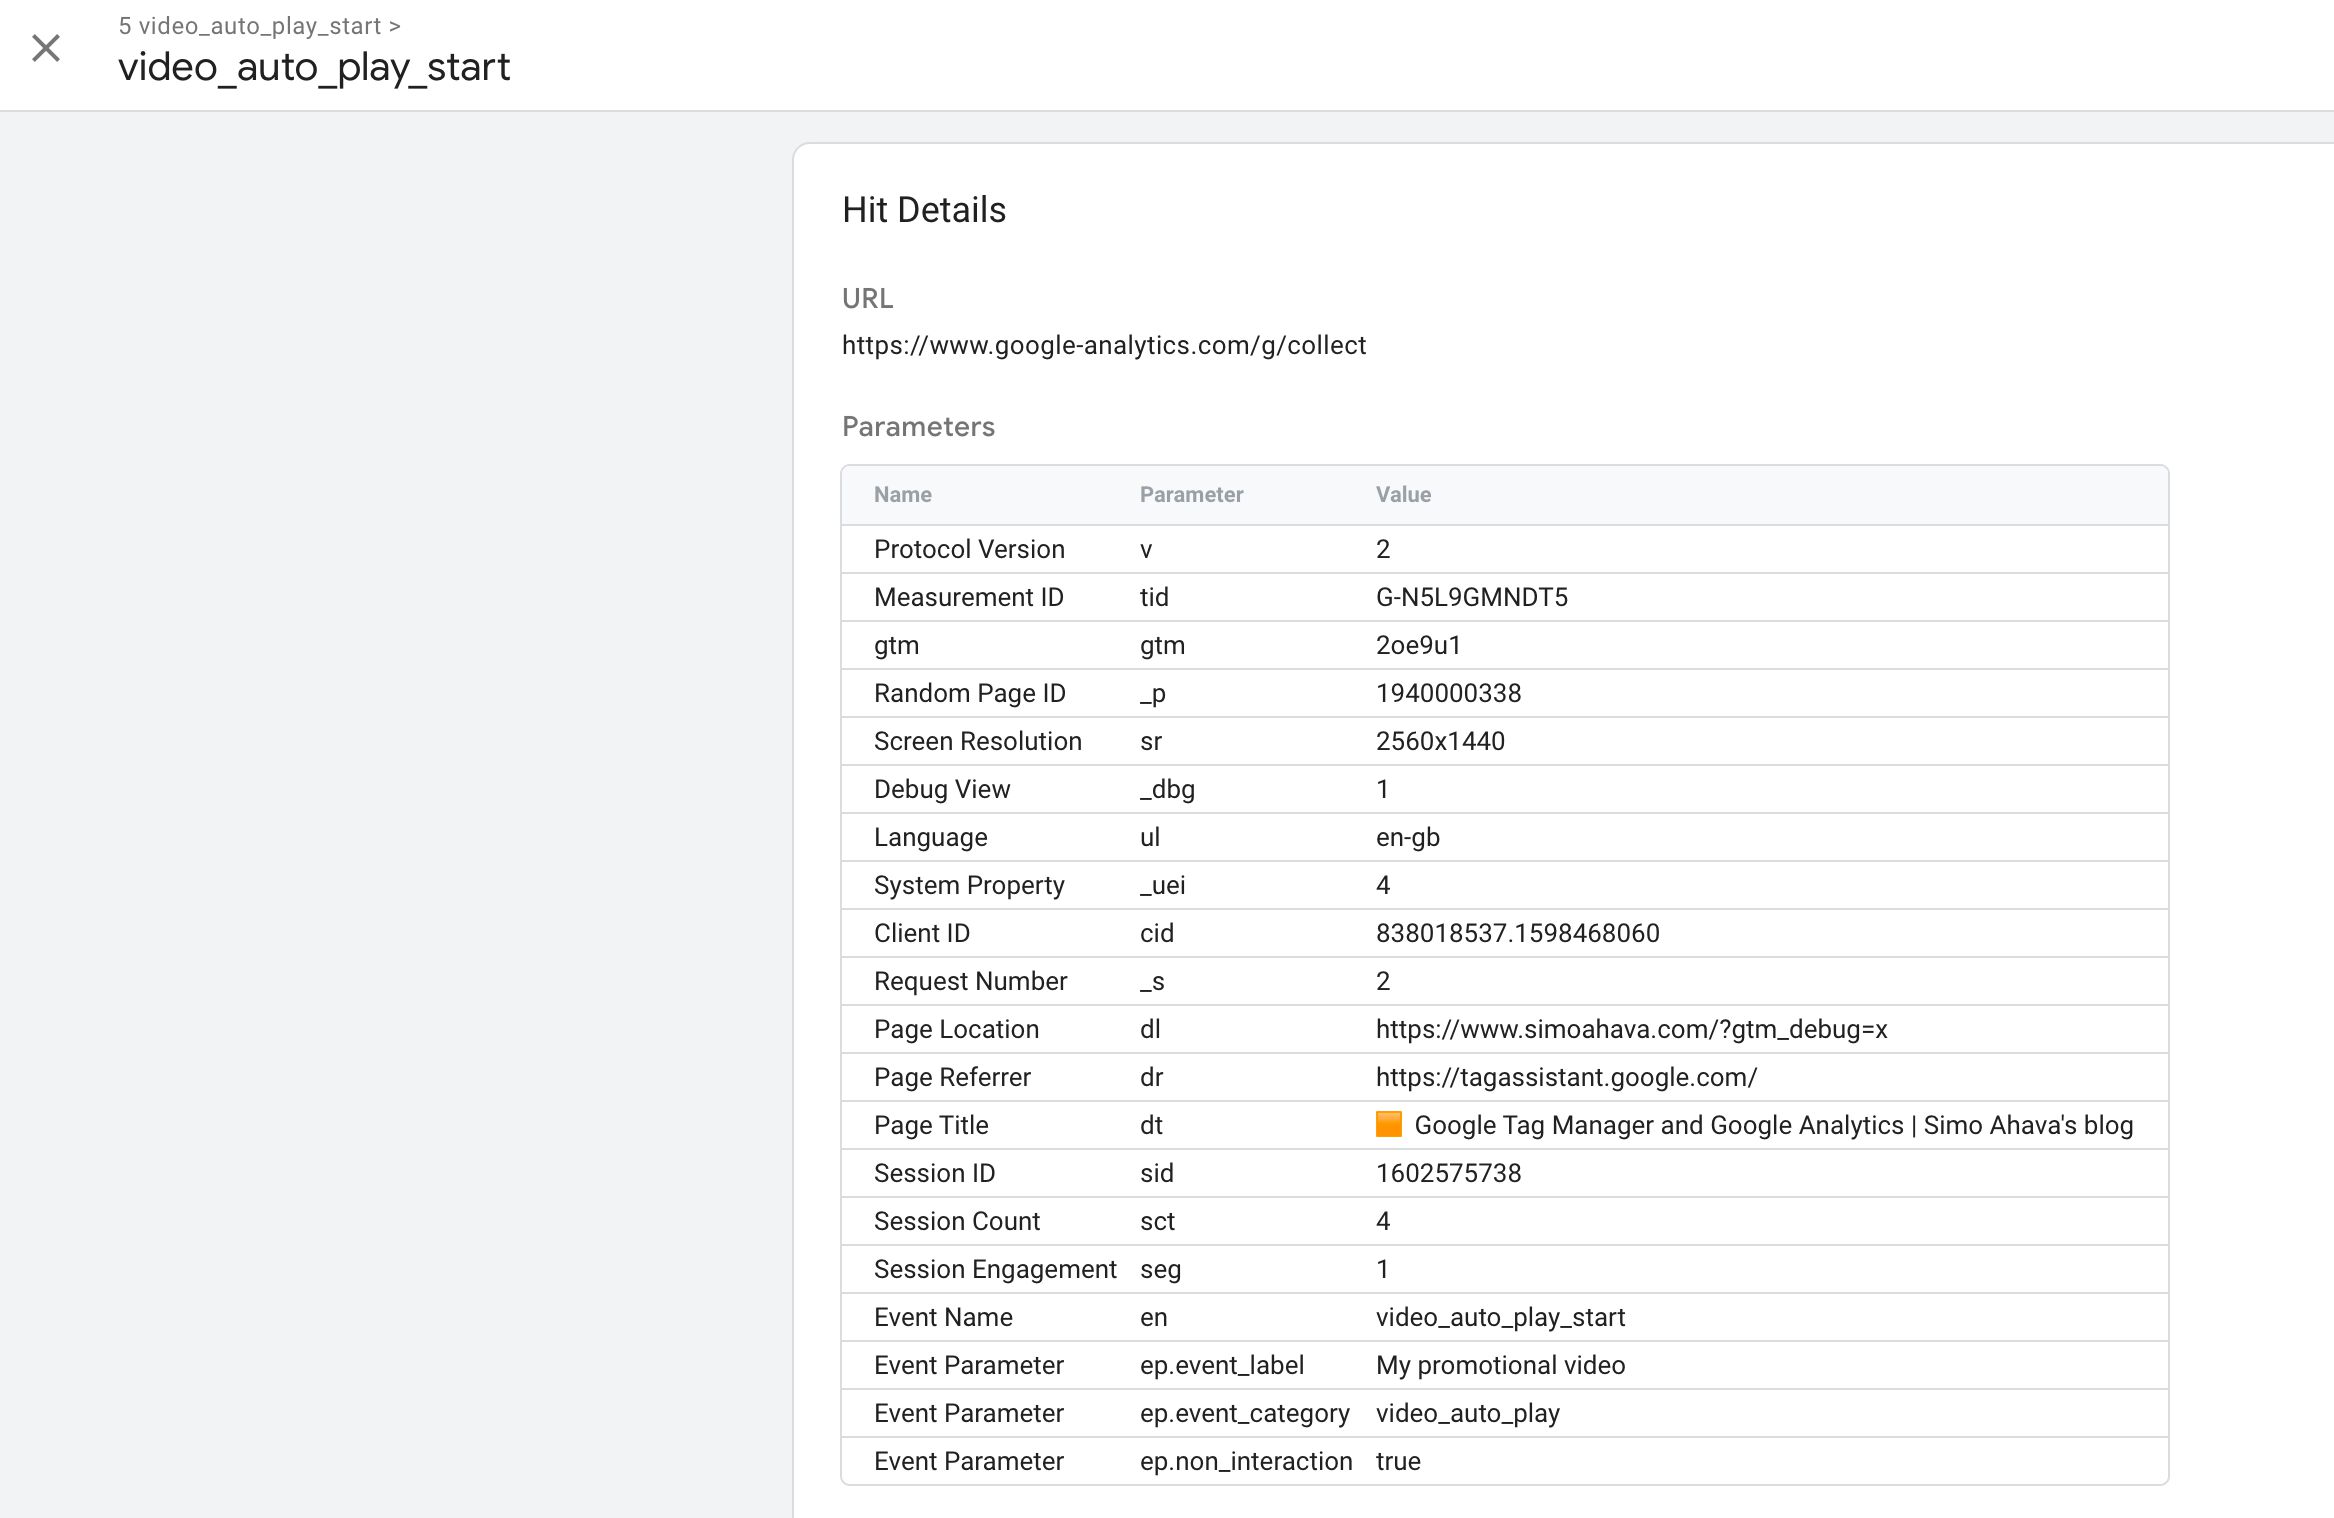
This is very interesting, as you can now use Tag Assistant’s preview interface for debugging sites for where you don’t actually have access to Google’s tools. In this way, the Tag Assistant interface is acting more like your typical developer tools, except it can show you more details about the hits in human-readable format than what you’d get by just looking at the network requests.
It’s a nice enhancement to have, and being able to quickly switch between debugging a Google Tag Manager container vs. the gtag.js implementation is very useful, indeed.
Technical details
For Tag Assistant to be able to preview a Google Tag Manager container, a version has to be published first. It’s no longer to possible to preview a container that doesn’t have a published version.
When the site loads a container that is in preview mode, it first loads the container itself (this is why it requires a published version), after which the browser loads a special debug version of the container:
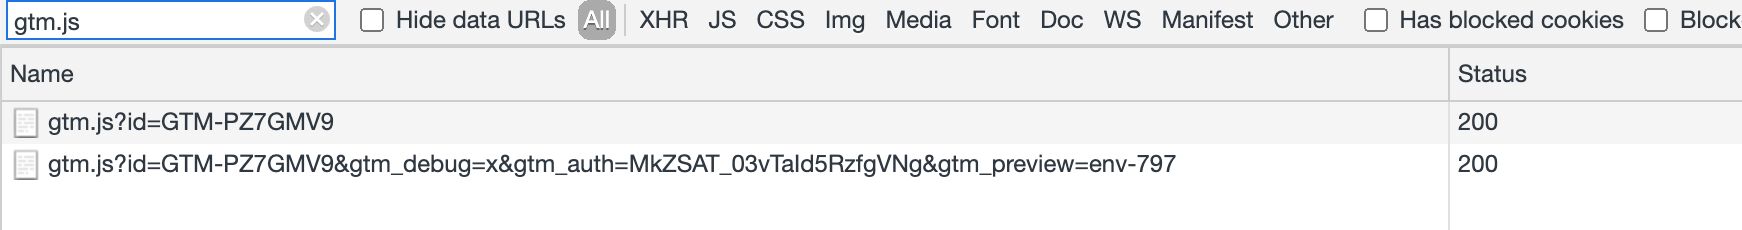
To determine if a window should be in debug mode, Tag Assistant uses one or more of three signals to establish whether or not a debug window should be enabled for previewing:
- The
gtm_debug=xparameter is in the page URL (controlled by the Include debug signal in the URL checkbox). - The referrer is
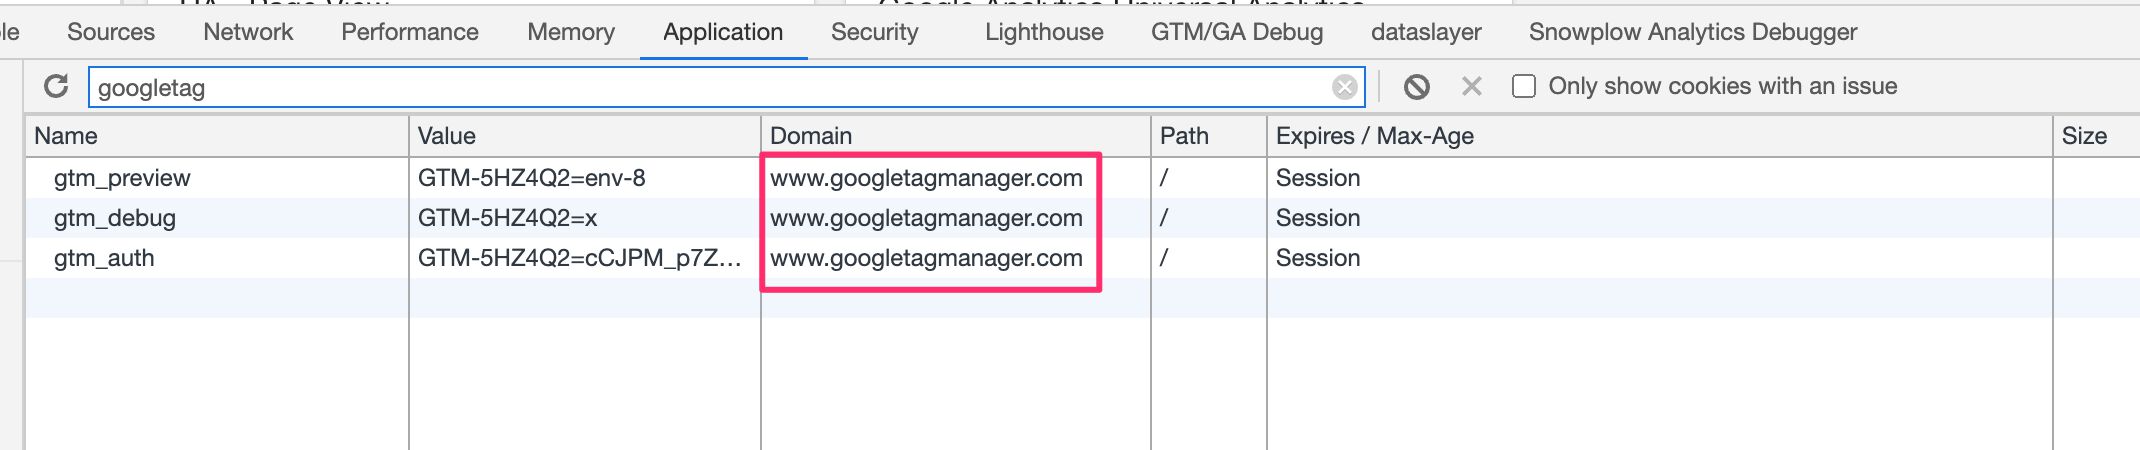
https://tagassistant.google.com. - A first-party cookie (
__TAG_ASSISTANT) is set on the domain being previewed.
(1) and (2) will cause the __TAG_ASSISTANT first-party cookie to be written on the site. All three will result in the preview badge appearing in the corner of the page.
Remember to add
tagassistant.google.comto your Google Analytics referral exclusion list to avoid preview mode starting a new session.
When the badge is displayed, the page will look for an open channel to a Tag Assistant preview interface. As long as the site has the first-party cookie, the badge will display and actively search for and interact with a Tag Assistant interface.
Moving to first-party storage is a huge benefit in today’s third-party-cookie-blocking browser world.
With GTM’s old preview mode, state was maintained with a third-party cookie, which meant that the user had to implement awkward and time-consuming hacks to make preview mode work properly on Safari and even on Google Chrome’s Incognito mode.
With the new Tag Assistant, state is no longer managed with third-party storage. Instead, Tag Assistant now utilizes two components to make the transmission of information from the debug window to Tag Assistant work:
- A first-party cookie named
__TAG_ASSISTANTtells the Google Tag Manager and gtag.js libraries to actively look for an open channel to Tag Assistant. - If a channel is found or established, information is transmitted with
window.postMessage.
Tag Assistant itself maintains the list of domains available for debugging with
window.localStorage.
The window.postMessage channel is created when the person doing the previewing clicks to connect a window to Tag Assistant:
In other words - for Tag Assistant to be able to listen for events from a debug window, that debug window needs to have been opened via the Tag Assistant interface.
If you try to open a browser tab for a page that has the __TAG_ASSISTANT cookie but has not been opened via Tag Assistant, you’ll see the page search for an open preview mode channel, only to report that no such channel was found.
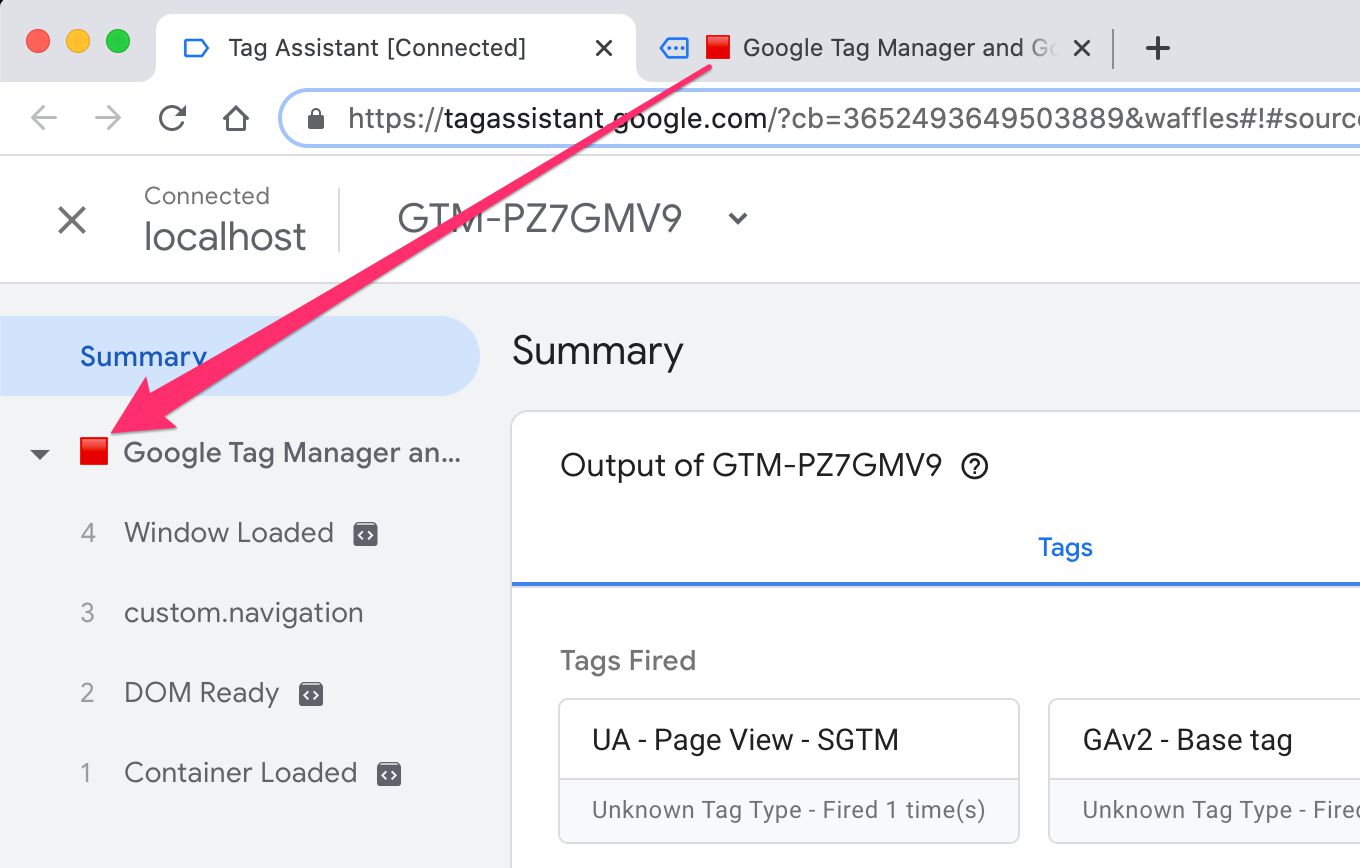
If Tag Assistant is connected to a window or tab, you’ll see the tab icon reflect this. The Tag Assistant tab will show a pulsating tag icon pointing to the right. If you’ve also got a debug window running in a tab, this tab will show a tag icon pointing to the left, together with a color indicator that is used to identify the hits from this debug window in Tag Assistant.
It’s a lot to digest, but the important part to understand is that everything works with first-party storage now. This makes previewing far more reliable than before.
The other thing to remember is that a window can only be debugged if it was initially opened via Tag Assistant. So if you find Tag Assistant not working or the preview badge in the debug window not finding a connection, you’ll need to go back to Tag Assistant and connect a new debug window.
Things to look forward to
This is a fairly large feature update to Google Tag Manager, and it will take some time for the dust to settle.
As everything runs in Tag Assistant now, there are some interesting possibilities ahead.
It would be great to see end-to-end debugging with Tag Assistant, where the Google Analytics integration could be included in the debug process. That way you could see the full funnel of data from a
dataLayer.push(orgtag()call) all the way to the data being processed in Universal Analytics or Google Analytics 4.Similar to server-side tagging, being able to see the outgoing request summaries in Tag Assistant would be nice. Now we need to use developer tools or browser extensions to achieve the same.
This might sound blasphemous, but it wouldn’t hurt to still have access to the old debug pane. Don’t get me wrong - having the debugger in its own window is an excellent evolution, but there might be times where I want to have everything tucked neatly on the page I’m debugging, rather than having to shuffle between two different windows (multi-screen office setups win here big time).
There are lots of possibilities here. I suspect most of the feature releases in the near future will revolve around making Tag Assistant a more unified experience across all Google products.
Summary
The renewed preview experience in Google Tag Manager is a lot to digest. The docked preview mode has been a staple of Google Tag Manager, for good and bad, so this is in many ways a very turbulent evolution.
Just imagine all the screenshots that bloggers and course instructors need to redo because of this!
In my book, this is a very welcome change. Being able to separate the debugger from the … debuggee … has to be one of the most requested features for Google Tag Manager.
The integration with the Tag Assistant extension is also an excellent idea, although I’m a bit worried a lot of the best features will be hidden behind this dependency. Even though it’s optional, the ability to debug multiple windows, to open the debugger in a tab rather than a window, and to easily use the debugger in mobile emulation mode render the extension practically mandatory.
I’m particularly enamored with the move away from third-party cookies to first-party storage. Not only does this make debugging more robust across modern browsers, it also makes it more resilient against browser extensions that specifically target third-party cookies.
I can’t wait to see what the next iterations of the revamped Tag Assistant preview experience introduce in their wake!
What do you think about this change? What would you like to see in future versions of Tag Assistant?