READ THIS (26 Aug 2019)!! Unfortunately, the update I made in 2016 contained code that was incomplete and broken. I nevert noticed this until it was pointed out to me almost three years later. At this point, I don’t have a working backup of the solution, so unless some internet archive / cache service manages to surface the code, this article is basically lost.
UPDATE 20 December 2016: I made some fixes to the solution - be sure to grab the latest code snippet from below!
Having worked in all sorts of Google Analytics projects over the years, I’ve found myself more and more interested in the technical underpinnings of digital analytics rather than the actual analytical work. We all play to our respective strengths, I guess. For example, there are still many purely technical / technological mysteries surrounding Google Analytics, because much of the data processing is done server-side.
One of these mysteries is a proper feedback loop for request quality. When you send a request to Google Analytics such as a Page View hit, you can verify that it works in multiple ways:
Google Tag Manager Debug mode
Google Analytics Real Time reports
Google Tag Assistant recordings
Web browser’s own developer tools
I’ve covered much of Google Analytics debugging in this article.
However, no matter how successful your own tests are, one thing is missing: a solid, reliable way of collecting data from all failed requests from your site visitors. Google Analytics doesn’t automatically log problems with data collection, even if Analytics notifications do reveal some issues.
This can, and should, lead to healthy doubt concerning the veracity of your data set - is it a representative sample of all hits sent from your digital property, or is some business critical information (such as Ecommerce) being dropped more than average?
In this article, I want to show a simple way of logging all failed requests in Google Analytics as new events. The solution builds on Stephen Harris’ awesome GA Spy, and the technical approach is encapsulated in a single Custom HTML Tag in Google Tag Manager.
Read on, my friend!
The Simmer Newsletter
Follow this link to subscribe to the Simmer Newsletter! Stay up-to-date with the latest content from Simo Ahava and the Simmer online course platform.
The solution
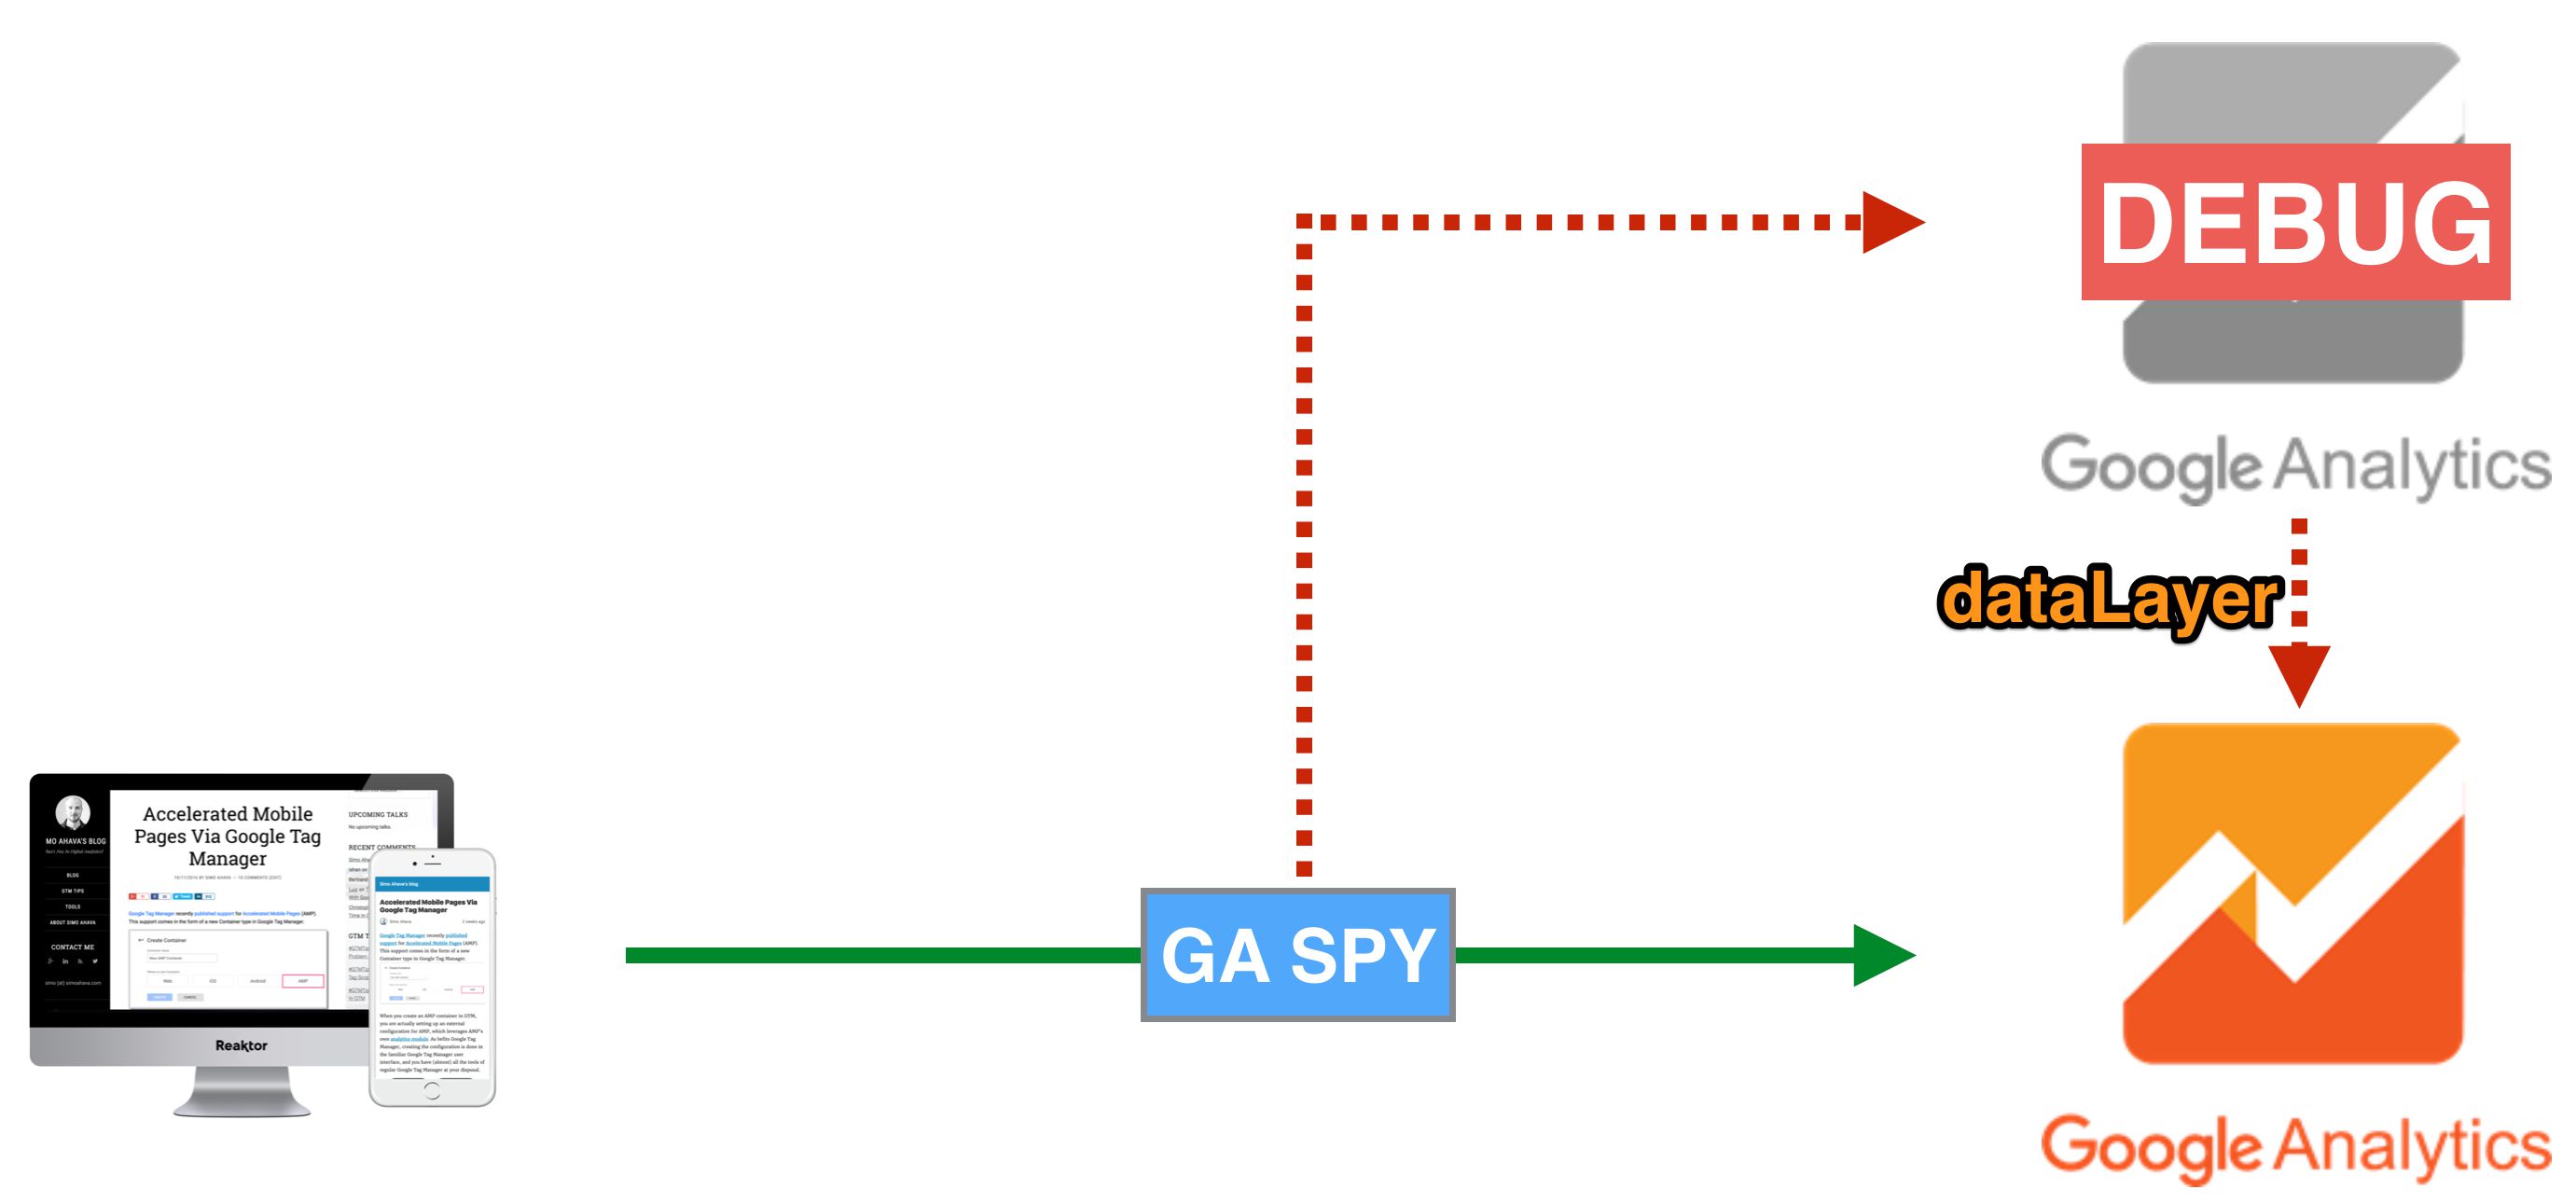
Here’s how it works.
GA Spy to processes every single call to the
ga()global function.For each call with the
sendcommand, send the hit payload tohttps://www.google-analytics.com/debug/collect(read more about the/debug/endpoint).Don’t forget to send the regular hit to Google Analytics.
If the
/debug/returns a failed request, push the error message and the failed hit payload intodataLayer.
In a nutshell, for every hit sent to Google Analytics, you’re also sending the same hit to the GA debug endpoint. This endpoint returns information on whether or not the request was a success, and if it wasn’t, what was wrong with it.
{
"hitParsingResult": [ {
"valid": false,
"parserMessage": [ {
"messageType": "WARN",
"description": "The value provided for parameter 'ev' is invalid. Please see http://goo.gl/a8d4RP#ev for details.",
"messageCode": "VALUE_INVALID",
"parameter": "ev"
} ],
"hit": "..."
} ],
"parserMessage": [ {
"messageType": "INFO",
"description": "Found 1 hit in the request."
} ]
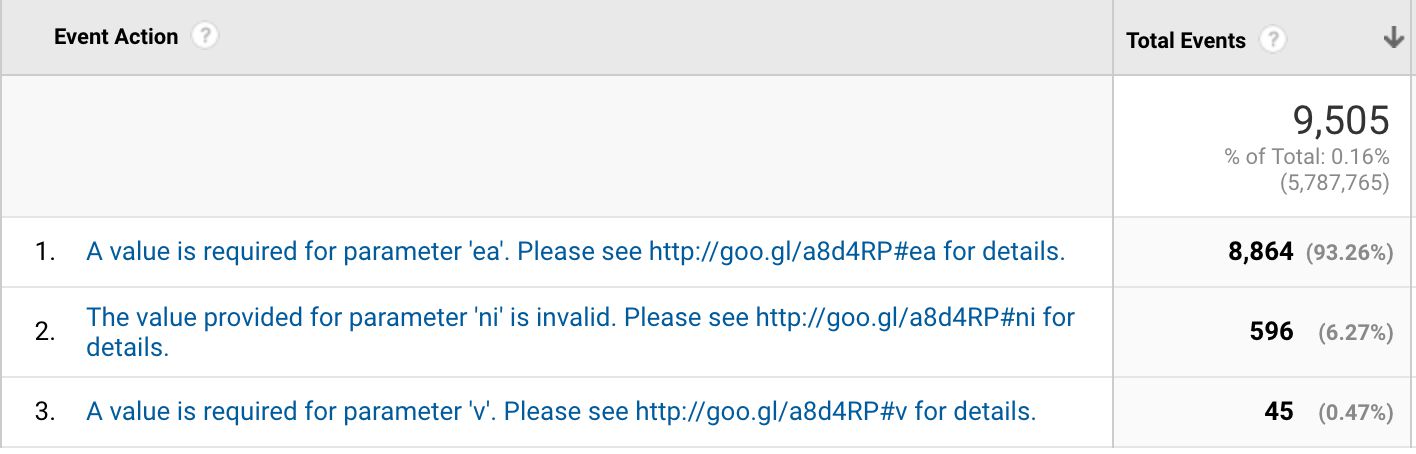
}From dataLayer, I’m actually sending this information to Google Analytics via GTM. This way you’ll end up with a report that looks like this:
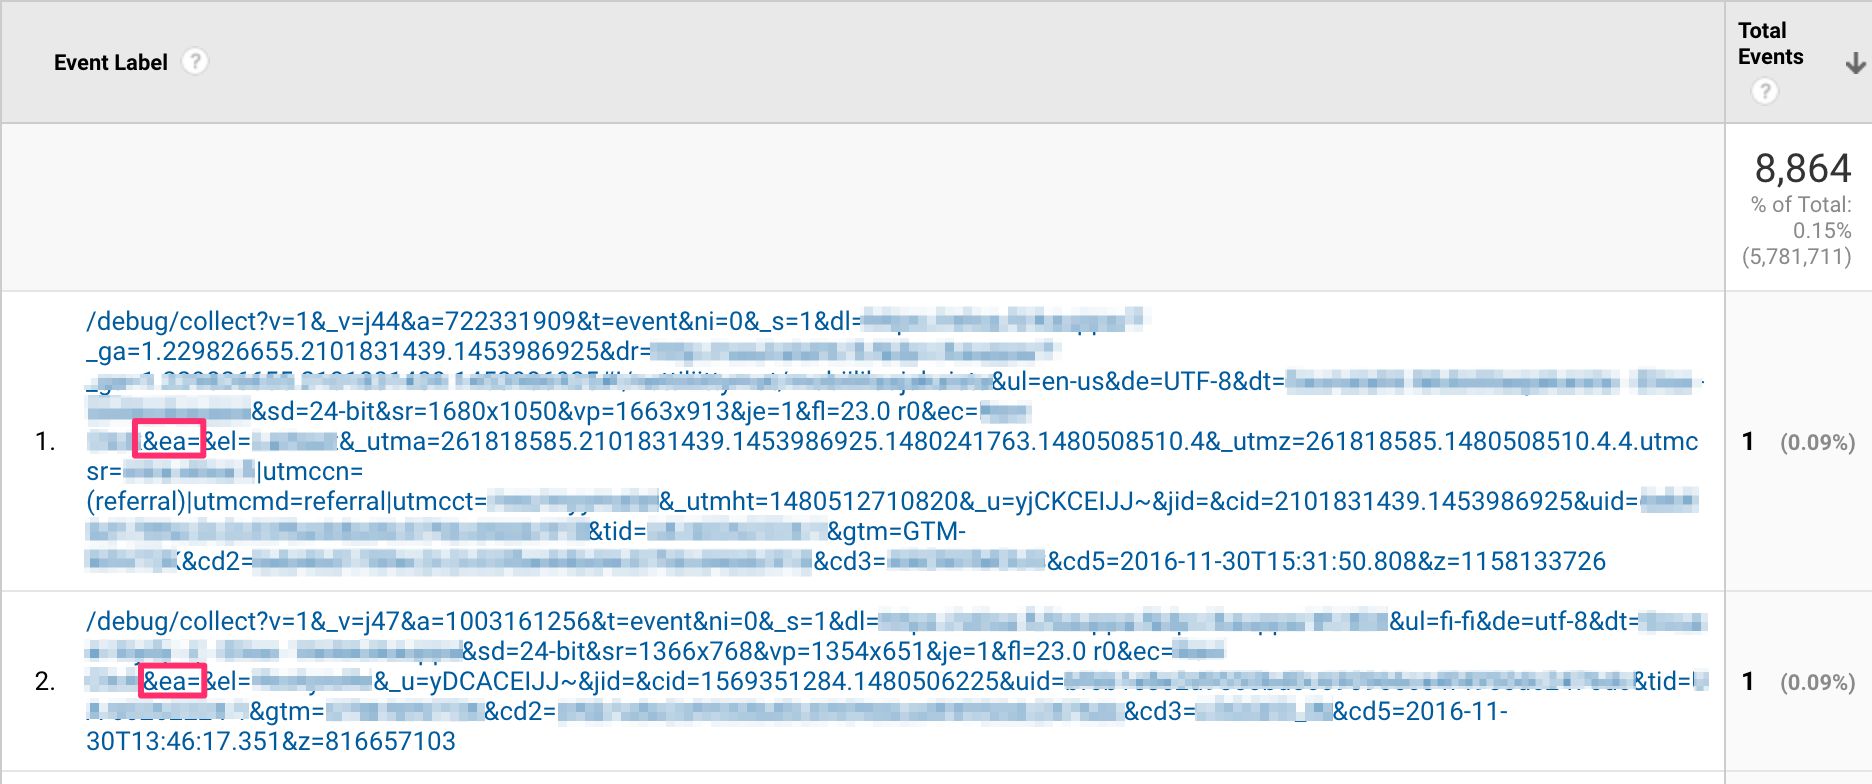
Heck, you can even click one of the error messages to drill down to the actual payloads. For example, if I choose ’ea’ error, I can see the payloads and verify that indeed, there’s no Event Action parameter with these hits.
I can then go to GTM, find the offending tag, and fix it to always send some value in Event Action.
Due to the abstraction of dataLayer, you don’t have to log this information in Google Analytics. In fact, you might not want to, since you might already have some sort of logging rig setup in your development process. Thanks to Google Tag Manager, you can push the data to any endpoint that supports JavaScript-generated data transfer (e.g. HTTP requests).
However, I’ve elected to send the information to Google Analytics. Doing so, I can align these validation errors with all the other hits that this particular user has sent to GA, and I can thus potentially identify bigger issues that these validation errors might only be a symptom of. For example, it’s possible that an Ecommerce tag only fails if the user has followed a specific funnel on the site. By sending the validation error to Google Analytics, I can see if it occurred during one of these broken funnels, giving me more information to fix it in the end.
How to do it
You basically need a Custom HTML Tag that fires on the All Pages trigger, with a higher Tag Priority than any of your Google Analytics tags that might also fire on this event.
It’s important that this code starts its execution before your Google Analytics tags have a chance to start up. This code overwrites the ga() method, and any tag that has already fired will not be debugged with this solution.
You’ll first need the actual code for GA Spy, and you can download the latest version from Stephen’s repository. You need to copy-paste the JavaScript into a Custom HTML Tag, and then add the custom listener below it. Here’s the full example, where I’ve minified the GA Spy code to make it more compact. Scroll down past the GA Spy part to find the actual magic.
<script>
/* Minified GA Spy starts */
window.gaSpy=window.gaSpy||function(b){var j,k,c=function(a){if(b=null,a.debugLogPrefix=a.debugLogPrefix||"gaSpy",!a.callback||"function"!=typeof a.callback)throw new Error("["+a.debugLogPrefix+"] Aborting; No listener callback provided.");return a.gaObjName=a.gaObjName||window.GoogleAnalyticsObject||"ga",a.debug=!!a.debug,a}("function"==typeof b?{callback:b}:b),d=c.gaObjName,e=window[d],f=window.console&&c.debug;?function(){var a=[].slice.call(arguments);a.unshift("["+c.debugLogPrefix+"]"),console.log.apply(console,a)}:function(){},g=function(a){var b,d={args:a,the:{}},e=d.the;return c.debug&&function;(b,c){for(b="Intercepted: ga(",c=0;c1?b[0]:"t0",e.command=b.length>1?b[1]:b[0],b=b[b.length-1].split(":"),e.pluginName=b.length>1?b[0]:void 0,e.pluginMethodName=b.length>1?b[1]:void 0,"require"===e.command||"provide"===e.command?(e.pluginName=a[1],"provide"===e.command&&(e.pluginConstructor=a[2])):("send"===e.command&&(e.hitType=a[a.length-1]&&a;[a.length-1].hitType||a[1]),"object"==typeof a[a.length-1]&&(e.trackerName=a[a.length-1].name||e.trackerName))),f("Run listener callback",e),!1!==c.callback(d)},h=function(){var a=[].slice.call(arguments);if(c.debug){if(!g(a))return f("Command blocked.")}else try{if(!g(a))return}catch(a){}return f("Command allowed:",a),h._gaOrig.apply(h._gaOrig,a)},i=function(){var a,b=h._gaOrig=window[d];f("Hijack",b._gaOrig?"(already hijacked)":""),window[d]=h;for(a in b)b.hasOwnProperty(a)&&(window[d][a]=b[a])};if(f("Config:",c),e||(f("Instantiate GA command queue"),e=window[d]=function(){(window[d].q=window[d].q||[]).push(arguments)},e.l=1*new Date),e.getAll)f("GA already loaded; cannot see previous commands"),i();else{if(!e.l)throw new Error("["+c.debugLogPrefix+"] Aborting; `"+d+"` not the GA object.");if(f("Command queue instantiated, but library not yet loaded"),e.q&&e.q.length;){for(f("Applying listener to",e.q.length," queued commands"),j=[],k=0;k -1; })[0]
                               .description;
      var errorHit = data.hitParsingResult[0].hit;
      window.dataLayer.push({
        event: 'gaValidationError',
        gaValidationError: {
          description: errorDescription,
          hit: errorHit
        }
      });
    };

    // If a 'send' command is registered, start the process
    if (typeof ga === 'function' && trackerName && gaCommand === 'send') {
      ga(function() {
        tracker = ga.getByName(trackerName);
        if (!tracker.get('debugDone')) {
          originalSendTask = tracker.get('sendHitTask');
          tracker.set('sendHitTask', buildDebugHit);
        }
      });
    }
  } catch(e) {
    // Error handling
  }
});
</script>
This solution uses Universal Analytics Tasks API to copy the hit payload sent to Google Analytics, and to send it then to the debugger endpoint.
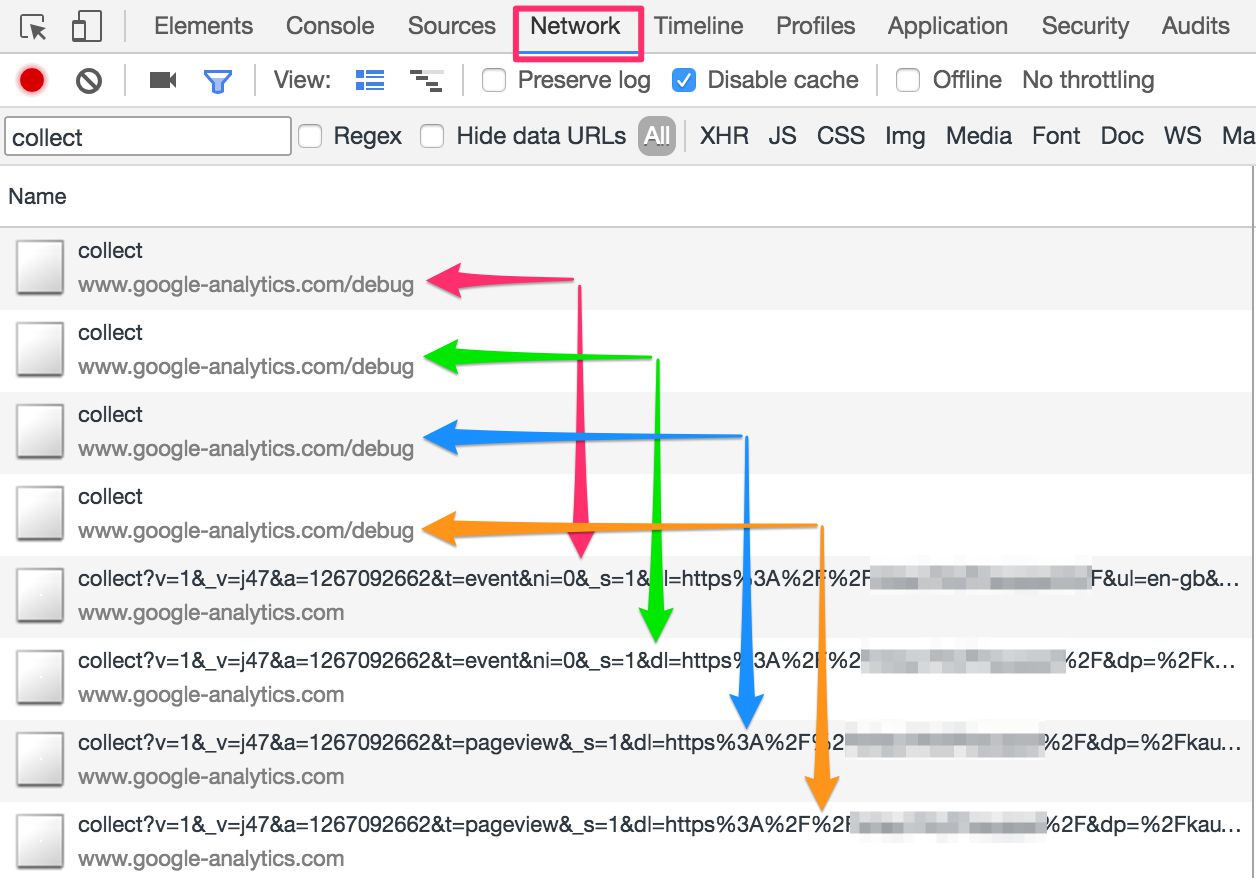
Since you’re actually “hijacking” Google Analytics here, it’s very important that you test this thoroughly. To see if it works, you should see a POST request to /debug/collect for each actual hit to /collect. You can find this in the Network debugger of your browser’s developer tools. Here’s what the output looks like in Chrome:
Again, remember to test it.
Send the information to Google Analytics
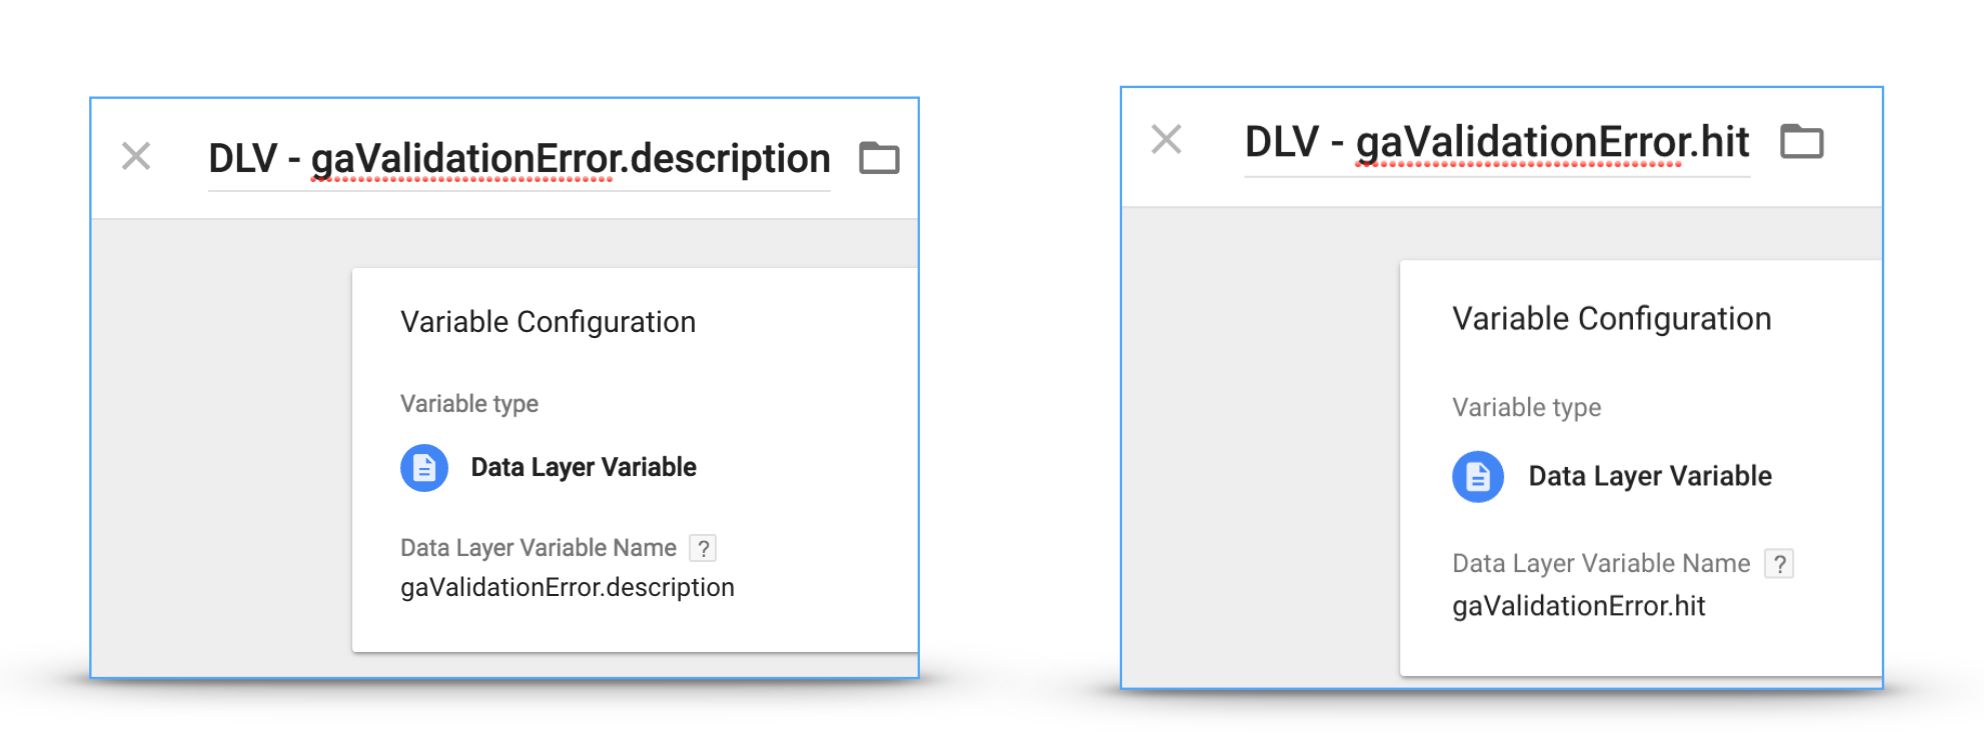
To send the validation error hits to Google Analytics, you’ll need a Universal Analytics tag, two Data Layer variables and a Custom Event trigger.
The Data Layer variables should point to variable names gaValidationError.description and gaValidationError.hit. They might thus look something like this:
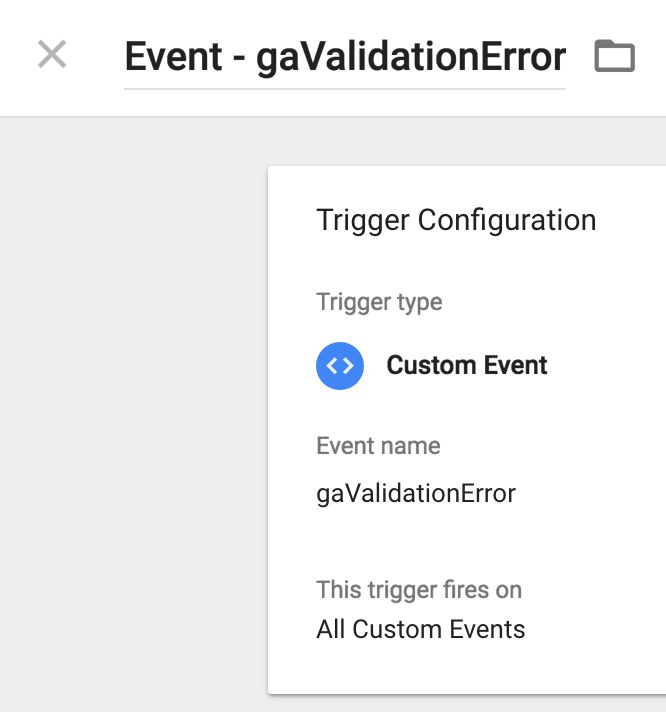
Next, the Custom Event Trigger is a simple affair, and looks like this:
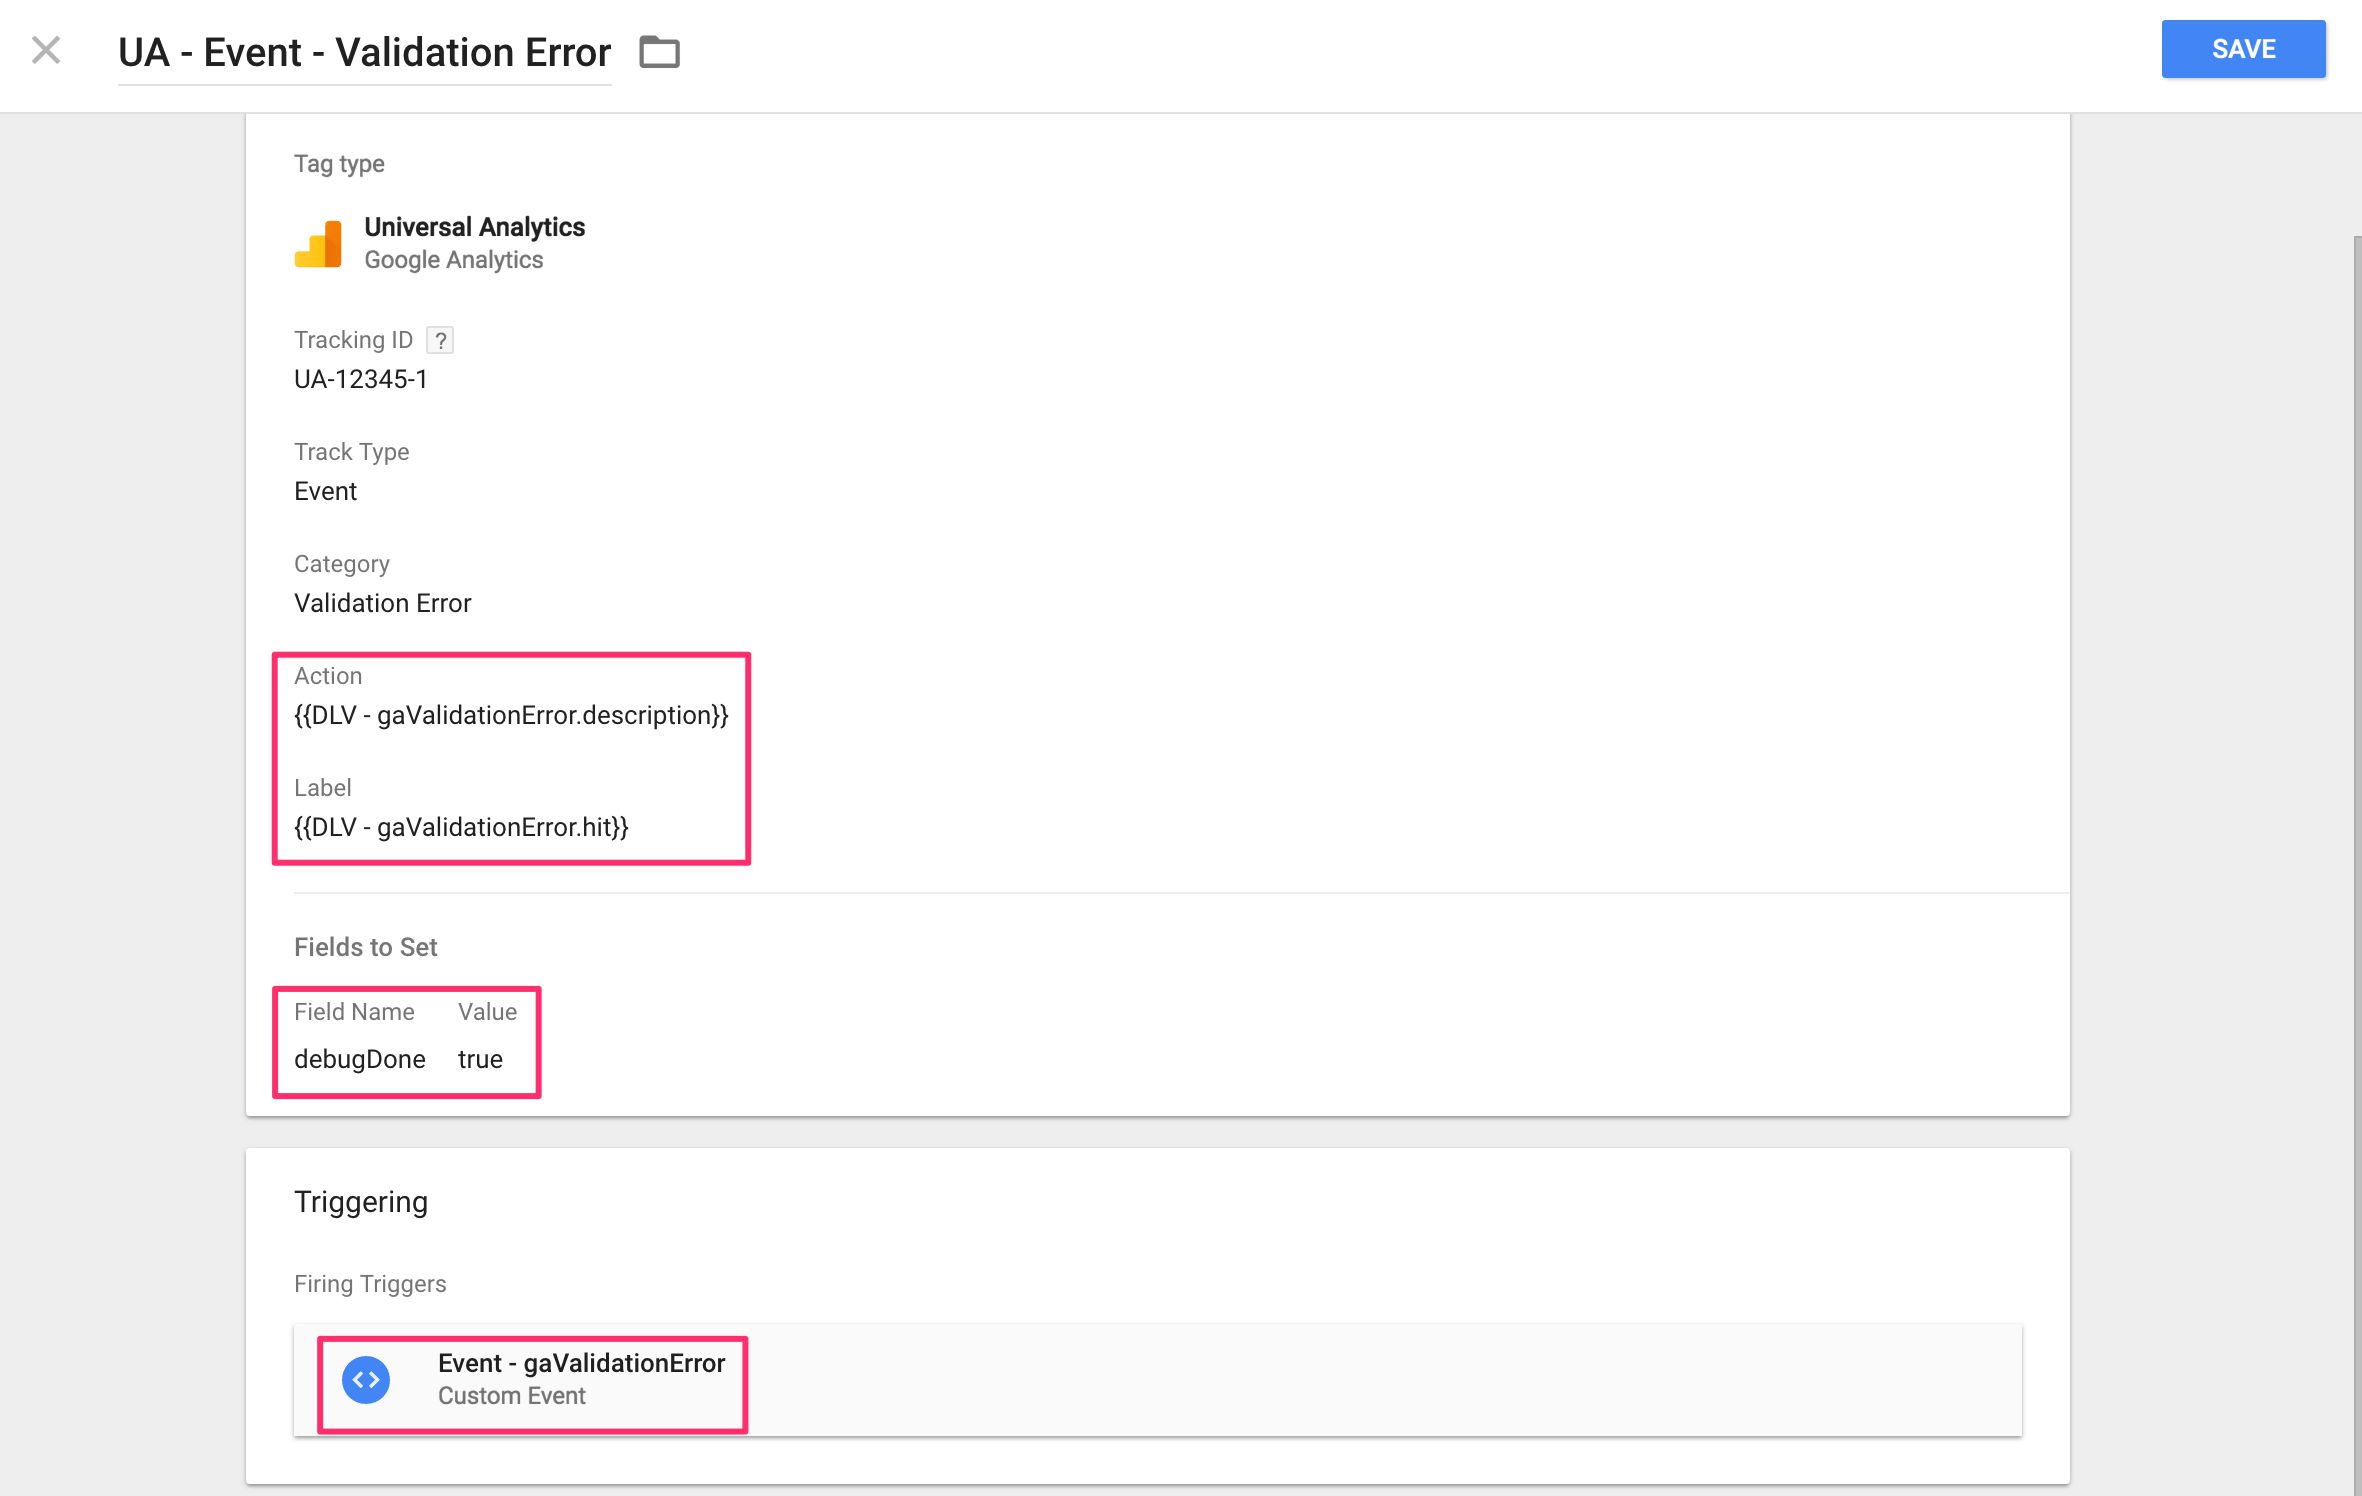
Finally, the Universal Analytics tag is your run-of-the-mill Event tag, with just one important modification. You need to set a custom Fields to set field to:
Field name: debugDone
Value: true
Don’t bother looking it up in the supported field reference for analytics.js, it’s not there. It’s a custom field I created only for this solution. It prevents two things: 1) Calls to the debug endpoint from multiplying when the same tracker is used, and 2) calls to the debug endpoint for the validation error events.
Here’s what the Event tag might look like:
This particular tag will send each validation error as a non-interaction event to Google Analytics, with the error description as the Event Action and the broken hit payload as the Event Label.
Summary
This solution relies on the awesomeness of GA Spy. The script basically hijacks the GA global method, and copies all commands to the debug endpoint.
What this solution does is give you yet another tool for validating your Google Analytics setup. When working with complex Google Tag Manager setups, it might be difficult to keep tabs on all the variables you are using. This might lead to problems in your tags, when a required field ends up with a blank value just because a variable didn’t resolve in an expected way. This solution lets you find these cases with ease, giving you a clear path to fixing them before they become a real data quality problem.
It would be pretty neat to have the /debug/ interface as a tool you could install locally. That way you wouldn’t need to do the trip to Google Analytics servers, and instead validate the hits in your own web server. On the other hand, the logic isn’t probably that complex, so having it as a dedicated JavaScript library would be great as well. In any case, the endpoint debugger is a really smooth tool, especially when combined with GA Spy as illustrated in this article.
Another thing that would make this whole thing easier was if the original request to /collect simply returned the debug payload automatically. That way you could just look at the responses to the GA requests without having to do the extra trip to /debug/. I understand this doesn’t exist because of latency and how most hits to GA are still done with a GET request. Still, Google could at least make it a configurable setting in the GA request.