Google Tag Manager is strictly a tag delivery system, and it’s very careful not to collect any analytics data on its own. This is most likely a deliberate choice, because if GTM was to start collecting data, it would introduce additional barriers to adoption.
Nevertheless, being a tool that consolidates the design, development, deployment, and testing of all the marketing and analytics pixels, code snippets, and utilities running on a website or a mobile app, lacking the necessary features for auditing and monitoring has always seemed like an oversight.
Recently, Google Tag Manager introduced a new API for custom templates: addEventCallback. This API lets you create your own monitoring system for your container. With community effort and support from Google, the new API will introduce a number of solutions around tag monitoring and auditing in the near future.
In this article, Mark Edmondson and I will help you get started. We’ll introduce how the new API works and how you can use it to build the necessary tags and triggers in GTM for monitoring purposes. We’ll also show you how to use powerful, cheap, and scalable features of the Google Cloud Platform to create the backend for the monitoring system, and finally we’ll give you some ideas for how to visualize the data in a Google Data Studio report.
You can also check out this video, where I go through (almost) the same steps in video format.
The Simmer Newsletter
Follow this link to subscribe to the Simmer Newsletter! Stay up-to-date with the latest content from Simo Ahava and the Simmer online course platform.
Guest author: Mark Edmondson
Mark Edmondson is a former colleague of mine, a fellow Google Developer Expert for Google Analytics, and the owner of one of the most versatile skill sets in our industry. He’s currently working as a data engineer at IIH Nordic (a great company full of nice folks in its own right!).
Mark is fluent in bridging together the worlds of marketing and analytics, and his reach extends far beyond, as evidenced by his prolific contributions to the open-source space. He’s the author of the popular googleAnalyticsR library for R, and his blog is full of great walkthroughs for data engineering, data science, web analytics, and software development.
Being one of the most humble people I’ve met, he’s probably royally embarrassed by this introduction. So I’ll just wrap up this introduction by making it clear how grateful I am for his contributions not just to this article but to our whole industry.
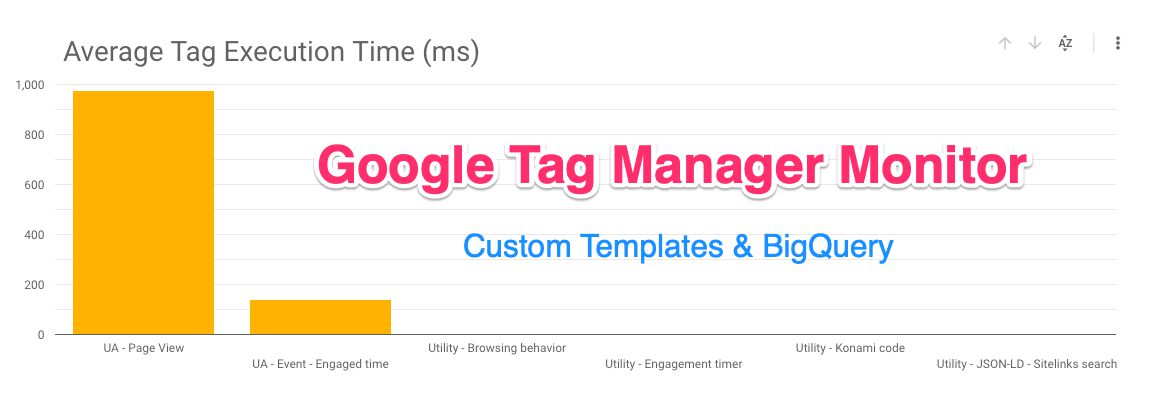
What we’ll build: The Google Tag Manager Monitor
The key deliverable of this little project is a BigQuery view that collects data from your website. This data will be sent by way of a new Google Tag Manager custom template, and it will comprise statistics of all the tags that have fired on your site for any given dataLayer event.
In this proof-of-concept, the metadata collected from each dataLayer event includes:
Event name and timestamp (to uniquely distinguish events with the same name from each other).
Tag ID, name, firing status, and execution time for every tag that fired for that event (or
nullif no tags fired for the event).
It’s extremely easy to extend this solution to include things like Container ID or tag categorization information - we’ll explore these later in the guide.
Why do we need a monitor?
There aren’t that many ways to monitor the consistency of tags firing in your containers. Obviously, you can run reports against the various endpoints, such as Google Analytics or Facebook, and detect anomalous data collection through their reporting interfaces.
But this has some problems:
Not all endpoints have reports readily available.
With endpoints collecting data from multiple different sources, it’s difficult to identify those that come from GTM and those that do not.
It’s difficult to know if the data issues in the endpoints are due to data collection or something else (e.g. a broken filter in Google Analytics).
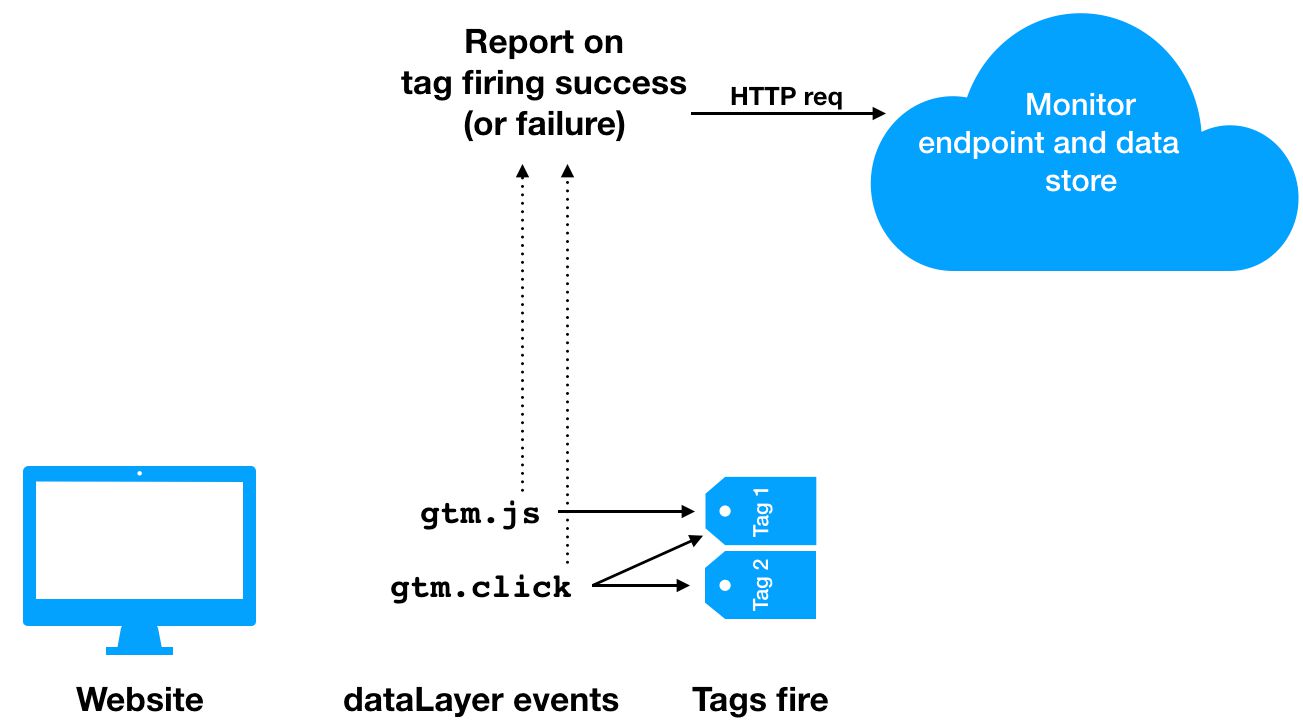
In other words, if you want to be alerted to issues in data collection, the best way to do this is to monitor the data collection itself.
For this to be possible, the data collection mechanism requires the possibility to introduce a side effect. The side effect in this case is the addEventCallback API, and its purpose is to collect metadata about the data collection preferably to an endpoint that is separated from the tags that are being monitored.
Why have a separate endpoint for monitoring? Well, it wouldn’t really make sense to collect data about Google Analytics’ data collection in Google Analytics itself (a custom reporting property, for example), because if the analytics data collection fails due to not being able to connect to the GA endpoint, then the monitoring data collection would fail as well.
That is why this article utilizes an endpoint in the Google Cloud Platform to collect the data. It’s not failsafe, either, since if the data collection fails due to a network outage, the collection to GCP would fail, too. Even though there are ways to tackle this problem as well, we’ll try to keep things at an MVP (minimum viable product) level, and you can then extend the solution to fit your more elaborate needs.
Step 1: Build the custom template
The custom tag template will create a callback that is called every time a dataLayer event reaches conclusion. This is basically the same thing as the eventCallback of Google Tag Manager, just wrapped in a template API.
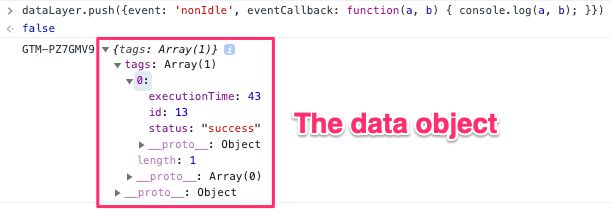
When the callback is invoked, an array of tags is passed to the callback in a data object. Each tag is reported with the following metadata:
id: Tag IDstatus: Firing status (e.g. success, failure)executionTime: Execution time in milliseconds
We’ll augment this data set with these values:
eventNameandeventTimestamp(to uniquely identify each event)name: Tag name
It’s easiest to show by doing.
In Google Tag Manager, open up the Templates view, and create a new tag template.
You can also download the template from here and import it directly into your container.
1.1. Fields
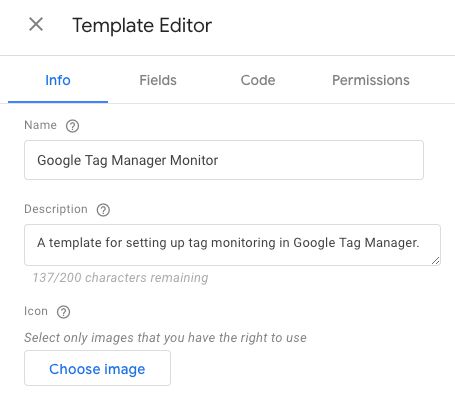
Feel free to add whatever you want into the Info tab of template. We went with this:
In the Fields tab, we’re going with two default fields. One for the endpoint URL, and one to let the user decide whether to batch the hits or not.
There is a third field as well, which becomes available if the user decided to batch the hits.
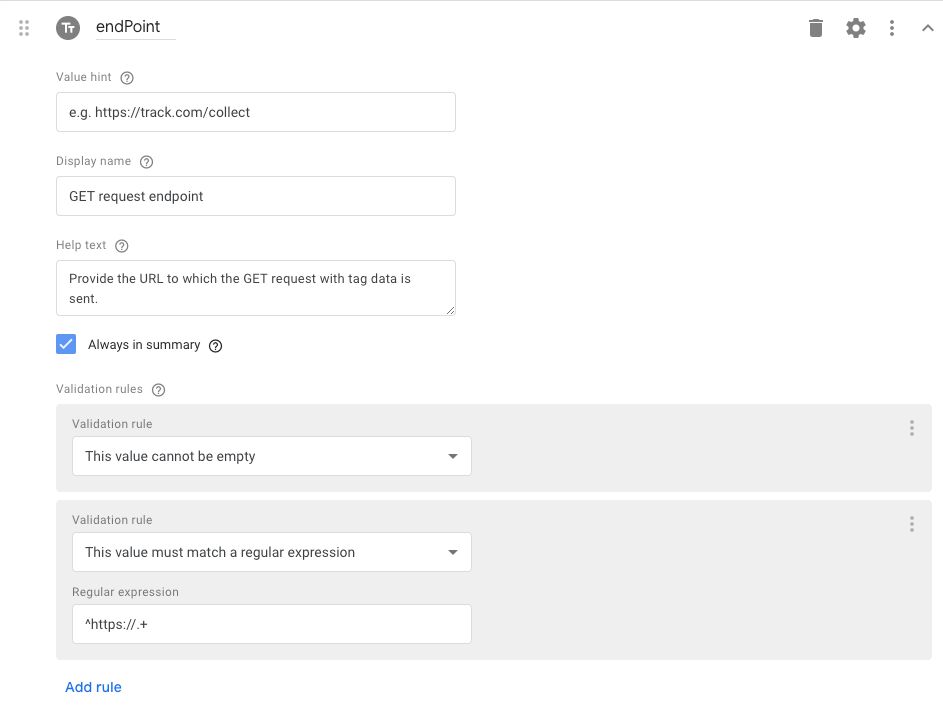
1.1.1. endPoint field
The first field is a Text input field named endPoint.
It has the following Field configurations toggled on:
Value hint:
e.g. https://track.com/collectDisplay name:
GET request endpointHelp text:
Provide the URL to which the GET request with tag data is sent.Always in summary: checked
Validation rules
There are two validation rules:
This value cannot be empty
This value must match a regular expression:
^https://.+
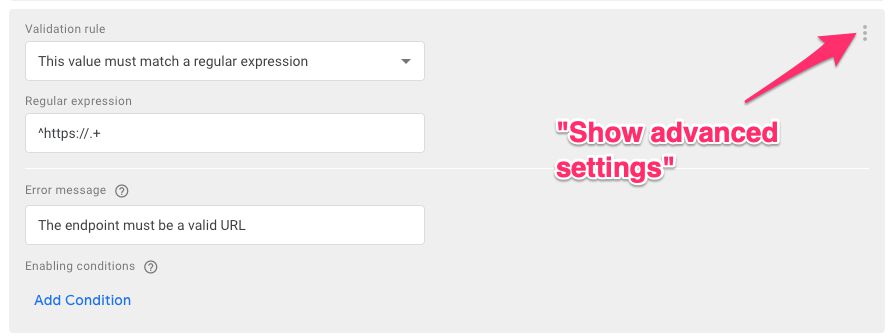
If you want, you can add some customized error messages to these validation rules by opening the Advanced settings for each rule.
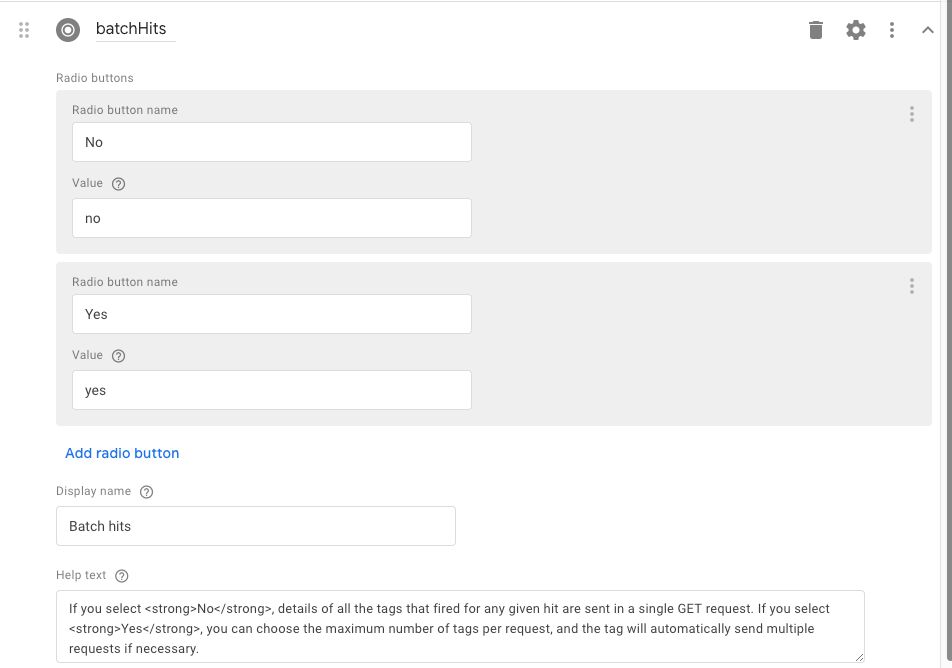
1.1.2. batchHits field
The second field is a Radio button field named batchHits.
It has the following Field configurations toggled on:
Display name:
Batch hitsHelp text:
If you select No, details of all the tags that fired for any given hit are sent in a single GET request. If you select Yes, you can choose the maximum number of tags per request, and the tag will automatically send multiple requests if necessary.
There are two radio buttons.
The first one is named No, and has the value no.
The second one is named Yes, and has the value yes.
The Yes button has a nested field (found after showing advanced settings for the button), which is a Text input field named maxTags.
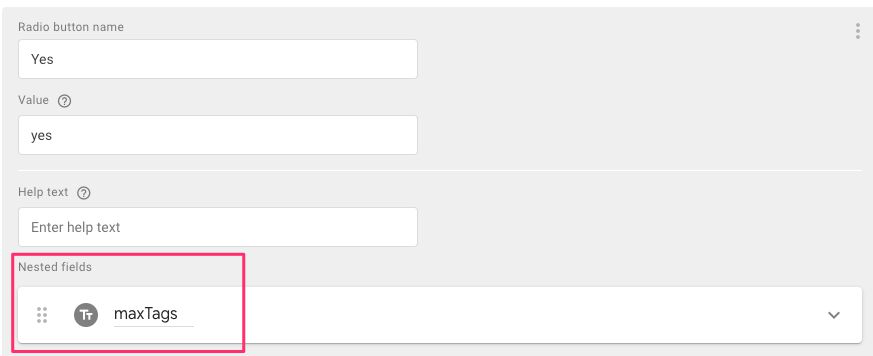
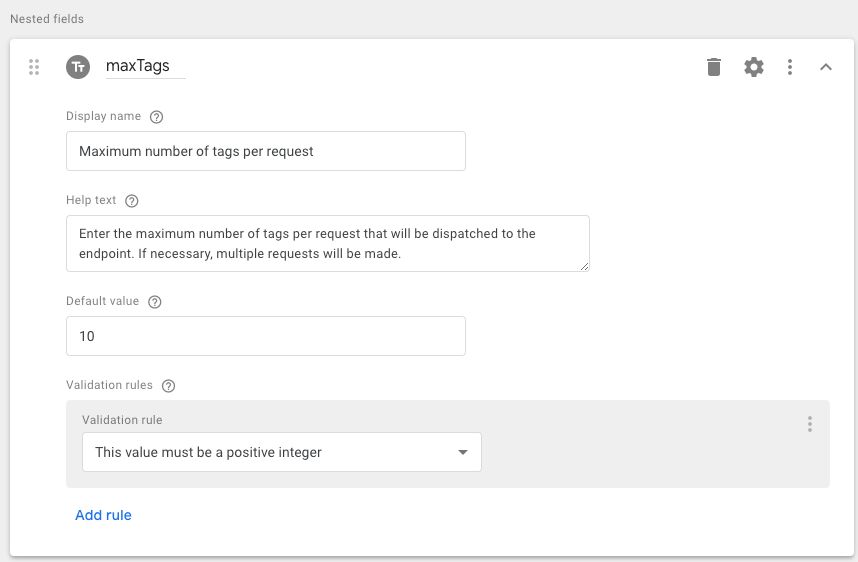
1.1.3. maxTags field
The nested maxTags field is a Text input field where the user can set a limit of tags sent per request.
This is useful if you have tags with long names or dataLayer events that can fire dozens of tags at a time. Sending the requests in batches should reduce the effort required in the endpoint to parse the data into the BigQuery table.
The field has the following Field configurations toggled on:
Display name:
Maximum number of tags per requestHelp text:
Enter the maximum number of tags per request that will be dispatched to the endpoint. If necessary, multiple requests will be made.Default value:
10Validation rules
The sole validation rule is This value must be a positive integer.
1.2. Code
In the Code tab, add the following code:
// Require the necessary APIs
const addEventCallback = require('addEventCallback');
const readFromDataLayer = require('copyFromDataLayer');
const sendPixel = require('sendPixel');
const getTimestamp = require('getTimestamp');

// Get the dataLayer event that triggered the tag
const event = readFromDataLayer('event');

// Add a timestamp to separate events named the same way from each other
const eventTimestamp = getTimestamp();

const endPoint = data.endPoint;
const batchHits = data.batchHits === 'yes';
const maxTags = data.maxTags;

// Utility for splitting an array into multiple arrays of given size
const splitToBatches = (arr, size) => {
  const newArr = [];
  for (let i = 0, len = arr.length; i < len; i += size) {
    newArr.push(arr.slice(i, i + size));
  }
  return newArr;
};

// The addEventCallback gets two arguments: container ID and a data object with an array of tags that fired
addEventCallback((ctid, eventData) => {

  // Filter out tags that have the "exclude" metadata set to true
  const tags = eventData.tags.filter(t => t.exclude !== 'true');

  // If batching is enabled, split the tags into batches of the given size
  const batches = batchHits ? splitToBatches(tags, maxTags) : [tags];

  // For each batch, build a payload and dispatch to the endpoint as a GET request
  batches.forEach(tags => {
    let payload = '?eventName=' + event + '&eventTimestamp=' + eventTimestamp;
    tags.forEach((tag, idx) => {
      const tagPrefix = '&tag' + (idx + 1);
      payload +=
        tagPrefix + 'id=' + tag.id +
        tagPrefix + 'nm=' + tag.name +
        tagPrefix + 'st=' + tag.status +
        tagPrefix + 'et=' + tag.executionTime;
    });
    sendPixel(endPoint + payload, null, null);
  });
});

// After adding the callback, signal tag completion
data.gtmOnSuccess();
The functionally most significant part of this code is the addEventCallback() method. This invokes the API of the same name.
The API checks the dataLayer event that triggered the tag created from this template, and then updates the dataLayer eventCallback with the function defined in the template.
In other words, when whatever event that triggers this monitor tag is fully resolved (i.e. all tags have signalled completion), the callback function will execute with data about each of the tags that fired on the event.
There’s a provision in place to exclude any tags from the monitoring based on a tag metadata field you can set (more on this below). For some, it might make sense to exclude the monitoring tag itself from being monitored, even though there might be value in measuring its execution time along with all the other tags'.
By far the most significant code is run when the payload is built:
batches.forEach(tags => {
   let payload = '?eventName=' + event + '&eventTimestamp=' + eventTimestamp;
   tags.forEach((tag, idx) => {
      const tagPrefix = '&tag' + (idx + 1);
      payload +=
       tagPrefix + 'id=' + tag.id +
       tagPrefix + 'nm=' + tag.name +
       tagPrefix + 'st=' + tag.status +
       tagPrefix + 'et=' + tag.executionTime;
   });
   sendPixel(endPoint + payload, null, null);
});
Here, every tag that fired on the event is parsed and concatenated into a URL query string payload. For example, a dataLayer event named gtm.js that fired two tags might have the following payload:
?eventName=gtm.js
&eventTimestamp=1562402273899
&tag1id=12
&tag1nm=GA-PageView
&tag1st=success
&tag1et=124
&tag2id=29
&tag2nm=Facebook
&tag2st=failure
&tag2et=422
This is then joined with the endpoint URL, and a GET request is dispatched.
This is the payload that is captured by the endpoint in the Google Cloud, which Mark will show later how to create.
It’s easy to extend this with additional metadata. Just update the payload += concatenation with each additional metadata key you want to access from the tags.
1.3. Permissions
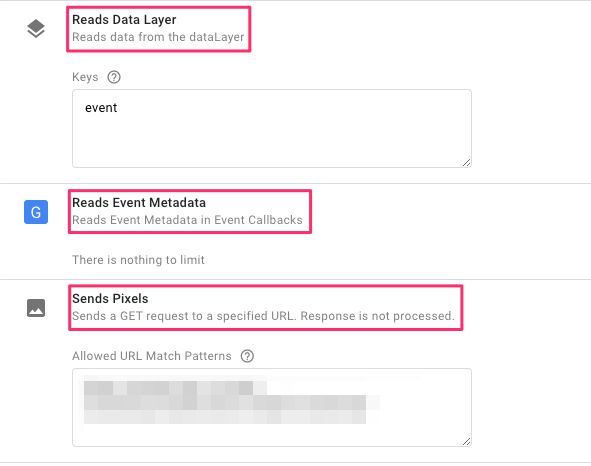
If you’ve added the code into the code editor without errors, you should see three permissions predefined in the Permissions tab.
Reads Data Layer: Add the key
eventinto the text area.Reads Event Metadata: No input necessary.
Sends Pixels: Add the URL of the endpoint you will be sending the data to (you can use wildcards and partials matches, too).
Naturally, you won’t know the endpoint until you’ve created it, so if you want to test the template before creating the endpoint, you can just a placeholder in the permissions such as https://placeholder.com/collect.
You can Test the template if you wish, but it won’t really do anything, as the callback requires an event to be pushed into dataLayer to trigger.
Save the template once you’re done.
Step 2: Tags and triggers
The first thing we’ll need to do is create the monitor tag itself.
2.1. Create the monitor tag
In GTM, go to Tags and create a new tag. Select the template you just created from the tag type selector.
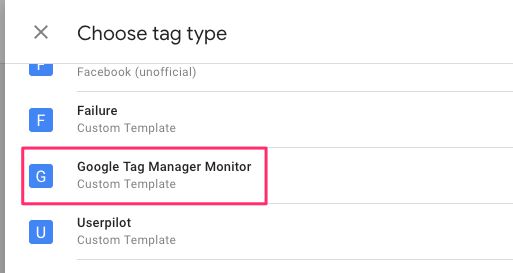
The GET request endpoint field takes the endpoint you’ll create in the next section, so you can just use the placeholder value of https://placeholder.com/collect there for now, we’ll return to this shortly.
If you want to send the hits in batches, choose the Yes radio button, but you might want to start without batches and just use the default settings.
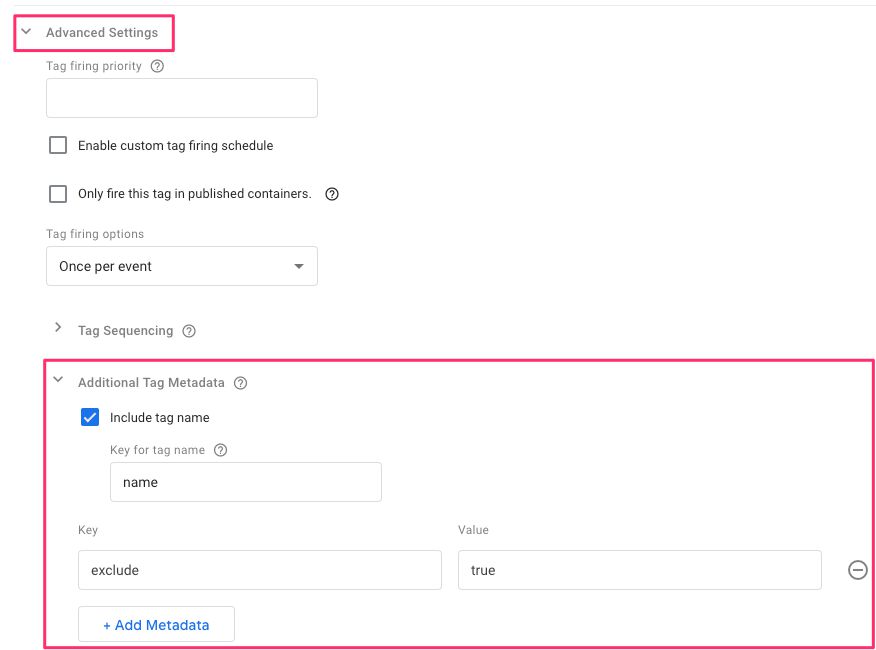
Next, expand Advanced Settings and scroll down to a new setting named Additional Tag Metadata.
Click it open, and check the box named Include tag name. Set the Key for tag name value to name.
Add a new metadata by clicking the + Add Metadata button, and set these values:
Key:
excludeValue:
true
Because this monitor should monitor every single event that fires in your container, add a new Custom Event Trigger to the tag that looks like this:
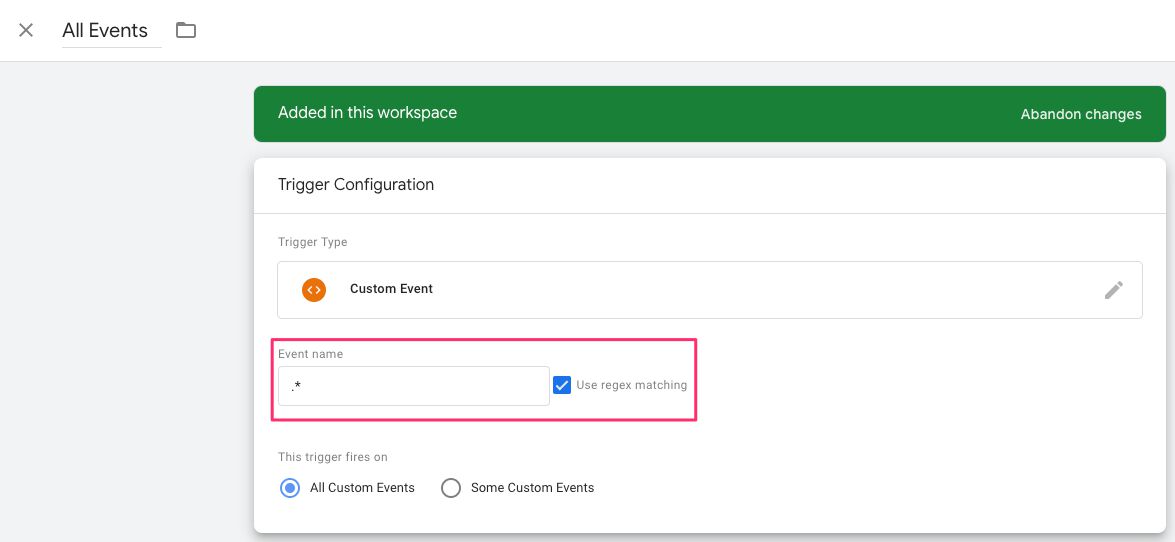
With that regular expression for the event name, the monitor tag will fire for every single dataLayer event.
Save the trigger and tag when ready.
2.2. The Additional Tag Metadata setting
As you can see, there’s a new advanced setting for Google Tag Manager tags.
This Additional Tag Metadata setting lets you add metadata to every single tag in the container. This metadata is added to the tags passed to the eventCallback of the dataLayer.push() (such as the one added by the addEventCallback custom template API).
One predefined metadata is already given to you: the tag name. By checking the Include tag name box, the eventCallback data object will always include the name key (or whatever key you assign), automatically set to the tag’s name.
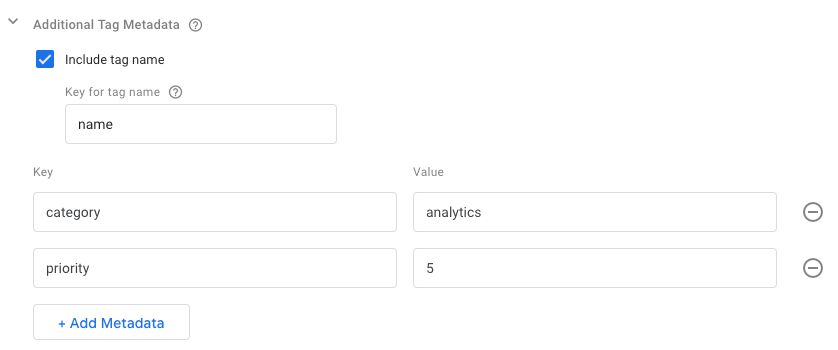
You can add additional metadata too, such as category or type of tag.
Just remember that the solution as established in this article only makes use of the tag name and exclude metadata keys. Any other metadata you add will require a code change in the template, as the new metadata will need to be concatenated into the payload string as well.
2.3. Update all your tags
The last thing you’ll need to do in GTM (apart from updating the endpoint URL of the monitor tag when you have one), is to update every single one of your tags to include the tag name metadata. The tag name is easier to interpret than the tag ID when building your reports and visualizations.
For each tag, expand the Advanced Settings and check the Include tag name checkbox under Additional Tag Metadata. Remember to set the key name to name as well.
Hopefully, the tag name would be automatically included as a metadata in the future - it seems like a sensible feature to have always on. Or, at the very least, flip the checkbox around and require it to be checked if you want to exclude the tag name from the tag’s metadata.
At this point, you should have your monitor tag with almost all the settings in place, and you should have now edited all your tags to include the tag name. The monitor tag should have a Custom Event trigger that fires it for every single dataLayer event.
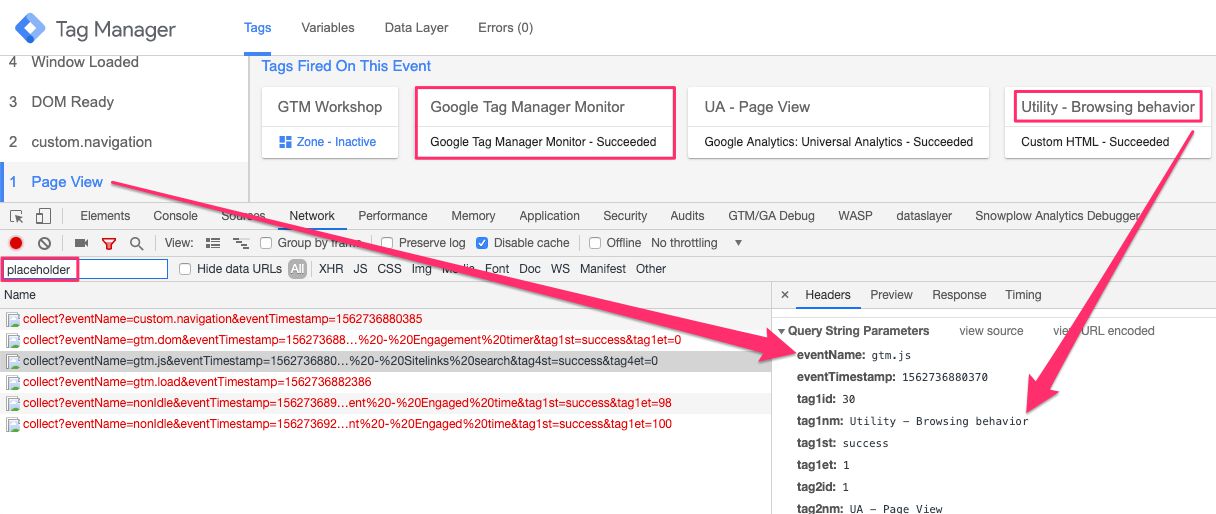
Feel free to test in Preview mode to see if the endpoint is invoked with a proper query string. You should see something like this in the Network logs of your browser, assuming you used the placeholder URL of https://placeholder.com/collect.
Next up, Mark will show us how to get the Google Cloud Platform endpoint up and running!
Step 3: Creating the Google Cloud Platform endpoint
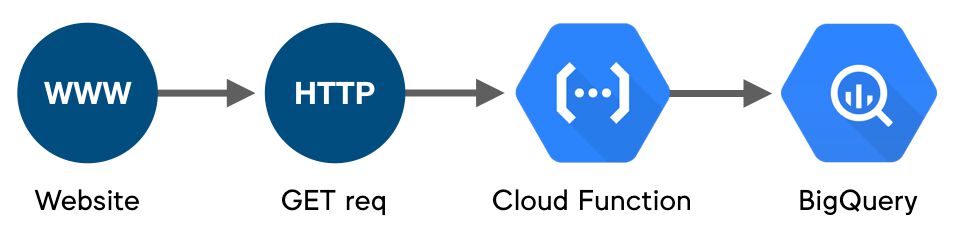
The GCP endpoint needs to process the GET requests sent from the site, insert them into a BigQuery table, parse them into columns and rows, and finally connect the data to Google Data Studio.
3.1. Choosing the GCP solution for the endpoint
Boiling down the use case requirements here, we are looking to turn an API call containing the GTM tag data into useful data for analysis. There are many ways to solve this particular use case on GCP - we’ll go through some and show why we eventually went for Cloud Functions.
The general solution requirements were:
Serverless: so we don’t babysit a server but are able to deal with high traffic and/or scale down to zero cost when no data is collected.
Low-code: easy to deploy and maintain.
Low-config: minimal maintenance so it can be generalized and can deal with varying data schemas easily.
The final output is to be a dashboard in Data Studio, so the natural choice for the eventual destination was BigQuery due to the ability to connect via its native Data Studio connector.
Quick aside: We are wary of dashboards being a final solution for data flows since they rely on a human being to react to give you ROI. It’s fine for a proof-of-concept, but for your own project consider your actual use case - perhaps you could instead implement automatic alerts if certain thresholds on data quality were broken or something similar.
With the above requirements in mind, some solutions included:
3.1.1. Pixel tracking via a load balancer
We thought about a Pixel Tracking Solution first, since in theory the only steps needed are to upload a pixel to Cloud Storage, make it publicly available, and then stream the access logs into BigQuery.
However the resulting API endpoint is an HTTP IP address (e.g. http://111.222.333.444) and the Google Tag Manager API requires communication over HTTPS. It’s absolutely possible to assign a custom domain and SSL certificate to the load balancer, but to make the demo more accessible for everyone we wanted to find a solution that provided its own domain and HTTPS endpoint.
However, if you do have a custom domain name at hand, the load balancer is probably the most robust solution to utilize, since it doesn’t require the overhead of running a programmed application.
3.1.2. App Engine
The next stop was App Engine, which up to last year would have been the one we’d pursue. In fact, here is some code on how to set up streaming from GTM to BigQuery that Mark wrote three years ago.
However, since then Cloud Functions have arrived which have even less configuration and code required to set up the service. You may still want to consider App Engine if you have more requirements such as integration with Cloud Endpoints or other GCP APIs, for which Cloud Functions do not have support yet.
3.1.3. Technology of choice: Cloud Functions
This is the one we went for. For getting something quickly up and running, it is hard to beat. If using Python, you only need to write code, create a requirements.txt file, set the function to trigger with a public endpoint (via HTTP requests), and you have everything we need - HTTPS, scalable infrastructure and almost no configuration necessary.
It may cost more per call than the solutions above, but it scales down to zero meaning you can deploy and wait for traffic without incurring any costs for downtime.
Note that Cloud Functions can take 100 million calls per 100 seconds in hits, but BigQuery itself accepts only (!) up to 100,000 rows per second per project which equates to 10 million calls per 100 seconds. If this is a limitation you might find yourself struggling with, you’ll need to start batching the data to BigQuery instead of streaming it.
3.2. BigQuery setup
With the API endpoint technology selected, we turn to configuring BigQuery.
Loading data into BigQuery requires a schema for the data (STRING, INT, TIMESTAMP, etc.) which can be tricky if you are sending in a lot of data with untidy types (most data, that is) - one mistake and the data won’t load. We’re accepting data from an open HTTP endpoint so we are almost certain to get messy data and thus want to be able to modify sent data without reconfiguring everything.
To account for the above, we favor loading data into BigQuery with as few restrictions as possible, but then use BigQuery’s SQL to parse or transform the raw data into tidier forms. If you don’t know SQL but are better with JavaScript, you may prefer to do that data tidying logic in the Google Tag Manager code sending the data, or if better at Python perhaps in the Cloud Function collecting it. We still recommend to do this kind of data cleaning in BigQuery since otherwise changes need code updates in harder-to-reach places.
To achieve this, the BigQuery table accepting the GTM data will have as simple a data schema as possible: it will accept the entire URL as a string and not try to parse out the tag names or GTM events quite yet. We shall then create a BigQuery View on top of that data which will split the URL into a workable, tidy format.
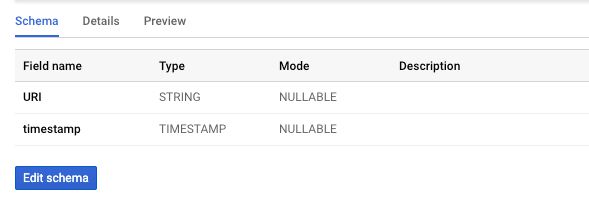
The final raw data schema then is simply the URI and a timestamp. We consider a timestamp always useful to have, and we will stream the data into a partitioned table which automatically aligns the datasets with the date of data ingestion to make time-based analysis easier.
To create the table, you need a Google Cloud Platform project with billing enabled. Once you have that in place, browse to the BigQuery web UI and create a dataset for your project.
With the dataset in place, you can then create a table in it.
Putting all of the above into place, the BigQuery table settings look like this:
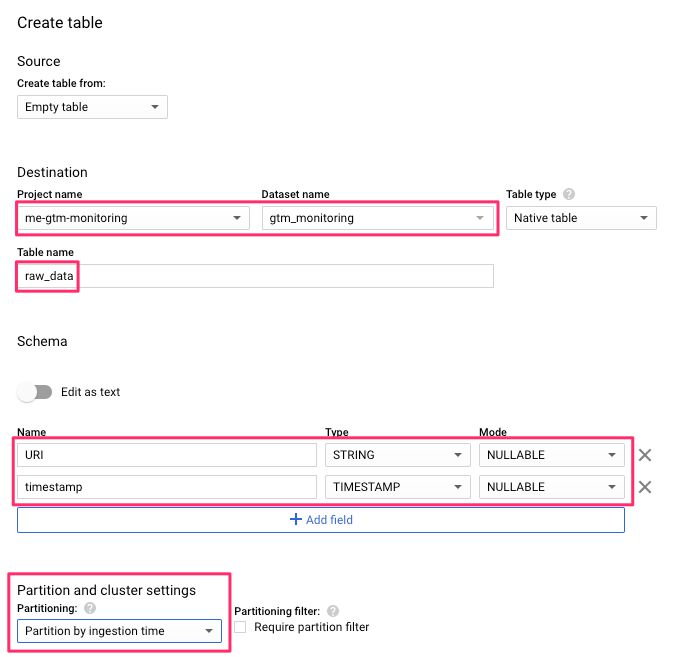
The partition will put each hit’s data into a partition of today’s date, e.g. 20190703, which you can use to query particular time periods via BigQuery’s _PARTITIONDATE field.
Make note of the project name, dataset name, and table name. You are naturally free to choose whatever you want for these, but you need the values when configuring the Cloud Function code next.
3.3. The Cloud Function Code
Now let us get some data into the table. This is the Python code we’ll use to update the Cloud Function with. You don’t need to store any code locally - you can use the web UI. The code below is based on the examples given using the Python SDK for BigQuery.
See the next chapter for information on where to copy-paste this code.
from google.cloud import bigquery
import datetime
import logging

PROJECT='me-gtm-monitoring' # Update to match your project name
DATASET='gtm_monitoring'    # Update to match your dataset name
TABLE='raw_data'            # Update to match your table name

def stream_bq(uri):

    client = bigquery.Client()

    table_ref = client.dataset(DATASET).table(TABLE)
    table = client.get_table(table_ref)

    # Stream the URI of the request
    errors = client.insert_rows(table, [{'URI':uri,
                                         'timestamp': datetime.datetime.now()}])

    if errors:
        logging.error(errors)


def gtm_monitor(request):

    if request.url:
        stream_bq(request.url)
3.3.1. Code walkthrough
We first import the libraries for connecting to BigQuery (google.cloud.bigquery), creating the timestamp (datetime), and logging errors (logging).
Then you need to alter the code to set the project, dataset, and table for the destination BigQuery data.
from google.cloud import bigquery
import datetime
import logging

PROJECT='your-project' # Update to match your project name
DATASET='your_dataset' # Update to match your dataset name
TABLE='your_table'     # Update to match your table name
As you can see, you actually need to create the table first - you can see the settings for the table in the previous chapter. Once you have the project, dataset, and table created, update the Cloud Function code above with the correct values.
Below is the function stream_bq() to stream data into BigQuery. As we are deploying the Cloud Function in the same project that hosts the BigQuery table, Cloud Functions will handle authentication for us. All we need is the bigquery.Client() call, and the Cloud Function will handle authentication and identity management using the default service account set for the project.
We then create the table object, and stream the data into the table using the client.insert_rows() method. This will return errors if it fails, in which case we’ll log them.
def stream_bq(uri):

    client = bigquery.Client()

    table_ref = client.dataset(DATASET).table(TABLE)
    table = client.get_table(table_ref)

    # Stream the URI of the request
    errors = client.insert_rows(table, [{'URI':uri,
                                         'timestamp': datetime.datetime.now()}])

    if errors:
        logging.error(errors)
Next, gtm_monitor() is the main function that will be the entry point to the Cloud Function. We define this in the web UI (see below). The function checks if the request had a URL, and if it did, it sends this to the stream_bq() method described above.
def gtm_monitor(request):
if request.url:
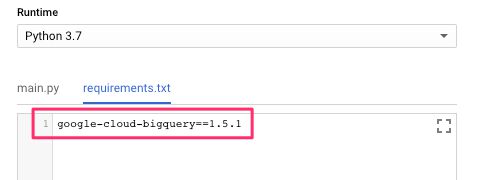
stream_bq(request.url)Finally we also need to modify the requirements.txt file in the Cloud Function - we can do this in the web UI as well. Cloud Functions automatically parses this file to install any necessary python libraries through pip.
The only external dependency we need is the BigQuery SDK. The beauty of Cloud Functions is that you don’t need to install this locally and then deploy the whole project at once - you can simply edit the requirements.txt file in the online editor to have the Cloud Function automatically install the dependency before running any code.
The line you need to add is this:
google-cloud-bigquery==1.5.13.3.2. Create and deploy the Cloud Function
With all the theory out of the way, we can now look how to actually write and deploy the code in the Cloud Function.
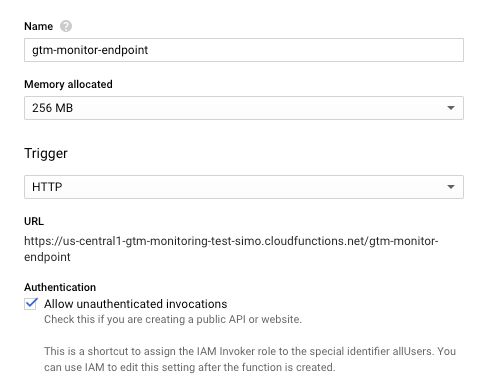
From a Google Cloud Project (with billing enabled) go to https://console.cloud.google.com/functions/add.
Give the function a descriptive name.
Select HTTP as the trigger.
Tick the
Allow unauthenticated invocationsbox to make it accessible from anywhere.Select the
Python 3.7runtime.Paste in the main function code from the previous chapter into
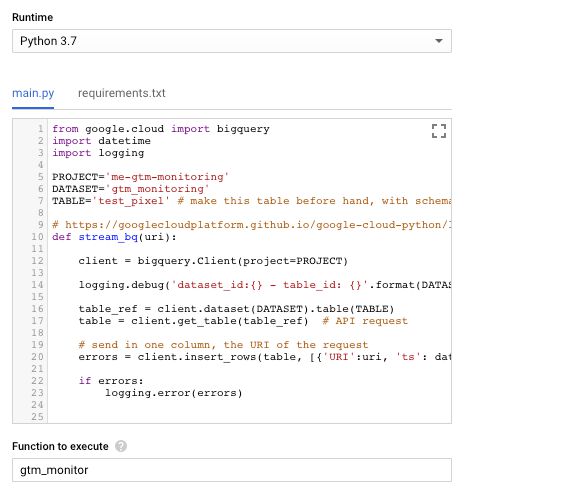
main.py, and make the appropriate changes where required (the project, dataset, and table names).Copy-paste the BigQuery dependency into the
requirements.txttab of the online editor.Set the Function to execute field to
gtm_monitor, as this is the entry point of the Cloud Function.Hit Create at the bottom of the screen.
Note that you can expand the More link to change the region from us-central-1 to something closer to where most of your traffic comes from. This should improve performance and decrease latency.
After hitting Create, you should be able to see the URL the Cloud Function has assigned to your new function. This would be something like https://us-central1-my-project.cloudfunctions.net/my-function.
After all that you should have a function that looks a little like this:
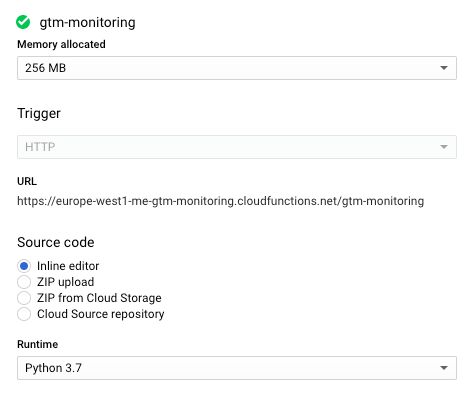
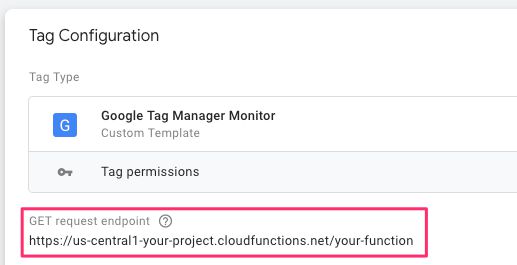
3.4. Update the Google Tag Manager Monitor tag
With your cloud function deployed, you should now have a URL endpoint for your Google Tag Manager Monitor tag looking something like https://us-central1-your-project.cloudfunctions.net/your-function.
In your Google Tag Manager Monitor tag, update the GET request endpoint to reflect the correct Cloud Function HTTP endpoint and save the tag. You’ll then need to edit the Custom Template and open its Permissions tab. Update the Sends Pixels permission with the correct endpoint URL.
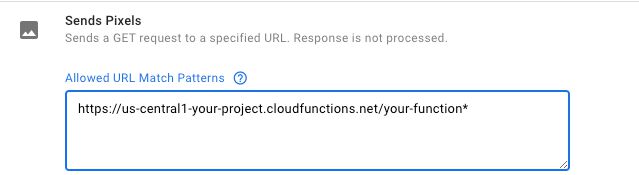
Make sure to add the * at the end of the permission URL to account for query parameters.
You can continue in Preview mode for a while to ensure that everything works before publishing the container for all your visitors.
If everything works, you should see GCP logs of your Cloud Function (accessible in the Cloud Function UI) showing HTTP calls are being triggered.
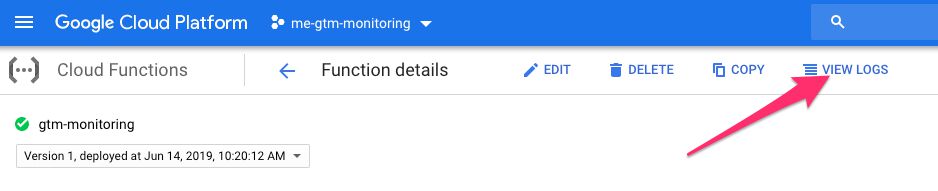
Within BigQuery, you should see data is being populated with the URI requested. Make sure to turn the cache off and query via SELECT * FROM dataset.table_name to test live data, as the Preview may show no data even when there is some. Nevertheless, after doing the SELECT * query, or after patiently waiting for the Preview to update, you should see your raw data being logged into BigQuery like this:
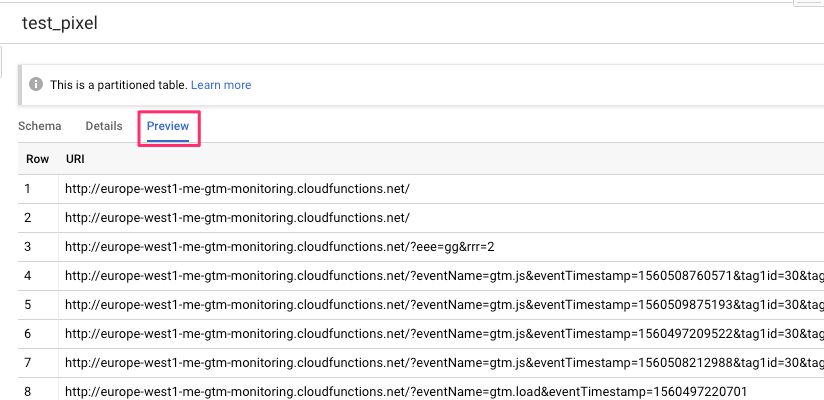
If you got this far, congratulations! You now have a live stream of data from your Google Tag Manager setup into BigQuery. Just imagine all the other use cases for this pipeline!
3.5. Parsing BigQuery raw data into a view
Now we do the parsing of this data into something useful. Simo took a jab at writing the necessary SQL for the proof-of-concept (M: Good job, Simo! S: Why, thank you!).
There is probably some more elegant way to do this with arrays, but this is what we went with in that it uses regular expressions to parse out the URI string into usable columns. It is here you can do adjustments to the output data to put it in a format you want.
Make sure to update the FROM statement to pull the data from the correct project/dataset/table combination.
SELECT
  timestamp,
  eventName,
  eventTimestamp,
  (SELECT REGEXP_EXTRACT(tagString, "&tag\\d+id=([^&]+)")) as tagId,
  (SELECT REGEXP_EXTRACT(tagString, "&tag\\d+nm=([^&]+)")) as tagName,
  (SELECT REGEXP_EXTRACT(tagString, "&tag\\d+st=([^&]+)")) as tagStatus,
  (SELECT REGEXP_EXTRACT(tagString, "&tag\\d+et=([^&]+)")) as tagExecutionTime
FROM (
  SELECT
    timestamp,
    eventName,
    eventTimestamp,
    tagStringUnnest as tagString,
    pt
  FROM (
    SELECT
      timestamp,
      (SELECT REGEXP_EXTRACT(URI, "eventName=([^&]+)")) as eventName,
      (SELECT REGEXP_EXTRACT(URI, "eventTimestamp=([^&]+)")) as eventTimestamp,
      (SELECT REGEXP_EXTRACT_ALL(URI, "&tag\\d+id=[^&]+&tag\\d+nm=[^&]+&tag\\d+st=[^&]+&tag\\d+et=[^&]+")) as tagStringRegex,
      DATE(_PARTITIONTIME) as pt
    FROM
      `your-project.gtm_monitoring.raw_data`
  )
  LEFT JOIN UNNEST(tagStringRegex) as tagStringUnnest
)
Once you have the SQL you want running in the BigQuery Web UI, select Save View to save the query as a table that will be used day-to-day.
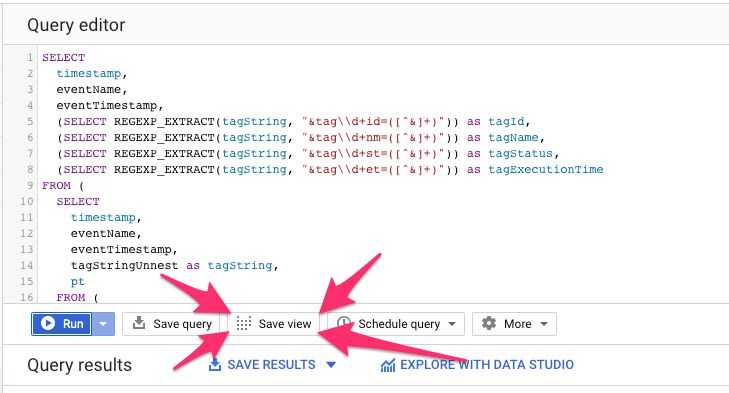
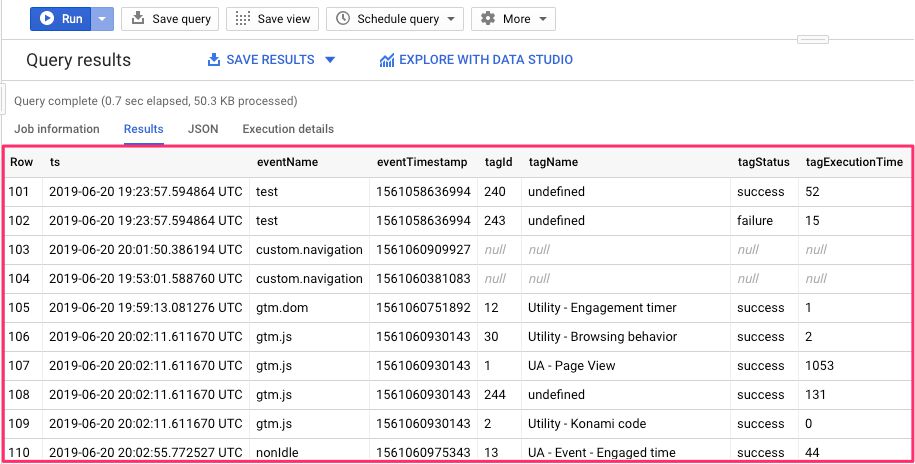
Here’s what the data looks like when parsed into the view.
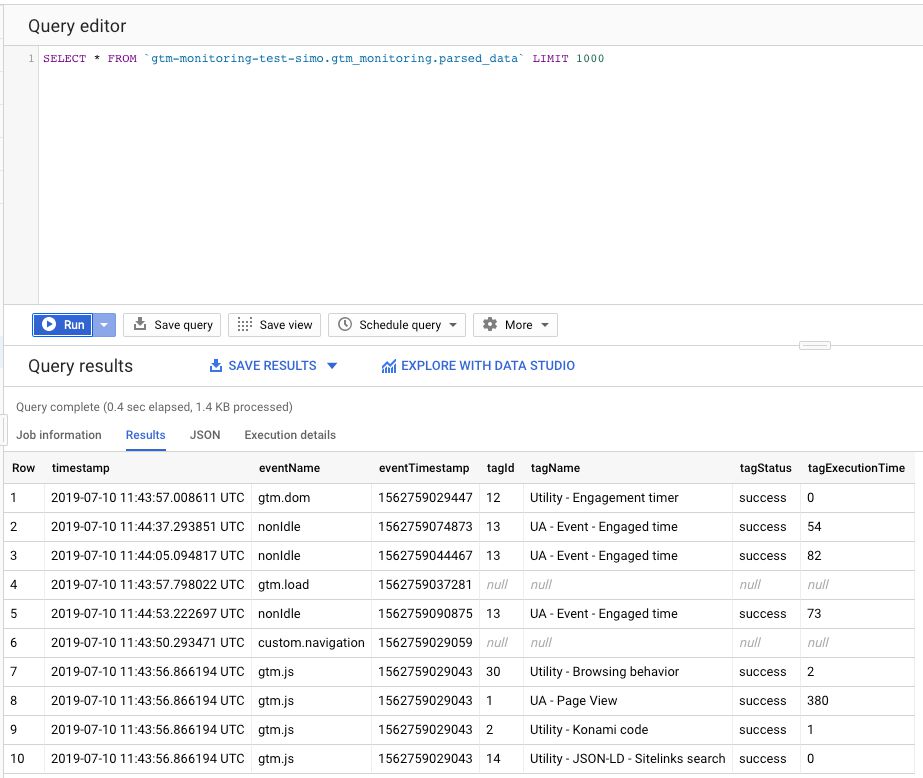
Step 4: Visualize the data
For most use cases, having the data in a BigQuery view is already more than enough. That’s the data set you can query for anomaly detection, or plug into a pipeline for automated alerts.
Nevertheless, we can see how useful a proper visualization of the data could potentially be. For this purpose, Google’s Data Studio is an excellent project for quickly delivering useful visualizations. Best of all, it already has a built-in BigQuery connector for querying your BQ data with.
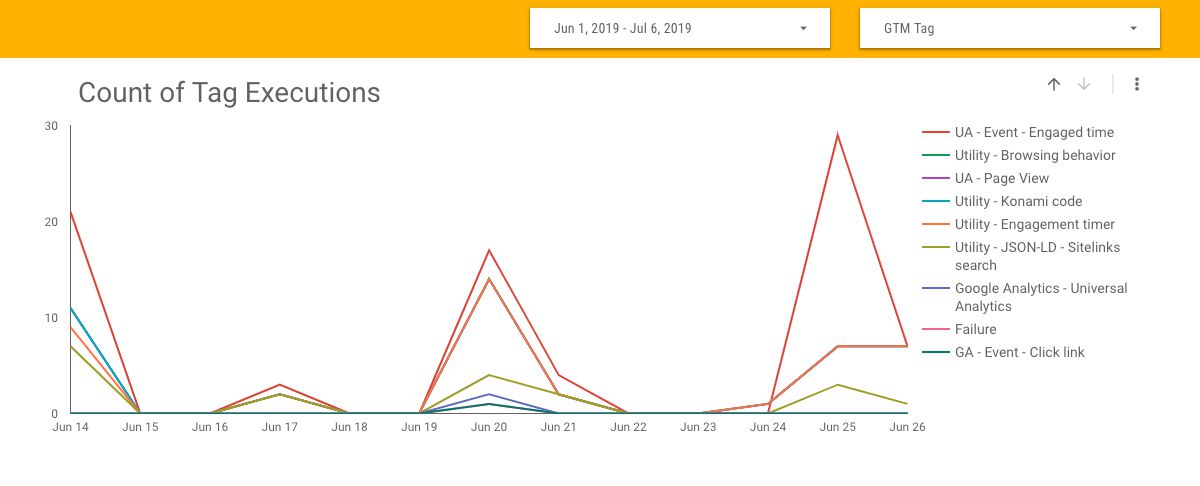
As a demo, we’ve created a starter dashboard for you to check out. Feel free to copy it and modify it to suit your own purposes.
Summary
Maybe we haven’t said this enough yet, but this is a proof-of-concept. This article serves a number of purposes:
You’ll learn how to set up a pipeline of data collection from the website, via Google Tag Manager, to a data warehouse located in the Google Cloud.
You’ll learn about the new
addEventCallbackAPI in Google Tag Manager’s custom templates.You’ll learn about the new Additional Tag Metadata field in GTM’s tags.
You’ll learn how to efficiently monitor the success rates and execution times of your Google Tag Manager tags.
We can only hope that others build much cooler and more useful solutions than this simple MVP. Some features we considered useful but not in the scope of this introductory article:
Report that compares data from the respective end points with that of GTM’s monitor system to see if tags are firing but not sending the correct data.
Utilize a pixel file stored in Google Cloud Storage, behind a load balancer, to achieve a zero-code setup with superior performance compared to a Cloud Function.
Training a machine learning model on the data set to identify anomalies and automatically alert to them when detected.
Let us know in the comments what you think of this, and how you would improve it if you had the chance!
Final note from Simo: I am truly grateful to get the great Mark Edmondson to co-author this article and design the monitor solution with me. As the editor, I take full responsibility for any errors and mistakes in the final draft of the article.