(Last updated June 2014: Read the latest post on the extension, GTM Sonar v1.2.)
Many of the Google Tag Manager articles on this blog could be considered hacks, in that they extend the out-of-the-box features of GTM in ways that will surely not be officially supported by Google. The crux of the problem is that lots of folks are taken by surprise when GTM refuses to work properly on their site, or when they have trouble tracking key elements on the page template.
Auto-event tracking is a very common denominator when problems with GTM arise. It’s a wonderful feature that lets you automatically tag and track actions on the webpage using event listeners, but there are many issues with conflicting JavaScript and shoddy markup that might prevent auto-event tracking from working altogether.
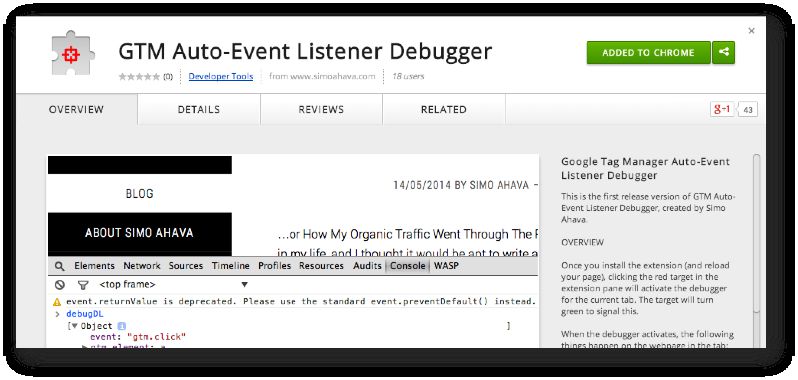
To help you in establishing the current state of your template, I give you the GTM Auto-Event Listener Debugger Chrome Extension (name under construction). It should be a welcome tool for you if you want to debug your page template and your on-page elements with automatic click tracking in mind.
First things first: download the GTM Auto-Event Listener Debugger here.
The Simmer Newsletter
Follow this link to subscribe to the Simmer Newsletter! Stay up-to-date with the latest content from Simo Ahava and the Simmer online course platform.
Disclaimer
Markup woes should always be resolved with site developers first and a licensed therapist second. Most of the time it’s just a question of whether best practices have been observed, such as identifying unique elements with IDs, grouping similar styles together with classes, or having a consistent layout hierarchy. These are all issues that should be fixed in the CMS (or the template), because they facilitate development work on the website in the future as well.
However, there are many reasons why a rapport with the developers can’t be established. You might be a hired hand with only GTM and web analytics as your domain. The developers might know squat about web development. The organization might insist upon rigid processes and bureaucracy to get anything done, and that just won’t sit with your vision of agile analytics.
Whatever the case, sometimes you just have to hack your way through the shortcomings of your CMS or your page template. If nothing else, at least you’ll have a proof-of-concept in your hands to deliver to the developers.
Instructions
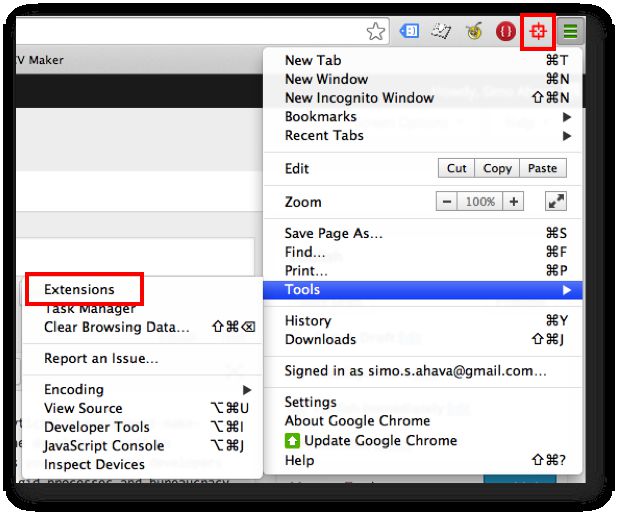
To use the debugger, first make sure you’ve enabled it in Tools -> Extensions of your Chrome browser. If it’s enabled, you should see a red target icon on your extension pane.
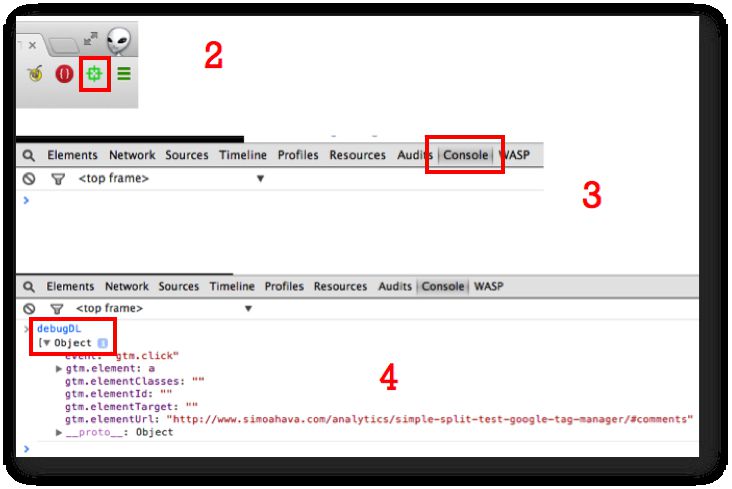
The actual steps of using the debugger are simple:
Browse to a web page you want to debug
Click the red target (it should turn green to signal that the debugger is running)
Click anywhere on the page
Open JavaScript Console in Chrome, type
debugDL, and press Enter
When you switch the debugger on, it does two things: 1) it halts the default action of all clicks on the page, 2) when you click an element, it stores its details in the debugDL array in identical format to the GTM listeners.
Why prevent default action of clicks? Simple, for debugging reasons it’s better if you stay on the same page for testing stuff. Halting the default action prevents links from working. Because debugDL is an object in the current document, it will persist only for the page you’re on (similar to how dataLayer works).
And why store the object in debugDL and not dataLayer, for example? Well, I wanted this debugger to not screw up with any existing frameworks, so you can play around freely. Sure, someone else might have come up with the name “debugDL” in other libraries or extensions, but I’ll take my chances.
When you turn the debugger off (by clicking the target again), the default action of click events is returned. The debugDL array is not erased, however, and you can continue to view its contents for as long as you’re on the page.
The debugging part begins when you start going through debugDL. Every click is registered in identical format to what you’d get if you had a GTM Click Listener active.
What’s the point?
The idea is to test your page template if it works with GTM listeners.
Or maybe you want to plan ahead and choose the properties of the clicked element (or its parents or siblings) you want to access in your macros.
Or maybe you want to see if the click events are propagating to the GTM listeners, which operate on the top document node.
My favorite reason is this: I do a LOT of debugging for people, and I’m not always given access to their preview / debug container. So there’s actually no listener firing on the page, and I have to guess by looking at markup and by reverse engineering their JavaScript to identify why click listeners might not work.
With this extension, I can debug the site without needing an actual GTM click listener at all.
Technical stuff
If you know your Chrome Extensions, you’ll know that they operate in an isolated environment. What this means in practice is that you can’t access variables created by the page in the extension.
This has implications for this listener as well, because I want to store data in the window.debugDL array.
To circumvent this problem, when you turn the debugger on, it injects a script block into your page template, which creates the object. This script block also primes the click listener on the document node. When you then click anywhere on the page, another injection is done in the form of a push into debugDL.
Injecting stuff sucks, but it’s the only way (as far as I know) to modify variables in the window object through the extension.
When you turn the debugger off, it removes the event listener and all custom script blocks created by the extension.
Note also that the debugger actions are unique to whichever tab the debugger was activated in. This means that you can have multiple tabs open, each with their own instances of the debugger running or not. Cool, huh?
What’s next?
Since this is my first foray into Chrome Extensions, there’s a lot of fine-tuning to be done. Here’s a list of stuff I’ve thought about doing in the near future. I’ve also requested beta-testing from the wonderful people in the Google+ GTM community, so I hope I’ll have more features on the drawing board soon!
A toggle to unbind all jQuery click handlers on the site – to test if interfering jQuery is the reason your clicks aren’t being registered by auto-event listeners
Add a Link Click Listener function as well – to only register clicks on link elements
Add a Form Submit Listener function as well – since around 75 % of all listener woes have to do with form submissions, this is really a no-brainer
Add other event handlers, such as mouseover, keydown, change – to demonstrate the power of automatically tracking all user-based actions
Make it prettier and flashier
Think of a better name for the extension