#GTMTips: Tips For Logging In Server-side Tagging
One of the largest costs in a server-side tagging can be logging. Google warns about this in their official documentation, and it’s definitely something to keep a keen eye on if your server-side endpoint processes enough data per month.
How much should it process for logging to become an issue? It depends, but you could start seeing some impact once the endpoint processes >1 million incoming requests per month. The best way to find out if logging is a problem is to visit the Billing dashboard in your server-side tagging Google Cloud project and check what the portion of Log Volume is in your monthly costs.
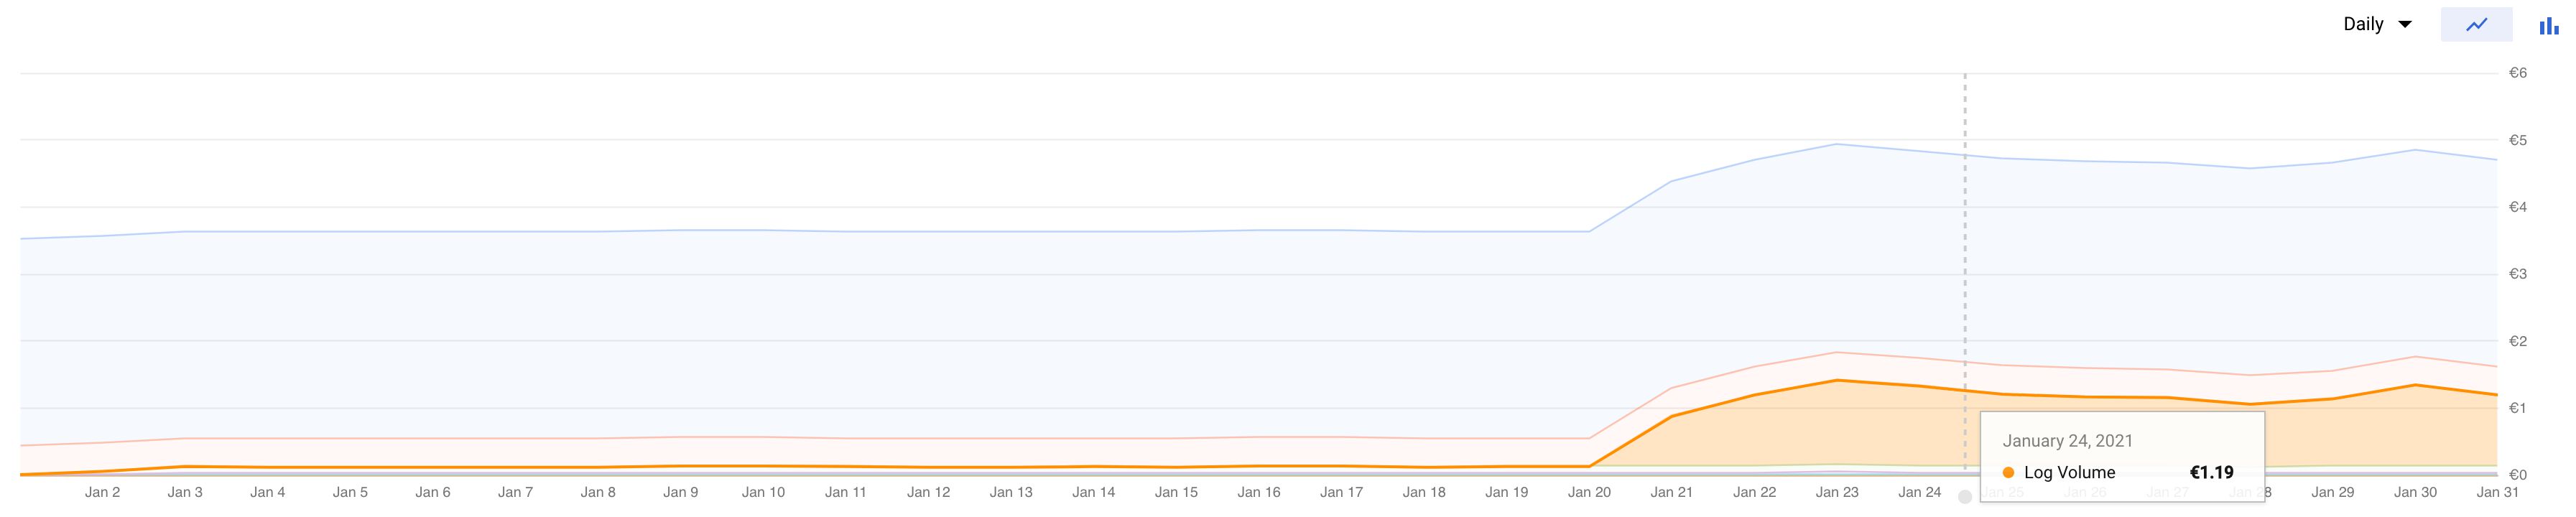
In the image above, the endpoint processes around 10-20 million requests per month. Logging isn’t a cost factor until the last 10 days of the month, because App Engine doesn’t charge the project for the first 50 GiB (gibibytes) of logs. In this particular case, logging costs around 12 euros per month, which is 10% of their monthly cost.
Once the property collects more than 100 million hits per month, logs can essentially duplicate the monthly cost, and once you’re collecting even larger amounts of data, the logging costs can bankrupt your company.
In this article, I’ll share with you three tips regarding logging. Two on how to keep the costs down, and one on how to find log output in a production environment (i.e. without the benefit of the Preview mode’s Console tab.)
XThe Simmer Newsletter
Subscribe to the Simmer newsletter to get the latest news and content from Simo Ahava into your email inbox!
Tip 122: Tips for logging in server-side tagging
Note! You should only filter out request logs if they are a cost for you. Otherwise, let them be logged – it’s excellent data for debugging.
Tip #1: Suppress all request logging
The easiest way to get the costs down is to prevent App Engine from logging anything about the incoming requests. This will essentially take your log expenses to zero.
The downside is that, well, you lose the log. You won’t be able to view incoming request details, which might be useful for error logging (see below).
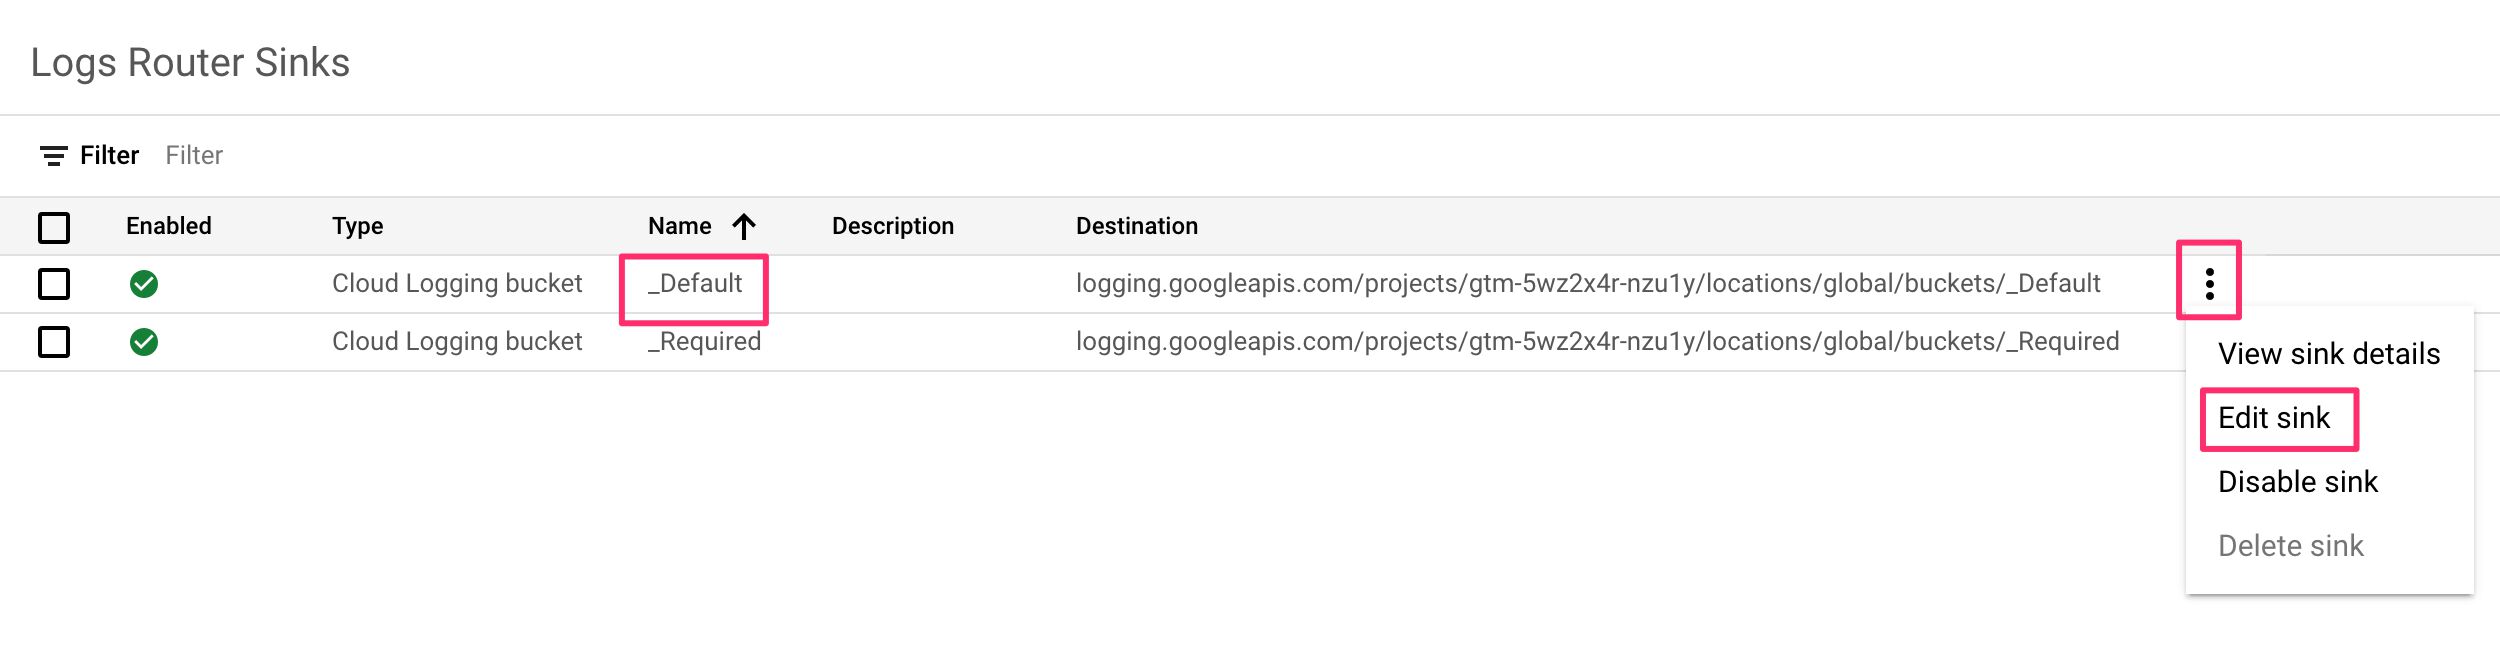
To do this, open the Logs Router for your Google Cloud project (the one for which your server-side tagging setup is configured).
Click the overflow menu at the end of the row for the bucket named _Default, and choose Edit sink.
In the Choose logs to include in sink section, edit the Build inclusion filter text area, and add a new row to the end. In this new row, add the following text:
NOT (LOG_ID("appengine.googleapis.com/nginx.request") OR LOG_ID("requests") OR LOG_ID("appengine.googleapis.com/request_log"))
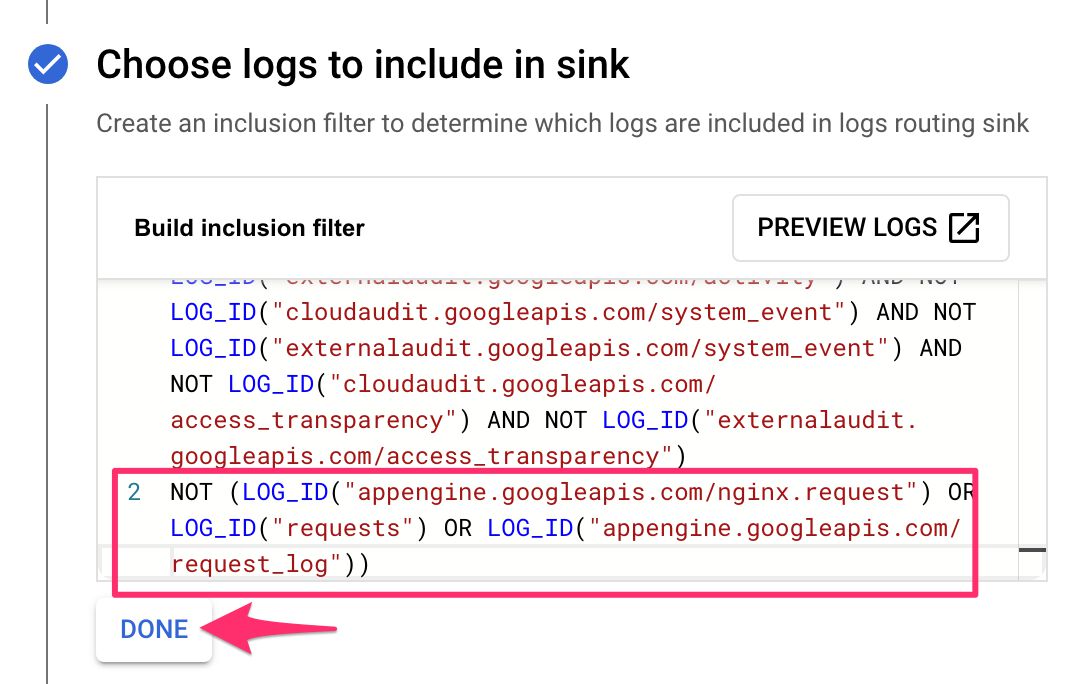
Then click DONE and finally the UPDATE SINK button at the bottom of the view.
The filter prevents the logs for the incoming requests from being stored in your log storage.
Tip #2: Suppress all request logging except errors
If you want the logs to still be moderately useful while cutting down on the costs, you can reach an easy compromise: suppress all the request logs except for the errors. This way you can still use the logs for detecting what types of errors the endpoint is throwing while still saving a penny or two by not logging everything.
To do this, follow the steps in the previous tip to open the Build inclusion filter area for editing. Instead of the filter expression detailed in the previous tip, add the following to a new row:
NOT ((LOG_ID("appengine.googleapis.com/nginx.request") OR LOG_ID("requests") OR LOG_ID("appengine.googleapis.com/request_log")) AND httpRequest.status < 400)
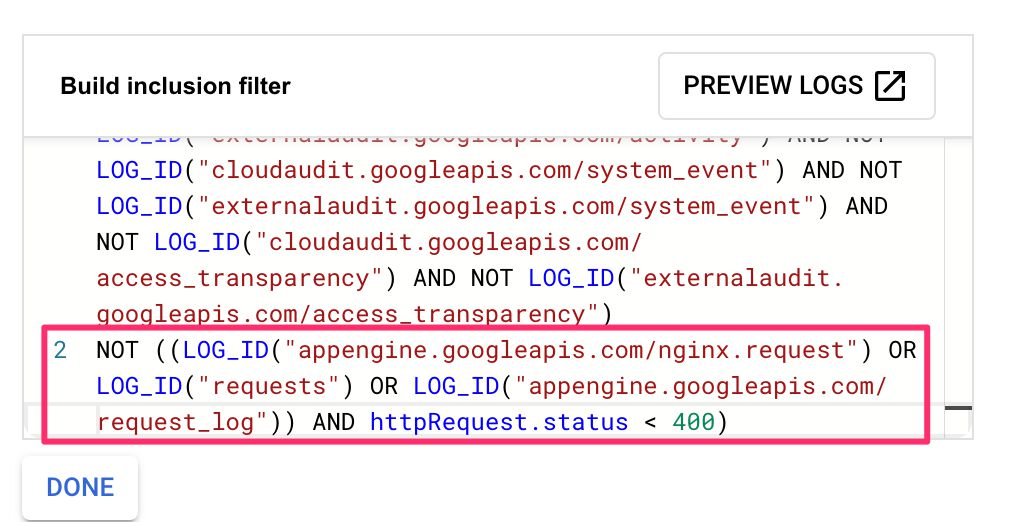
Click DONE and then UPDATE SINK.
Now your requests will not be logged unless they returned an HTTP status code of 400 or greater.
Note! It might take a while for the new filter to start working, so don’t be surprised if you keep seeing log entries for the requests for the next minute or so.
Tip #3: Find console logs from your production traffic
When in Preview mode, you can easily find the log output from the templates in your container by looking at the Console tab.
But where can you view logs for hits that are not available in preview mode?
You’ll need to run a query in your project’s Logs Explorer.
In the Query preview field, add the following query:
logName =~ "stdout"
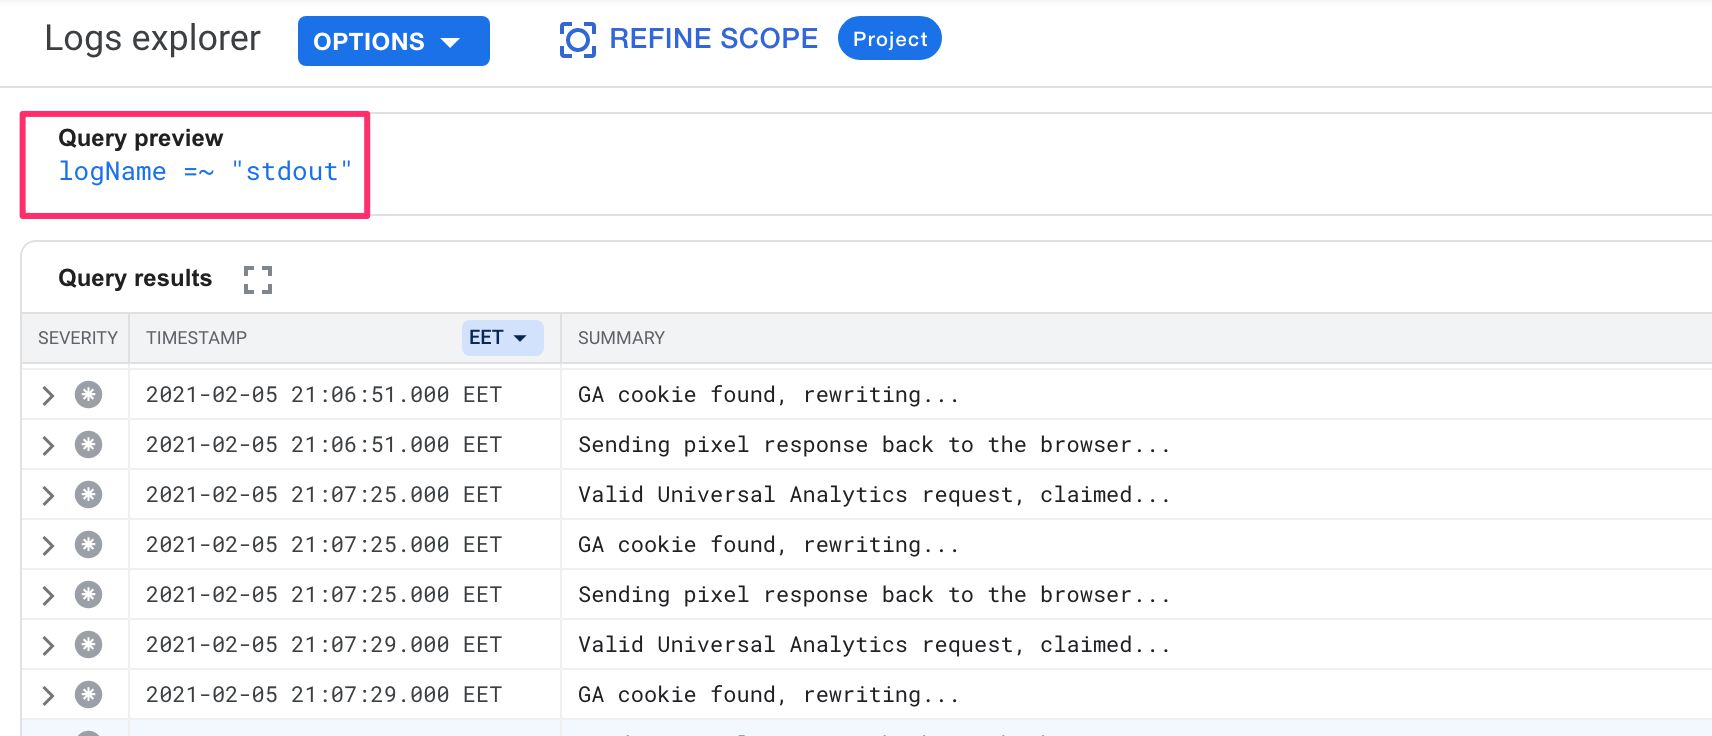
The template logs are written into a log with the ID stdout (short for standard output). If your templates utilize the logToConsole API, the messages logged with the API will appear with this query (even those logged in Preview mode).
Summary
I hope these quick tips have been useful!
If tinkering with the server-side environment is something you’re interested in doing more, I recommend enrolling in the Server-side Tagging In Google Tag Manager course on Simmer. Enrollment is open until March 14th, 2021 (course materials become available on March 1st), and there’s a lot of useful lessons in addition to logging tips in the course curriculum!
Logging can be one of the largest costs in a server-side tagging project, but correctly used it can also give you a lot of insight into how your endpoint works and how your tags and Clients perform.