Snowplow: Full Setup With Google Analytics Tracking
A recent guide of mine introduced the Google Analytics adapter in Snowplow. The idea was that you can duplicate the Google Analytics requests sent via Google Tag Manager and dispatch them to your Snowplow analytics pipeline, too. The pipeline then takes care of these duplicated requests, using the new adapter to automatically align the hits with their corresponding data tables, ready for data modeling and analysis.
While testing the new adapter, I implemented a Snowplow pipeline from scratch for parsing data from my own website. This was the first time I’d done the whole process from end-to-end myself, so I thought it might be prudent to document the process for the benefit of others who might want to take a jab at Snowplow but are intimidated by the moving parts.
And make no mistake. There are plenty of moving parts. Snowplow leverages a number of Amazon Web Services components, in addition to a whole host of utilities of its own. It’s not like setting up Google Analytics, which is, at its most basic, a fairly rudimentary plug-and-play affair.
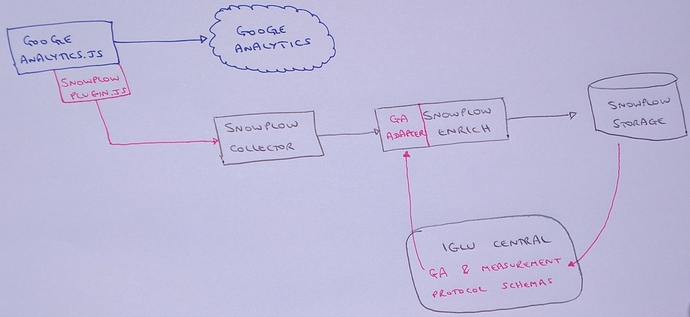 Image source: https://goo.gl/D2f3xi
Take this article with a grain of salt. It definitely does not describe the most efficient or cost-effective way to do things, but it should help you get started with Snowplow, ending up with a data store full of usable data for modeling and analysis. As such, it’s not necessarily a guide rather than a description of the steps I took, in good and bad.
WARNING: If you DO follow this guide step-by-step (which makes me very happy), please do note that there will be costs involved. For example, my current, very light-weight setup, is costing me a couple of dollars a day to maintain, with most costs incurred by running the collector on a virtual machine in Amazon’s cloud. Just keep this in mind when working with AWS. It’s unlikely to be totally free, even if you have the free tier for your account.
Table of Contents
The Simmer Newsletter
Subscribe to the Simmer newsletter to get the latest news and content from Simo Ahava into your email inbox!
To start with
I ended up needing the following things to make the pipeline work:
The Linux/Unix command line (handily accessible via the Terminal application of Mac OS X).
Git client - not strictly necessary but it makes life easier to clone the Snowplow repo and work with it locally.
A new Amazon Web Services account with the introductory free tier (first 12 months).
A credit card - even with the free tier the pipeline is not free.
A domain name of my own (I used gtmtools.com) whose DNS records I can modify.
A Google Analytics tag running through Google Tag Manager.
A lot of time.
The bullets concerning money and custom domain name might be a turn-off to some.
You might be able to set up the pipeline without a domain name by using some combination of Amazon CloudFront and Route 53 with Amazon’s own SSL certificates, but I didn’t explore this option.
And yes, this whole thing is going to cost money. As I wrote in the beginning, I didn’t follow the most cost-effective path. But even if I did, it would still cost a dollar or something per day to keep this up and running. If this is enough of a red flag for you, then take a look at what managed solutions Snowplow is offering. This article is for the engineers out there who want to try building the whole thing from scratch.
Why Snowplow?
Why do this exercise at all? Why even look towards Snowplow? The transition from the pre-built, top-down world of Google Analytics to the anarchy represented by Snowplow’s agnostic approach to data processing can be daunting.
Let me be frank: Snowplow is not for everyone. Even though the company itself offers managed solutions, making it as turnkey as it can get, it’s still you building an analytics pipeline to suit your organization’s needs. This involves asking very difficult questions, such as:
What is an “event”?
What constitutes a “session”?
Who owns the data?
What’s the ROI of data analytics?
How should conversions be attributed?
How should I measure users across domains and devices?
If you’ve never asked one of these (or similar) questions before, you might not want to look at Snowplow or any other custom-built setup yet. These are questions that inevitably surface at some point when using tools that give you very few configuration options.
At this point I think I should add a disclaimer. This article is not Google Analytics versus Snowplow. There’s no reason to bring one down to highlight the benefits of the other. Both GA and Snowplow have their place in the world of analytics, and having one is not predicated on the absence of the other.
The whole idea behind the Google Analytics plugin, for example, is that you can duplicate tracking to both GA and to Snowplow. You might want to reserve GA tracking for marketing and advertising attribution, as Google’s backend integrations are still unmatched by other platforms. You can then run Snowplow to collect this same data so that you’ll have access to an unsampled, raw, relational database you can use to enrich and join with your other data sets.
Snowplow is NOT a Google Analytics killer. They’re more like cousins fighting together for the honor of the same family line, but occasionally quarreling over the inheritance of a common, recently deceased relative.
What we are going to build
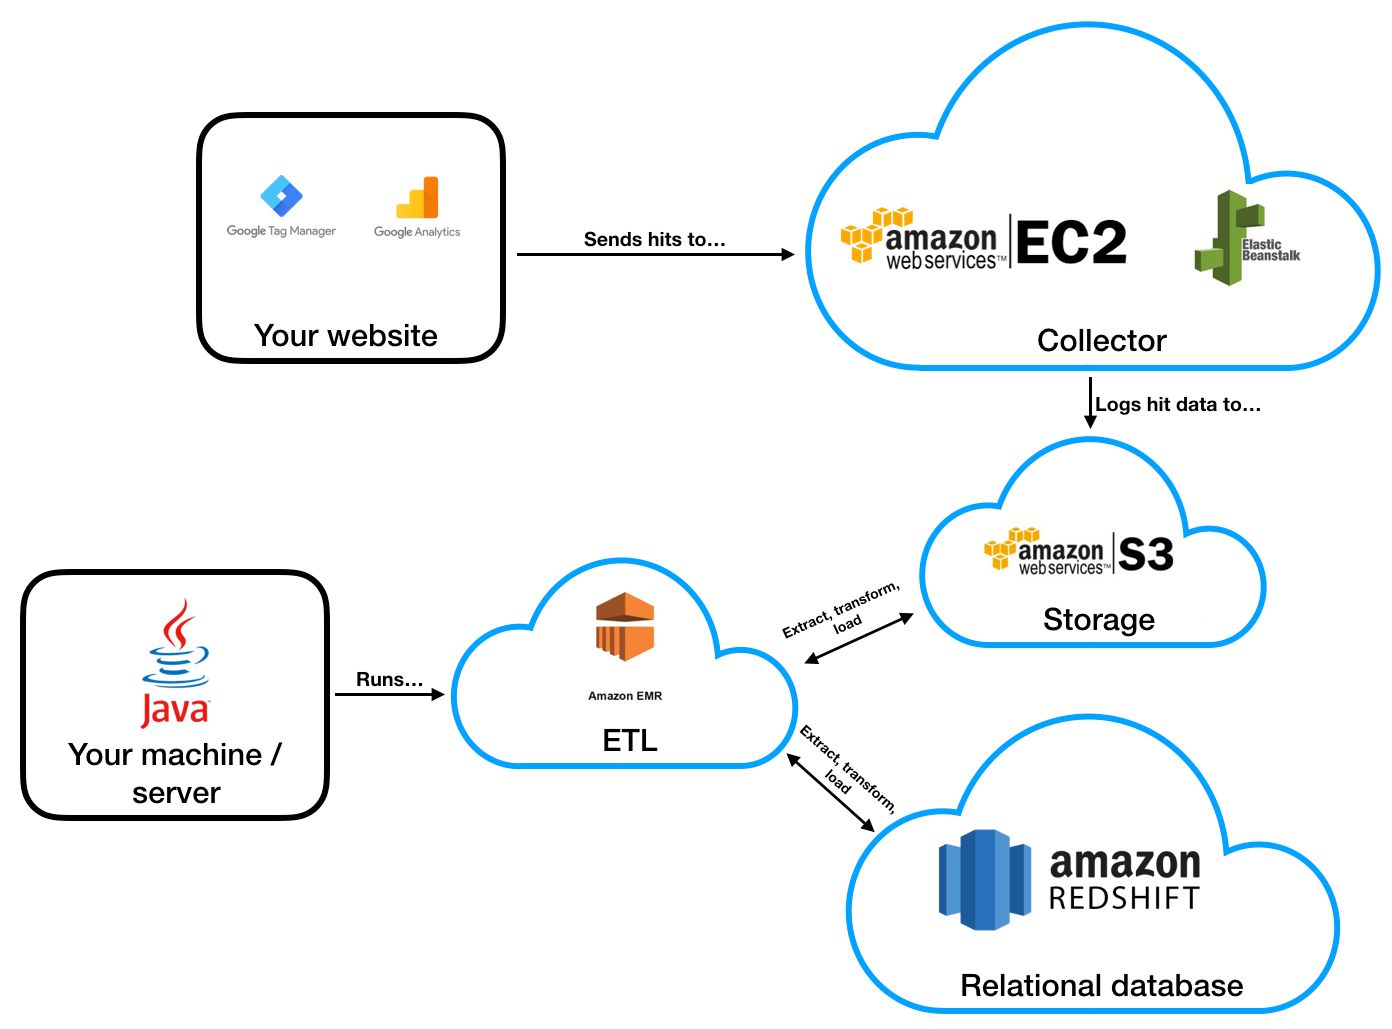
Here’s a diagram of what we’re hopefully going to build in this article:
I wonder why no one’s hired me as a designer yet…
The process will cover the following steps.
The website will duplicate the payloads sent to Google Analytics, and send them to a collector written with Clojure.
The collector runs as a web service on AWS Elastic Beanstalk, to which traffic is routed and secured with SSL from my custom domain name using AWS Route 53.
The log data from the collector is stored in AWS S3.
A utility is periodically executed on my local machine, which runs an ETL (extract, transform, load) process using AWS EMR to enrich and “shred” the data in S3.
The same utility finally stores the processed data files into relational tables in AWS Redshift.
So the process ends with a relational database that has all your collected data populated periodically.
Step 0: Register on AWS and setup IAM roles
What you need for this step
- You’ll just need a credit card to register on AWS. You’ll get the benefits of a free tier, but you’ll still need to enable billing.
Register on AMR
The very first thing to do is register on Amazon Web Services and setup an IAM (Identity and Access Management) User that will run the whole setup.
So browse to https://aws.amazon.com/, and select the option to create a free account.

The free account gives you access to the free tier of services, some of which will help keep costs down for this pipeline, too.
Create an Identity and Account Management (IAM) user
Once you’ve created the account, you can do the first important thing in setting up the pipeline: create an IAM User. We’ll be following Snowplow’s own excellent IAM setup guide for these steps.
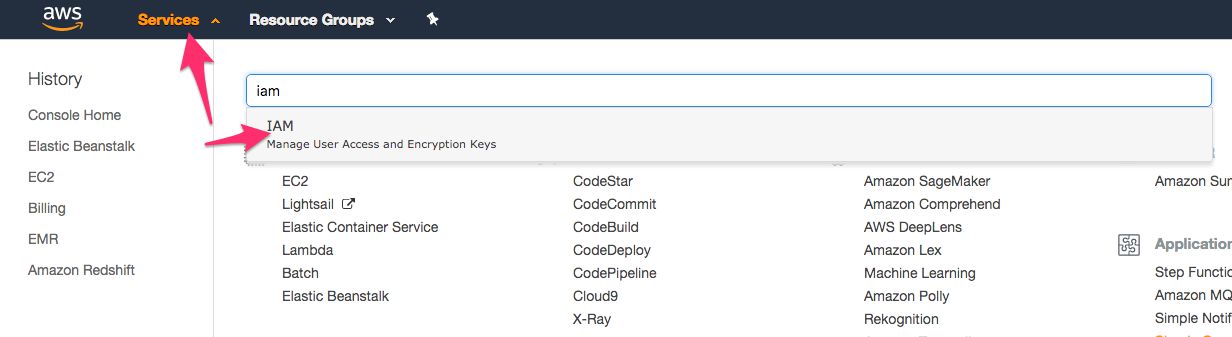
In the Services menu, select IAM from the long list of items.
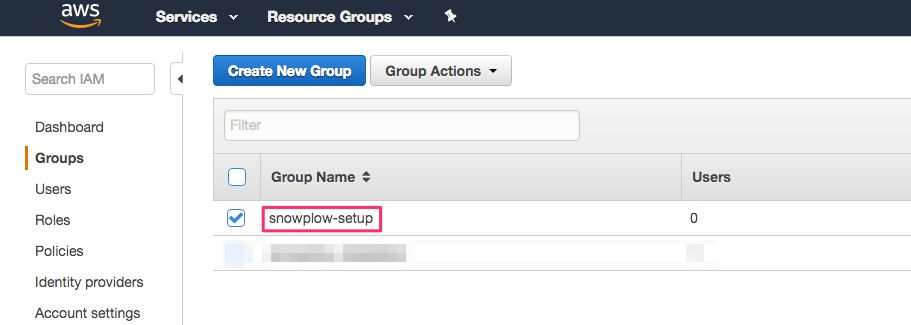
In the left-hand menu, select Groups.
Click the Create New Group in the view that opens.
Name the group
snowplow-setup.Skip the Attach Policy step for now by clicking the Next Step button.
Click Create Group.
Now in the left-hand menu, select Policies.
Click Create Policy.
Select the JSON tab, and replace the contents with the following:
{
  "Version": "2012-10-17",
  "Statement": [
    {
      "Effect": "Allow",
      "Action": [
        "acm:*",
        "autoscaling:*",
        "aws-marketplace:ViewSubscriptions",
        "aws-marketplace:Subscribe",
        "aws-marketplace:Unsubscribe",
        "cloudformation:*",
        "cloudfront:*",
        "cloudwatch:*",
        "ec2:*",
        "elasticbeanstalk:*",
        "elasticloadbalancing:*",
        "elasticmapreduce:*",
        "es:*",
        "iam:*",
        "rds:*",
        "redshift:*",
        "s3:*",
        "sns:*"
      ],
      "Resource": "*"
    }
  ]
}
Next, click Review Policy.
Name the policy
snowplow-setup-policy-infrastructure.Finally, click Create Policy.
Now go back to Groups from the left-hand menu, and click the snowplow-setup group name to open its settings.
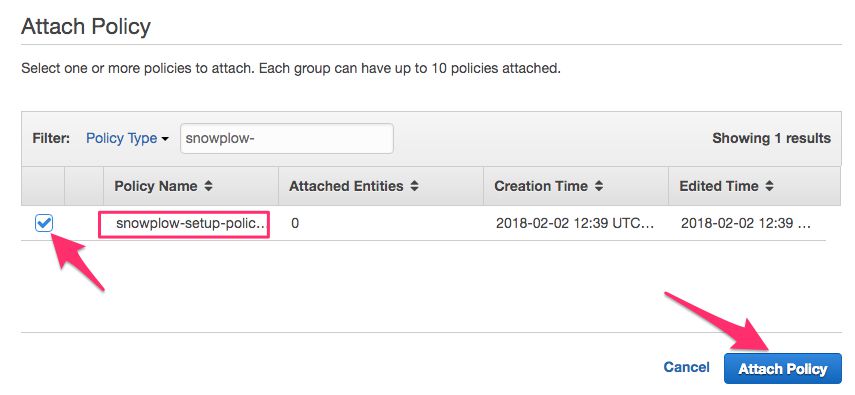
Switch to the Permissions tab and click Attach Policy.
From the list that opens, select snowplow-setup-policy-infrastructure and click Attach Policy.
Now select Users from the left-hand menu, and click the Add user button.
Name the user
snowplow-setup.Check the box next to Programmatic access.
Click Next: Permissions.
With Add user to group selected, check the box next to snowplow-setup, and click the Next: Review button at the bottom of the page.
Finally, click Create user.
The following screen will show you a success message, and your user with an Access Key ID and Secret Access Key (click Show to see it) available. At this point, copy both of these somewhere safe. You will need them soon, and once you leave this screen you will not be able to see the secret key anymore. You can also download them as a CSV file by clicking the Download .csv button.
You have now created a user with which you will set up your entire pipeline. Once everything is set up, you will create a new user with fewer permissions, who will take care of running and managing the pipeline.
Congratulations, step 0 complete!
What you should have after this step
You should have successfully registered a new account on AWS.
You should have a new IAM user named
snowplow-setupwith all the access privileges distributed by the custom policy you created.
Step 1: The Clojure collector
What you need for this step
- A custom domain name and access to its DNS configuration
Getting started
This is going to be one of the more difficult steps to do, since there’s no generic guide for some of the things that need to be done with the collector endpoint. If you want, you can look into the CloudFront Collector instead, because that runs directly on top of S3 without needing a web service to collect the hits. However, it doesn’t support the Google Analytics hit duplicator, which is why in this article we’ll use the Clojure collector.
The Clojure collector is basically a web endpoint to which you will log the requests from your site. The endpoint is a scalable web service running on Apache Tomcat, which is hosted on AWS’ Elastic Beanstalk. The collector has been configured to automatically log the Tomcat access logs directly into AWS S3 storage, meaning whenever your site sends a request to the collector, it logs this request as an access log entry, ready for the ETL process that comes soon after.
But let’s not get ahead of ourselves.
Setting up the Clojure collector
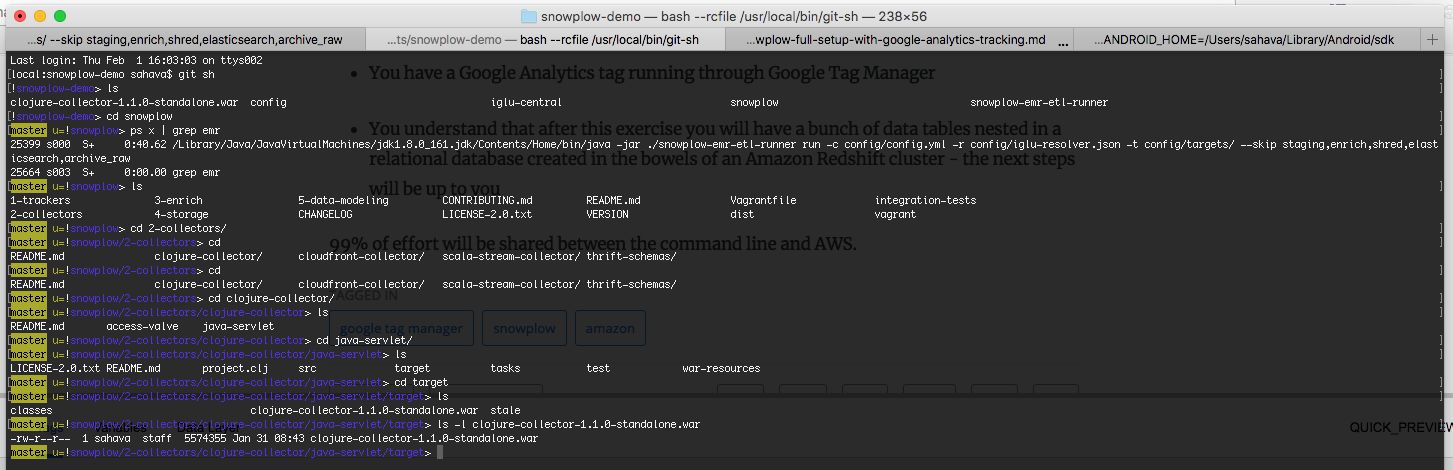
The first thing you’ll need to do is download the Clojure collector WAR file and store it locally in a temporary location (such as your Downloads folder).
You can download the binary by following this link. It should lead you to a file that looks something like clojure-collector-1.X.X-standalone.war.
Once you’ve downloaded it, you can set up the Elastic Beanstalk application.
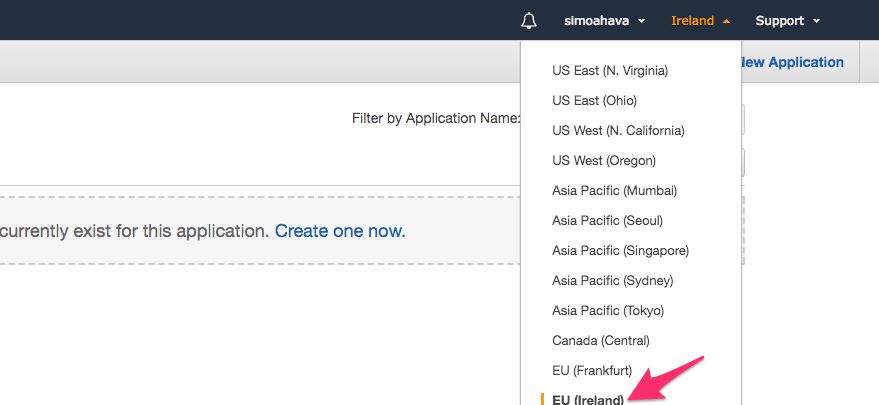
In AWS, open the Services menu again, and select Elastic Beanstalk.
At this point, you’ll also want to make sure that any AWS services you use in this pipeline are located in the same region. There are differences to what services are supported in each region. I built the pipeline in EU (Ireland), and the Snowplow guide itself uses US West (Oregon). Click the region menu and choose the region you want to use.
Next, click the Create New Application link in the top-right corner of the page (just below the region selector).
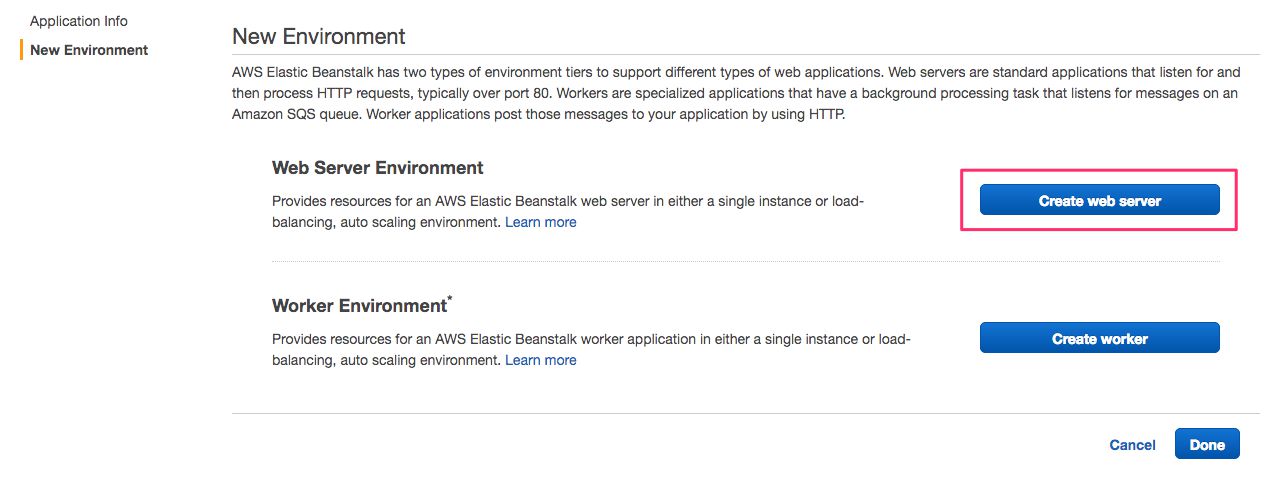
Give the application a descriptive name (e.g.
Snowplow Clojure Collector) and description (e.g.I love Kamaka HF-3), and then click Next.In the New Environment view, select Create web server.
- In the Environment Type view, set the following:
Predefined configuration: Tomcat
Environment type: Single instance
Then, click Next.
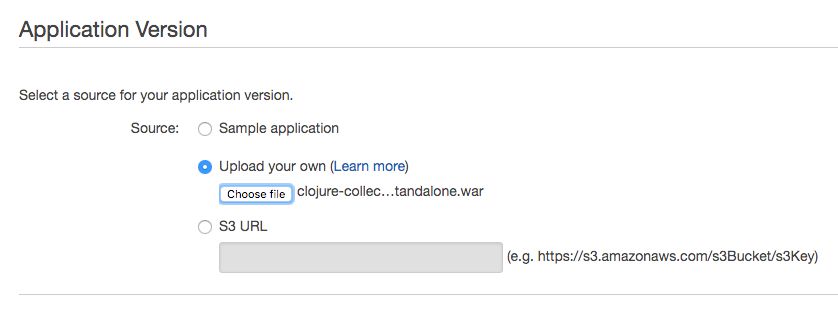
In the Application Version view, select Upload your own, click Choose file, and find the WAR file you downloaded earlier in this chapter. Click Next to upload the file.
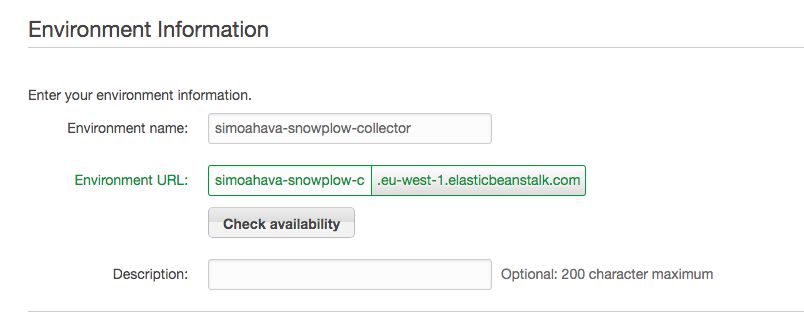
In the Environment Info view, you’ll need to set the Environment name, which is then used to generate the Environment URL (which, in turn, will be the endpoint URL receiving the collector requests).
Remember to click Check availability for the URL to make sure someone hasn’t grabbed it yet. Click Next once you’re done.
In Additional Resources, you can leave both options unchecked for now, and click Next.
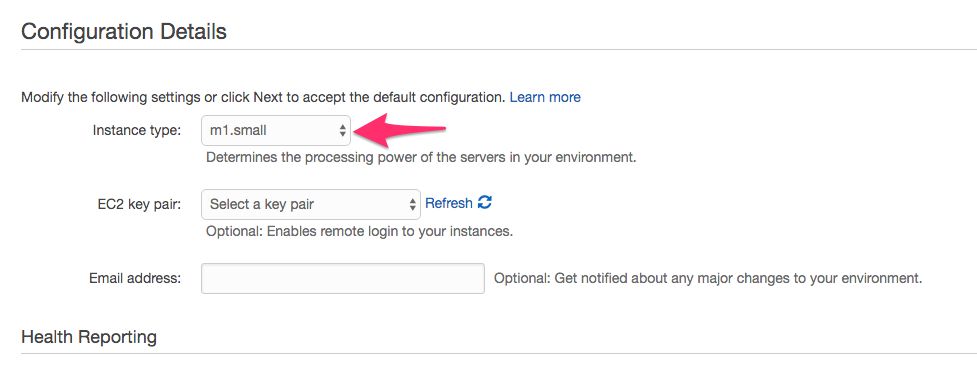
In Configuration Details, select m1.small as the instance type. You can leave all the other options to their default settings. Click Next.
No need to add any Environment Tags, so click Next again.
In the Permissions view, by clicking Next, AWS assigns default roles to Instance profile and Service role, so that’s fine.
Finally, you can take a quick look at what you’ve done in the Review view, before clicking the Launch button.
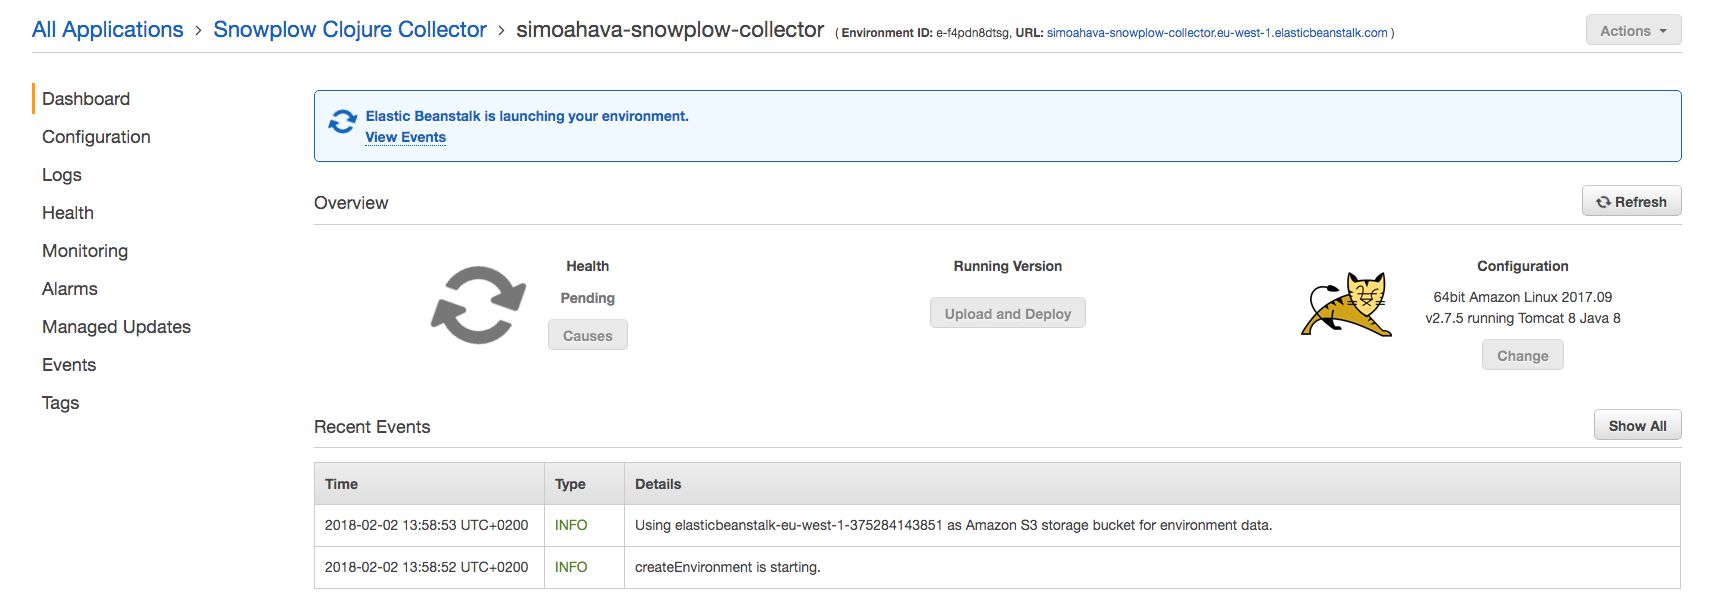
At this point, you’ll see that AWS is firing up your environment, where the Clojure collector WAR file will start running the instant the environment has been created.
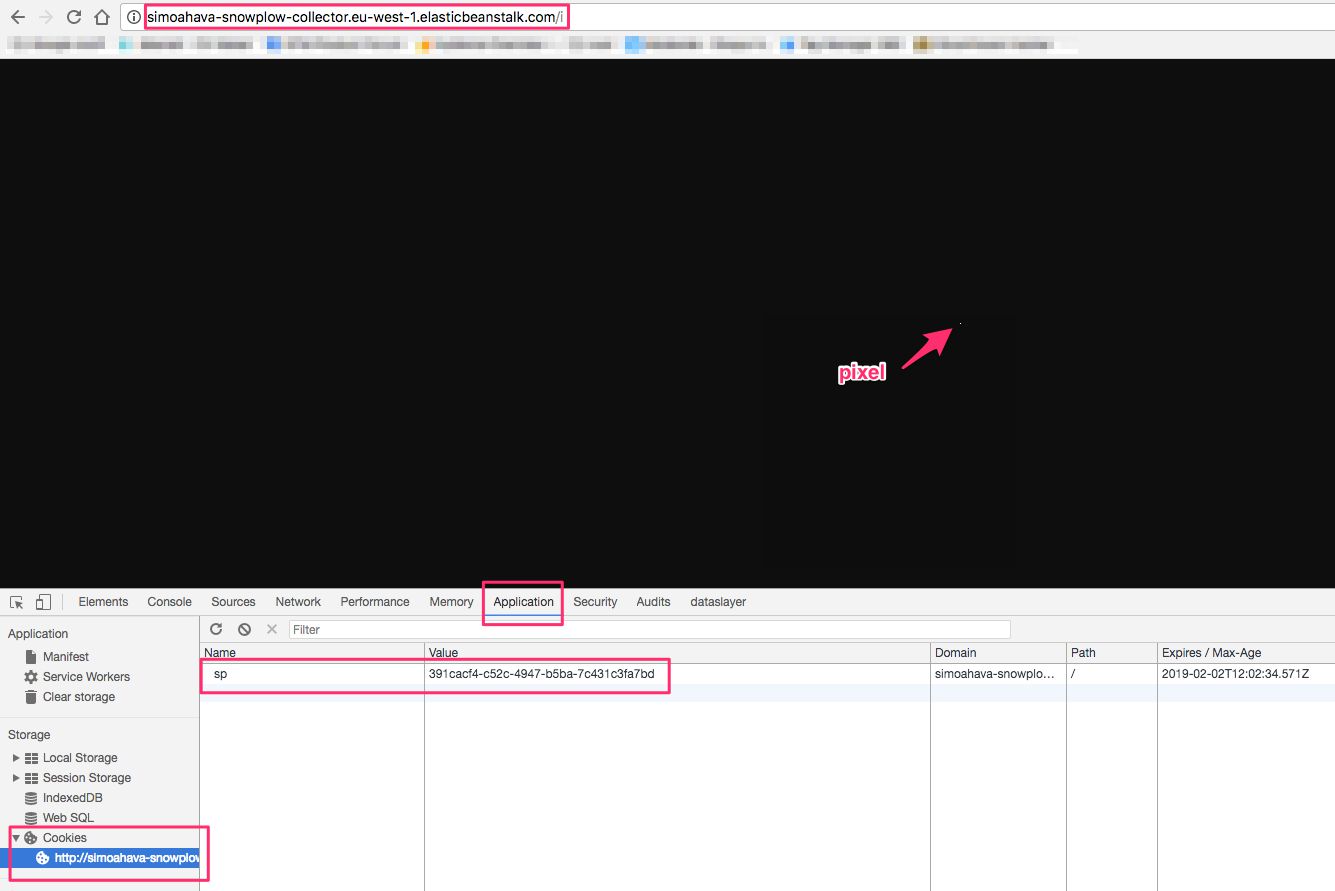
Once the environment is up and running, you can copy the URL from the top of the view, paste it into the address bar of your browser, and add the path /i to its end, so it ends up something like:
http://simoahava-snowplow-collector.eu-west-1.elasticbeanstalk.com/i
If the collector is running correctly, you should see a pixel in the center of the screen. By clicking the right mouse button and choosing Inspect (in the Google Chrome browser), you should now find a cookie named sp in the Applications tab. If you do, it means the collector is working correctly.
Congratulations! You’ve set up the collector.
However, we’re not done here yet.
Enable logging to S3
Automatically logging the Tomcat access logs to S3 storage is absolutely crucial for this whole pipeline. The batch process looks for these logs when sorting out the data into queriable chunks. Access logs are your typical web server logs, detailing all the HTTP requests made to the endpoint, with request headers and payloads included.
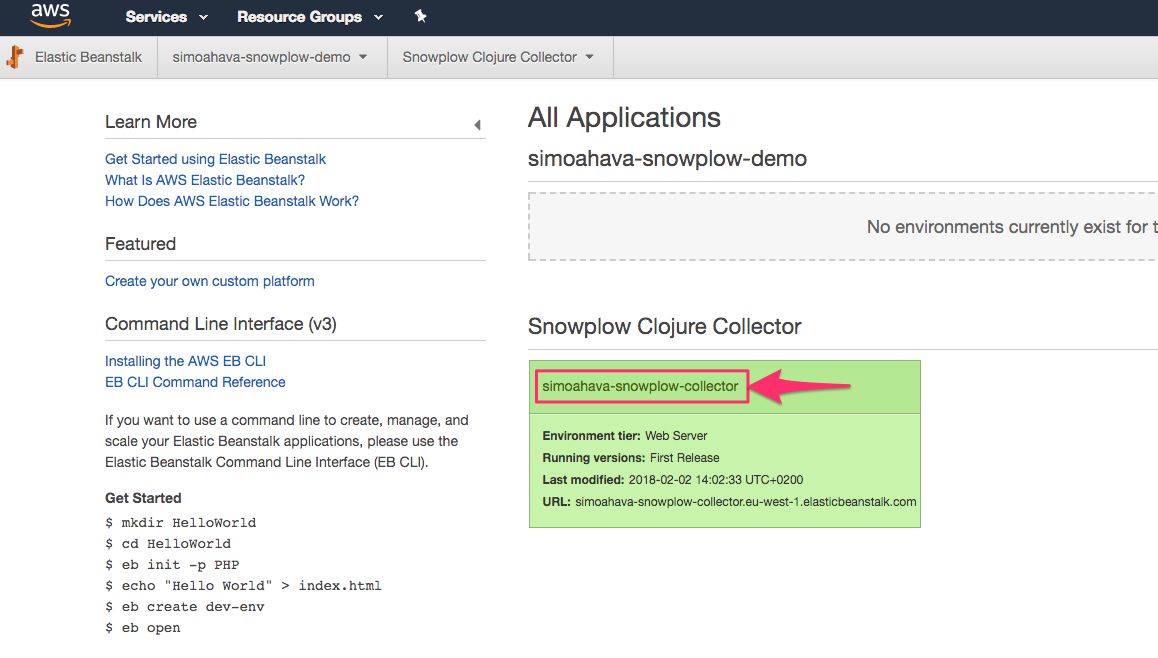
To enable logging, you’ll need to edit the Elastic Beanstalk application you just created. So, once the endpoint is up and running, you can open it by clicking the application name while in the Elastic Beanstalk service front page.
Next, select Configuration from the left-hand menu.
Click the cogwheel in the box titled Software Configuration.
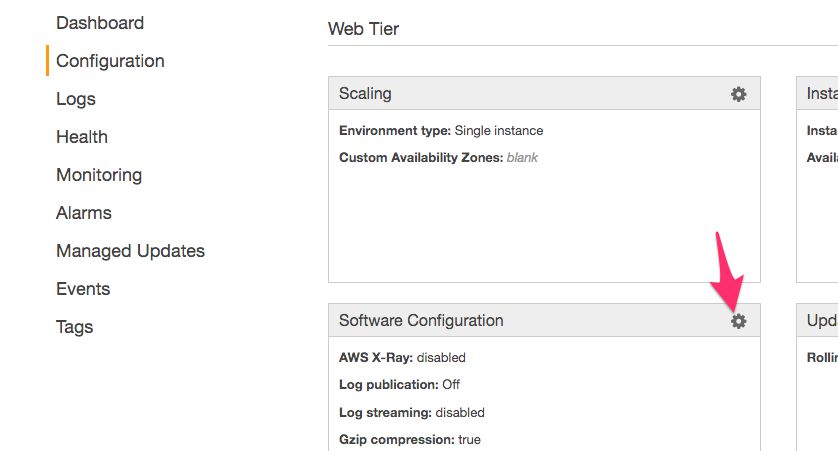
- Under Log Options, check the box next to Enable log file rotation to Amazon S3. If checked, service logs are published to S3.
This is a crucial step, because it will store all the access logs from your endpoint requests to S3, ready for ETL.
Click Apply to apply the change.
Set up the load balancer
Next, we need to configure the Elastic Beanstalk environment for SSL.
Before you do anything else, you’ll need to switch from a single instance to a load-balancing, auto-scaling environment in Elastic Beanstalk. This is necessary for securing the traffic between your domain name and the Clojure collector.
In the AWS Services menu, select Elastic Beanstalk, and then click your application name in the view that opens.
In the next view, select Configuration in the left-hand menu.
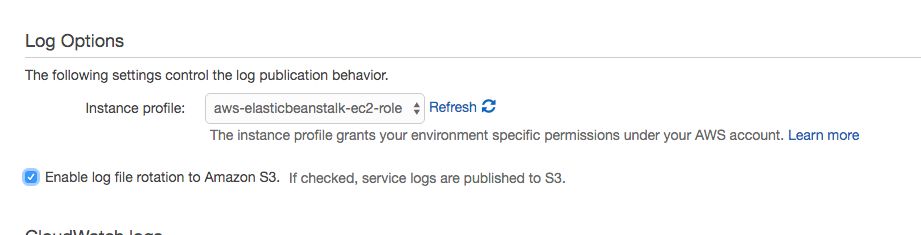
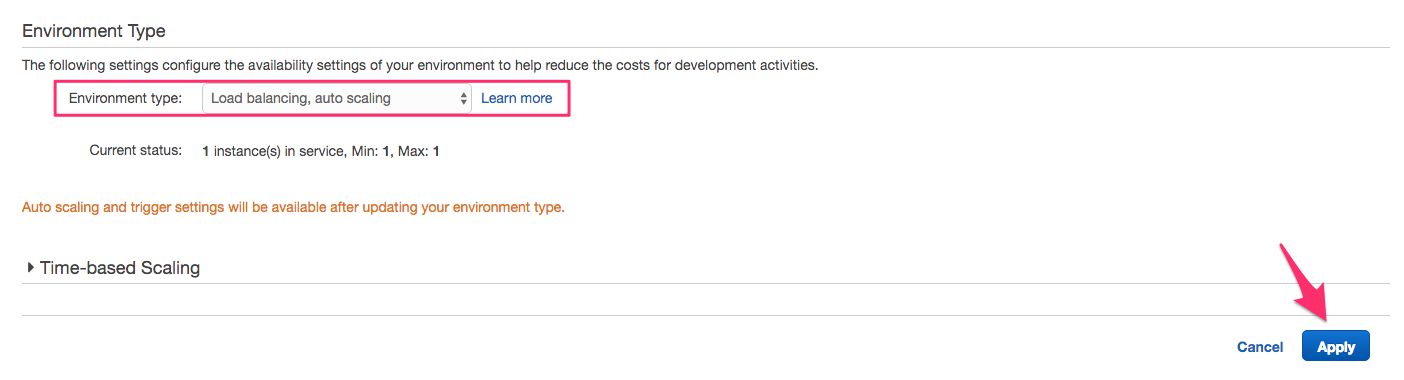
Click the cogwheel in the box titled Scaling.
From the Environment type menu, select Load balancing, auto scaling, and then click the Apply button, and Save in the next view.
You now have set up the load balancer.
Route traffic from your custom domain name to the load balancer
Next, we’ll get started on routing traffic from your custom domain name to this load balancer.
Open the Services menu in the AWS console, and select Route 53 from the list.
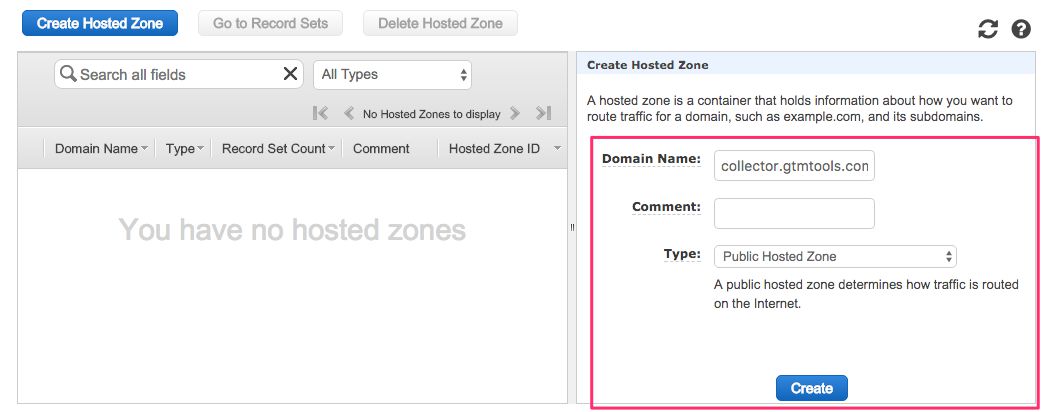
In the view that opens, click Create Hosted Zone.
Set the Domain Name to the domain whose DNS records you want to delegate to Amazon. I chose collector.gtmtools.com. Leave Type as Public Hosted Zone, and click Create.
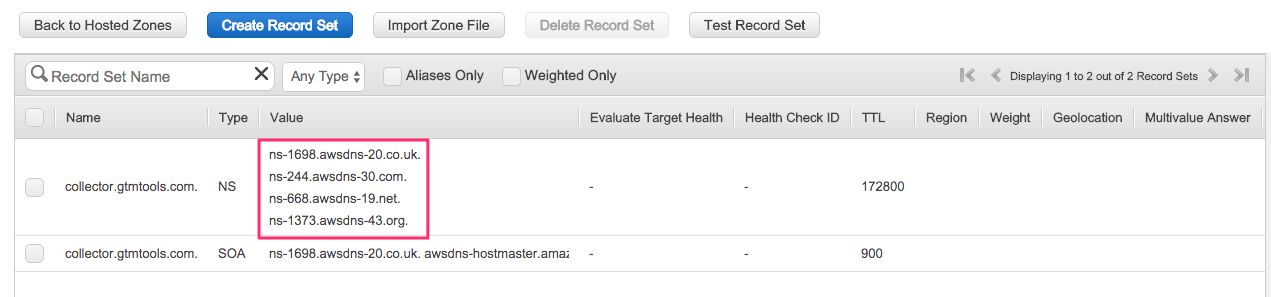
- In the view that opens, you’ll see the settings for your Hosted Zone. Make note of the four NS records AWS has assigned to your domain name. You’ll need these in the next step.
Next, you’ll need to go wherever it is you manage your DNS records. I use GoDaddy.
You need to add the four NS addresses in the AWS Hosted Zone as NS records in the DNS settings of your domain name. This is what the modifications would look like in my GoDaddy control panel:
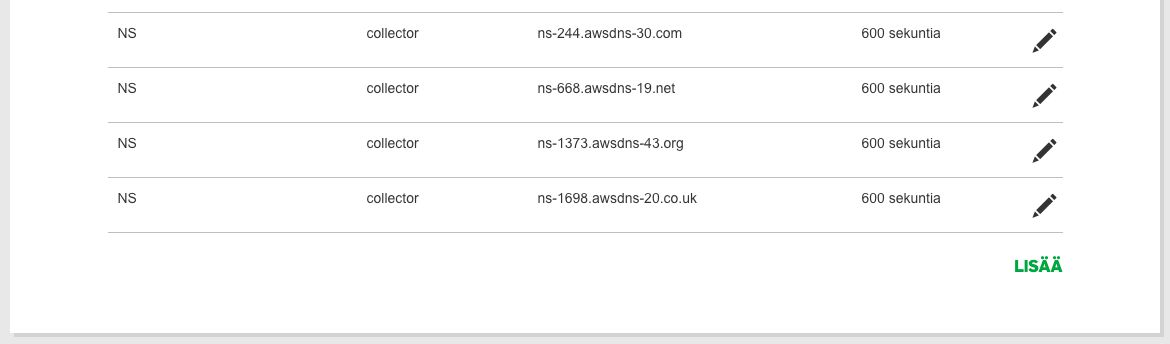
As you can see, there are four NS records with host collector (for collector.gtmtools.com), each pointing to one of the four corresponding NS addresses in the AWS Hosted Zone. I set the TTL to the shortest possible GoDaddy allows, which is 600 seconds. That means that within 10 minutes, the Hosted Zone name servers should respond to collector.gtmtools.com.
You can test this with a service such as https://dig.whois.com.au/dig/, or any similar service that lets you check DNS records. Once the DNS settings are updated, you can increase the TTL to something more sensible, such as 1 hour, or even 1 day.
Now that you’ve set up your custom domain name to point to your Route 53 Hosted Zone, there’s just one step missing. You’ll need to create an Alias record in the Hosted Zone, which points to your load balancer. That way when typing the URL collector.gtmtools.com into the browser address bar, the DNS record first directs it to your Hosted Zone, where a new A record shuffles the traffic to your load balanced Clojure collector endpoint. Phew!
So, in the Hosted Zone you’ve created, click Create Record Set.
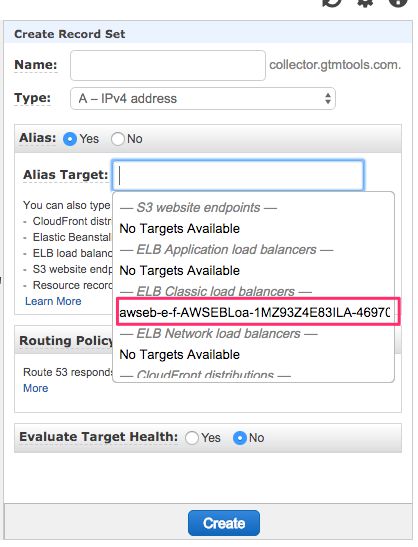
In the overlay that opens, leave the Name empty, since you want to apply the name to the root domain of the NS (collector.gtmtools.com in my case). Keep A - IPv4 address as the Type, and select Yes for Alias.
When you click the Target field, a drop-down list should appear, and your load balancer should be selectable under the ELB Classic load balancers heading. Select that, and then click Create.
Now if you visit http://collector.gtmtools.com/i, you should see the same pixel response as you got when visiting the Clojure collector endpoint directly. So your domain name routing works!
But we’re STILL not done here.
Setting up HTTPS for the collector
To make sure the collector is secured with HTTPS, you will need to generate a (free) AWS SSL certificate for it, and apply it to the Load Balancer. Luckily this is easy to do now that we’re working with Route 53.
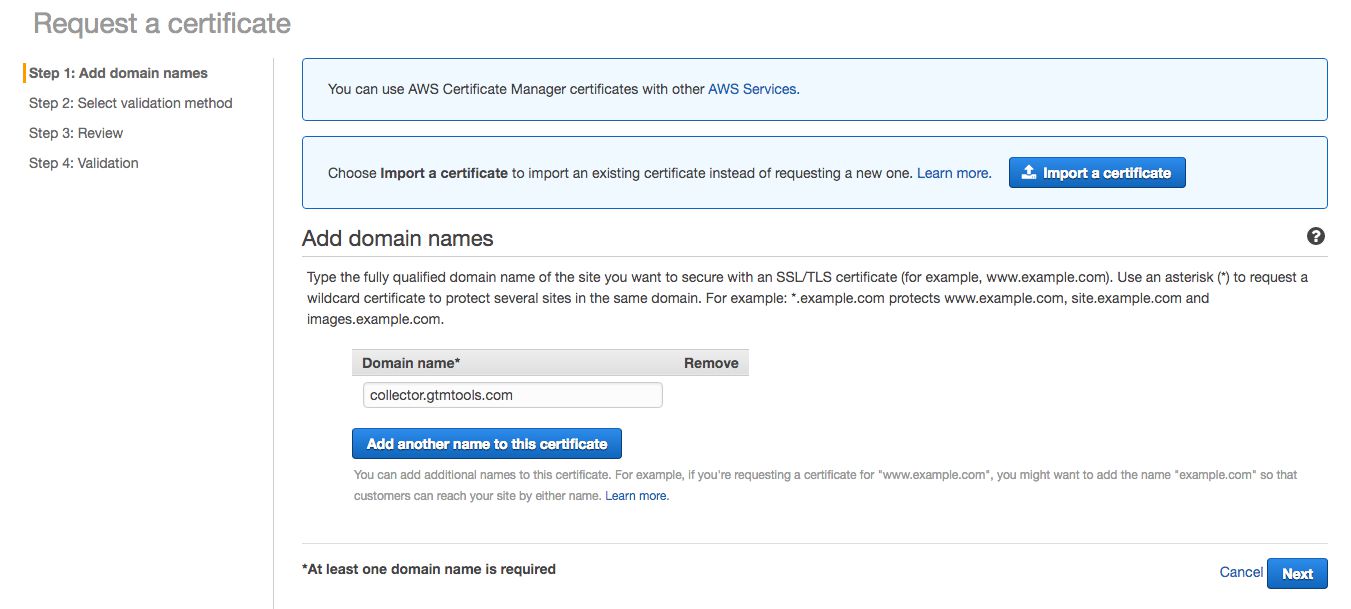
The first thing to do is generate the SSL certificate. In Services, find and select the AWS Certificate Manager. Click Get started to, well, get started.
Type the domain name you want to apply the certificate to in the relevant field. I wrote collector.gtmtools.com.
Click Next when ready.
In the next step you need to choose a validation method. Since we’ve delegated DNS of collector.gtmtools.com to Route 53, I chose DNS Validation without hesitation.
Then click Review, and then Confirm and request.
Validation is done in the next view. With Route 53, this is really easy. Just click Create record in Route 53, and Create in the overlay that opens. Amazon takes care of validation for you!
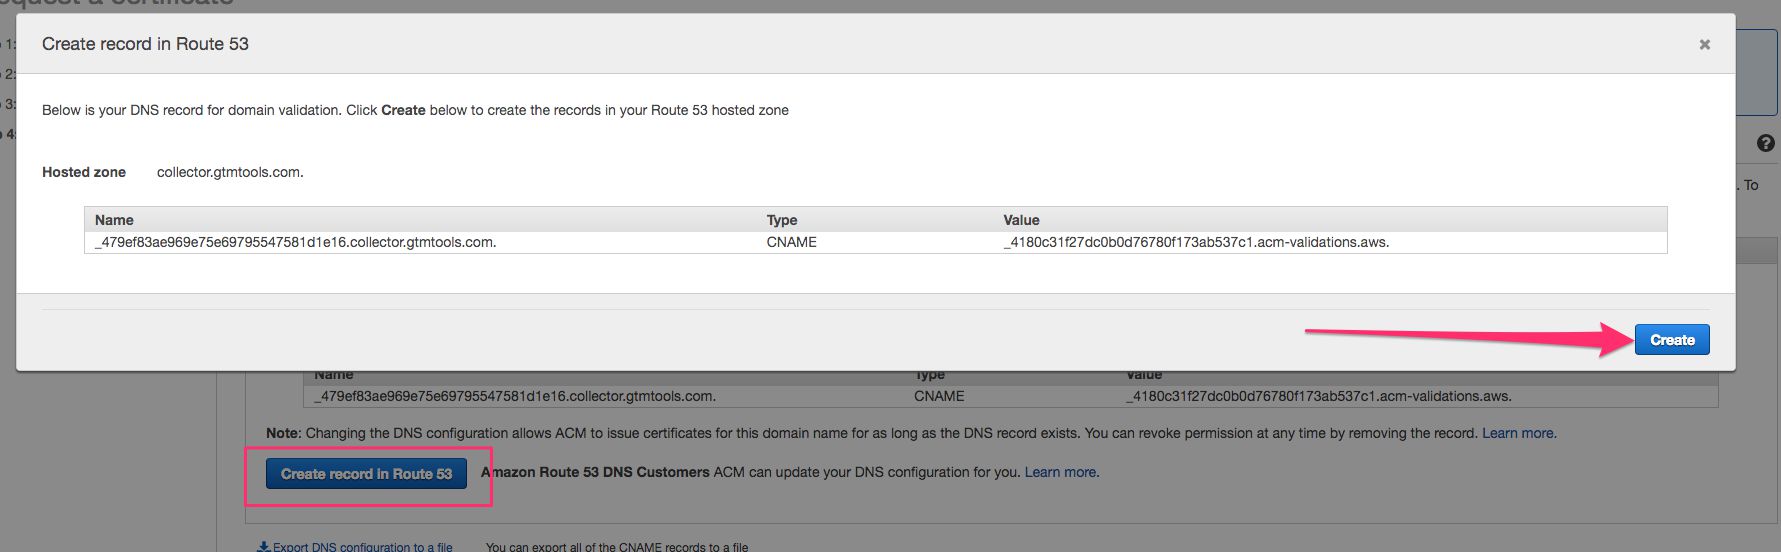
After clicking Create, you should see a Success message, and you can click the Continue button in the bottom of the screen. It might take up to 30 minutes for the certificate to validate, so go grab a cup of coffee or something! We still have one more step left…
Switch the load balancer to support HTTPS
You’ll still need to switch your load balancer to listen for secure requests, too.
In Services, open Elastic Beanstalk, click your application name in the view that opens, and finally click Configuration in the left-hand menu. You should be able to do this stuff in your sleep by now!
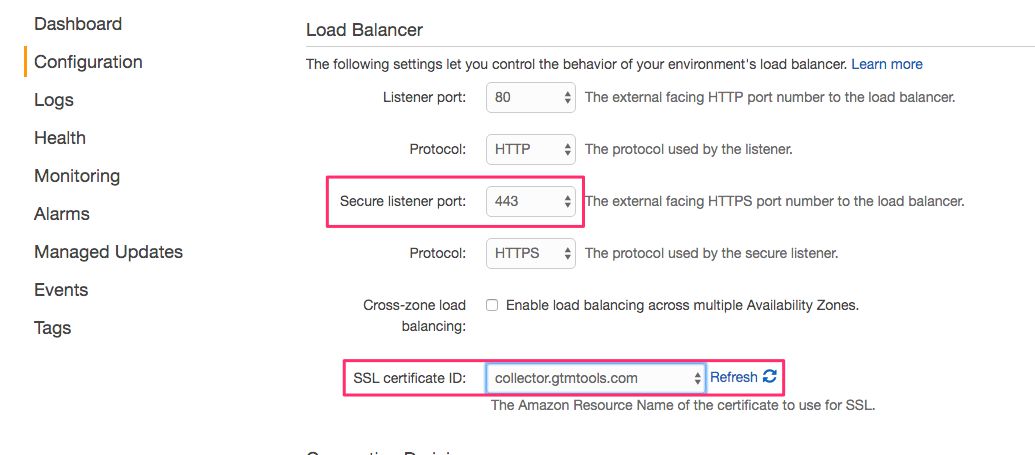
Next, scroll down to the box titled Load Balancing and click the cogwheel in it.
In the view that opens, set Secure listener port to 443, and select the SSL certificate you just generated from the menu next to SSL Certificate ID. Click Apply when ready.
All done!
At this point, you might also want to take a look at this Snowplow guide for configuring the collector further (e.g. applying proper scaling settings to the load balancer).
The process above might seem convoluted, but there’s a certain practical logic to it all. And once you have the whole pipeline up and running, it will be easier to understand how things proceed from the S3 storage onwards.
Setting up the custom domain name is a bit of chore, though. But if you use Route 53, most of the things are either automated for you or taken care of with the click of a button.
What you should have after this step
The Clojure collector application running in an Elastic Beanstalk environment.
Your own custom domain name pointing at the router configured in Amazon Route 53.
An SSL secured load balancer, to which Route 53 diverts traffic to your custom domain name.
Automatic logging of the collector Tomcat logs to S3. The bucket name is something like elasticbeanstalk-region-id, and you can find it by clicking Services in the AWS navigation and choosing S3. The logs are pushed hourly.
Step 2: The tracker
You’ll need to configure a tracker to collect data to the S3 storage.
This is really easy, since you’re of course using Google Analytics, and tracking data to it using Google Tag Manager tags.
Navigate to my recent guide on setting up the duplicator, do what it says, and you’ll be set. Remember to change the endpoint variable in the Custom JavaScript variable to the domain name you set up in the previous chapter (https://collector.gtmtools.com/ in my case).
Step 2.5: Test the tracker and collector
Once you’ve installed the GA duplicator, you can test to see if the logs are being stored in S3 properly.
If the duplicator is doing its job correctly, you can open the Network tab in your browser’s developer tools, and look for requests to your collector endpoint. You should see POST requests for each GA call, with the payload of the request in the POST body:
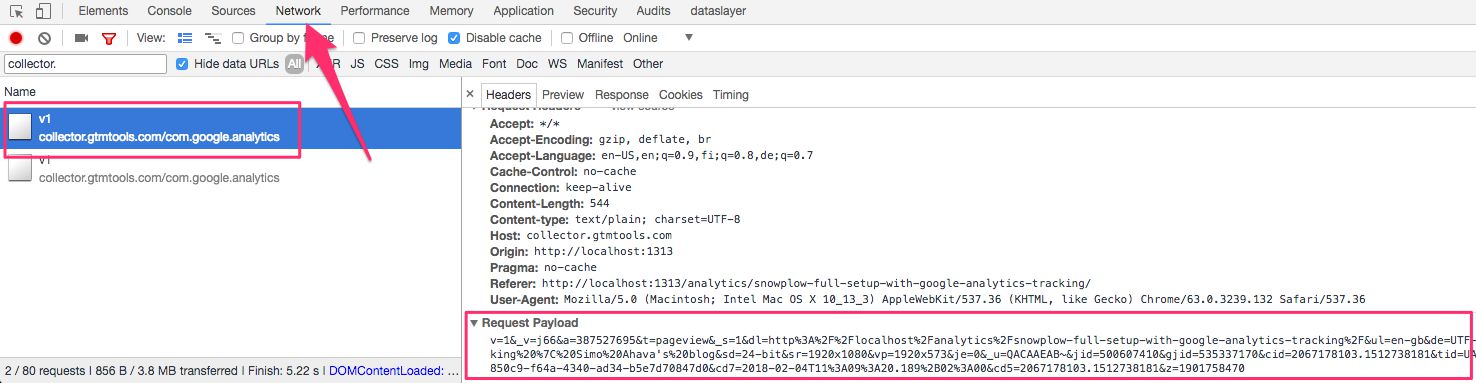
If you don’t see these requests, it means you’ve misconfigured the duplicator somehow, and you should re-read the instructions.
If you see the requests but there’s an error in the HTTP response, you’ll need to check the process outlined in the previous two chapters again.
At something like 10 minutes past each hour, the Clojure collector running in Elastic Beanstalk will dump all the Tomcat access logs to S3. You should check that they are being stored, because the whole batch process hinges on the presence of these logs.
In S3, there will be a bucket prefixed with elasticbeanstalk-region-id. Within that bucket, browse to folder resources / environments / logs / publish / (some ID) / (some ID). In other words, within the publish folder will be a folder named something like e-ab12cd23ef, and within that will be a folder named something like i-1234567890. Within that final folder will be all your logs in gzip format.
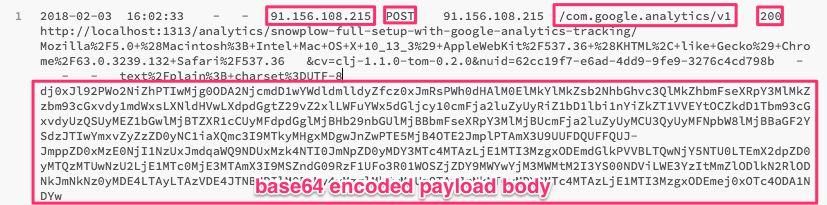
Look for the ones named _var_log_tomcat8_rotated_localhost_access_log.txt123456789.gz, as these are the logs that the ETL process will use to build the data tables.
If you open one of those logs, you should find a bunch of GET and POST entries. Look for POST entries where the endpoint is /com.google.analytics/v1, and the HTTP status code is 200. If you see these, it means that the Clojure collector is almost certainly doing its job. The entry will contain a bunch of interesting information, such as the IP address of the visitor, the User-Agent string of the browser, and a base64 encoded string with the payload. If you decode this string, you should see the full payload of your Google Analytics hit as a query string.
Step 3: Configure the ETL process
What you need for this step
A collector running and dumping the logs in an S3 bucket.
Access Key ID and Secret Access Key for the IAM user you created in Step 0.
Getting started
This step should be pretty straightforward, at least more so than the previous one.
The process does a number of things, and you’ll want to check out this page for more info.
But, in short, here are the main steps operated by the AWS Elastic MapReduce (EMR) service.
The Tomcat logs are cleaned up so that they can be parsed more easily. Irrelevant log entries are discarded.
Custom enrichments are applied to the data, if you so wish. Enrichments include things like geolocation from IP addresses, or adding weather information to the data set.
The enriched data is then shredded, or split into more atomic data sets, each corresponding with a hit that validates against a given schema. For example, if you are collecting data with the Google Analytics setup outlined in my guide, these hits would be automatically shredded into data sets for Page Views, Events, and other Google Analytics tables, ready for transportation to a relational database.
Finally, the data is copied from the shredded sets to a database created in Amazon Redshift.
We’ll go over these steps in detail next. It’s important to understand that each step of the ETL process leaves a trace in S3 buckets you’ll build along the way. This means that even if you choose to apply the current process to your raw logs, you can rerun your entire log history, if you’ve decided to keep the files, with new enrichments and shredding schemas later on. All the Tomcat logs are archived, too, so you’ll always be able to start the entire process from scratch, using all your historical data, if you wish!
The way we’ll work in this process is run a Java application name EmrEtlRunner from your local machine. This application initiates and runs the ETL process using Amazon’s Elastic MapReduce. At some point, you might want to upgrade your setup, and have EmrEtlRunner execute in an AWS EC2 instance (basically a virtual machine in Amazon’s cloud). That way you could schedule it to run, say, every 60 minutes, and then forget about it.
Download the necessary files
The ETL runner is a Unix application you can download from this link. To grab the latest version, look for the file that begins with snowplow_emr_rXX, where XX is the highest number you can find. At the time of writing, the latest binary is snowplow_emr_r97_knossos.zip.
Download this ZIP file, and copy the
snowplow-emr-etl-runnerUnix executable into a new folder on your hard drive. This folder will be your base of operations.At this point, you’ll want to also clone the Snowplow Github repo in that folder, because it has all the config file templates and SQL files you’ll need later on.
So browse to the directory to where you copied the
snowplow-emr-etl-runnerfile, and run the following command:
git clone https://github.com/snowplow/snowplow.gitIf you don’t have Git installed, now would be a good time to do it.
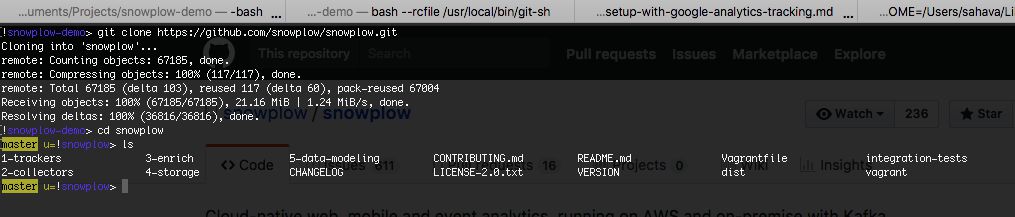
Now you should have both the
snowplow-emr-etl-runnerfile and the snowplow folder in the same directory.Next, create a new folder named
config, and in that, a new folder namedtargets.Then, perform the following copy operations:
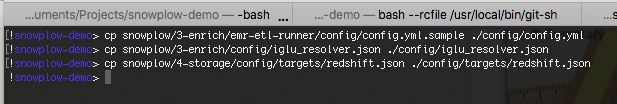
Copy
snowplow/3-enrich/emr-etl-runner/config/config.yml.sampletoconfig/config.yml.Copy
snowplow/3-enrich/config/iglu_resolver.jsontoconfig/iglu_resolver.json.Copy
snowplow/4-storage/config/targets/redshift.jsontoconfig/targets/redshift.json.
In the end, you should end up with a folder and file structure like this:
.
|-- snowplow-emr-etl-runner
|-- snowplow
|   |-- -SNOWPLOW GIT REPO HERE-
|-- config
|   |-- iglu_resolver.json
|   |-- config.yml
|   |-- targets
|       |-- redshift.json
Create an EC2 key pair
At this point, you’ll also need to create a private key pair in Amazon EC2. The ETL process will run on virtual machines in the Amazon cloud, and these machines are powered by Amazon EC2. For the runner to have full privileges to create and manage these machines, you will need to provide it with access control rights, and that’s what the key pair is for.
In AWS, select Services from the top navigation, and click on EC2. In the left-hand menu, browse down to Key Pairs, and click the link.
At this point, make sure you are in the Region where you’ll be running all the proceeding jobs. For consistency’s sake, it makes sense to stay in the same Region you’ve been in all along. Remember, you can choose the Region from the top navigation.
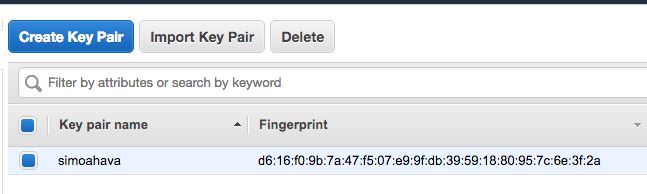
Once you’ve made sure you’re in the correct Region, click Create Key Pair.
Give the key pair a name you’ll remember. My key pair is named
simoahava.Once you’re done, you’ll see your new key pair in the list, and the browser automatically downloads the file
<key pair name>.pemto your computer.
Create the S3 buckets
At this time, you’ll need to create a bunch of buckets (storage locations) in Amazon S3. These will be used by the batch process to manage all your data files through various stages of the ETL process.
You will need buckets for the following:
:raw:in- you already have this, actually. It’s the elasticbeanstalk-region-id created by the Clojure collector running in Elastic Beanstalk.:processing- intermediate bucket for the log files before they are enriched.:archive- you’ll need three different archive buckets::raw(for the raw log files),:enriched(for the enriched files),:shredded(for the shredded files).:enriched- you’ll need two buckets for enriched data::good(for data sets successfully enriched),:bad(for those that failed enrich).:shredded- you’ll likewise need two buckets for shredded data::good(for data sets successfully shredded),:bad(for those that failed shredding).:log- a bucket for logs produced by the ETL process.
To create these buckets, head on over to S3 by clicking Services in the AWS top navigation, and choosing S3.
You should already have your :raw:in bucket here, it’s the one whose name starts with elasticbeanstalk-.
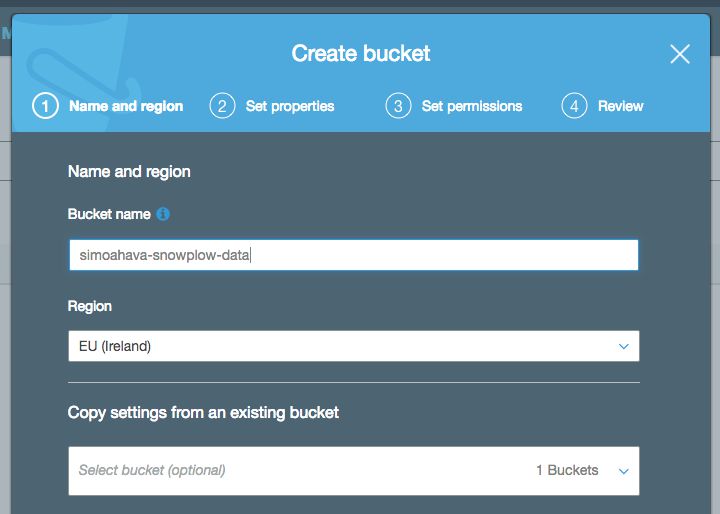
Let’s start with creating a new bucket that will contain all the “sub-buckets” for ETL.
Click +Create bucket, and name the bucket something like simoahava-snowplow-data. The bucket name must be unique across all of S3, so you can’t just name it snowplow. Click Next a couple of times and then finally Create bucket to create this root bucket.
Now click the new bucket name to open the bucket. You should see a screen like this:
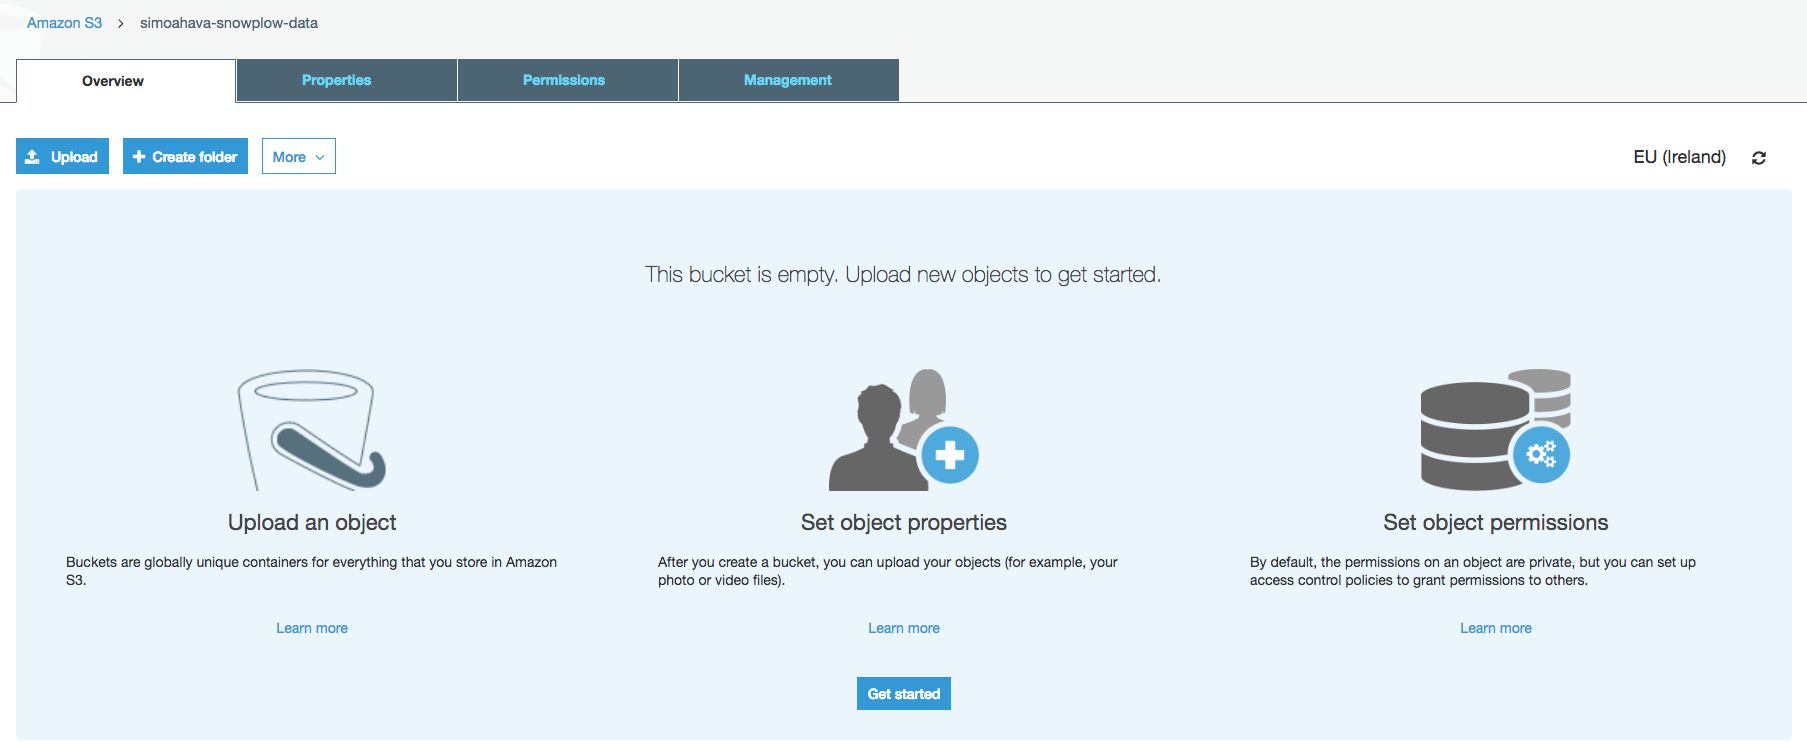
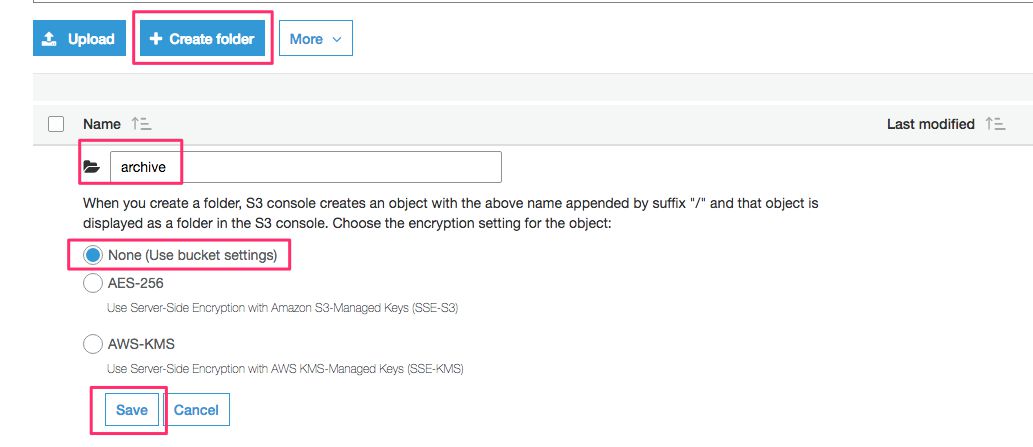
Click + Create folder, and create the following three folders into this empty bucket:
archive
enriched
shredded
Then, in archive, create the following three folders:
raw
enriched
shredded
Next, in both enriched and shredded, create the following two folders:
good
bad
Thus, you should end up with a bucket that has the following structure:
.
|-- elasticbeanstalk-region-id
|-- simoahava-snowplow-data
|   |-- archive
|   |   |-- raw
|   |   |-- enriched
|   |   |-- shredded
|   |-- encriched
|   |   |-- good
|   |   |-- bad
|   |-- shredded
|   |   |-- good
|   |   |-- bad
Finally, create one more bucket in the root of S3 named something like simoahava-snowplow-log. You’ll use this for the logs produced by the batch process.
Prepare for configuring the EmrEtlRunner
Now you’ll need to configure the EmrEtlRunner. You’ll use the config.yml file you copied from the Snowplow repo to the config/ folder. For the config, you’ll need the following things:
The Access Key ID and Secret Access Key for the
snowplow-setupuser you created all the way back in Step 0. If you didn’t save these, you can generate a new Access Key through AWS IAM.You will need to download and install the AWS Command Line Interface. You can use the official guide to install it with Python/pip, but if you’re running Mac OS X, I recommend using Homebrew instead. Once you’ve installed Homebrew, you just need to run
brew install awsclito install the AWS client.
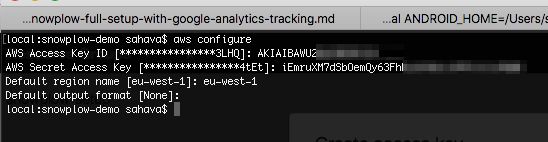
Once you’ve installed awscli, you need to run aws configure in your terminal, and do what it instructs you to do. You’ll need your Access Key ID and Secret Access Key handy, as well as the region name (e.g. eu-west-1) where you’ll be running your EC2 (again, I recommend to use the same region for all parts of this pipeline process).
$ aws configure
AWS Access Key ID: <enter your IAM user Access Key ID here>
AWS Secret Access Key: <enter you IAM user Secret Access Key here>
Default region name: <enter the region name, e.g. eu-west-1 here>
Default output format: <just press enter>
This is what it looked like when I ran aws configure.
After running aws configure, the next command you’ll need to run is aws emr create-default-roles. This will create default roles for the EmrEtlRunner, so that it can perform the necessary tasks in EC2 for you.
Once you’ve done these steps (remember to still keep your Access Key ID and Secret Access Key close by), you’re ready to configure EmrEtlRunner!
Configure EmrEtlRunner
EmrEtlRunner is the name of the utility you downloaded earlier, with the filename snowplow-emr-etl-runner.
EmrEtlRunner does a LOT of things. See this diagram to see an overview of the process. At this point, we’ll do all the steps except for step 13, rdb_load. That’s the step where the enriched and shredded data are copied into a relational database. We’ll take care of that in the next step.
Anyway, EmrEtlRunner is operated by config.yml, which you’ve copied into the config/ directory. I’ll show you the config I use, and highlight the parts you’ll need to change.
aws:
access_key_id: AKIAIBAWU2NAYME55123
secret_access_key: iEmruXM7dSbOemQy63FhRjzhSboisP5TcJlj9123
s3:
region: eu-west-1
buckets:
assets: s3://snowplow-hosted-assets
jsonpath_assets:
log: s3://simoahava-snowplow-log
raw:
in:
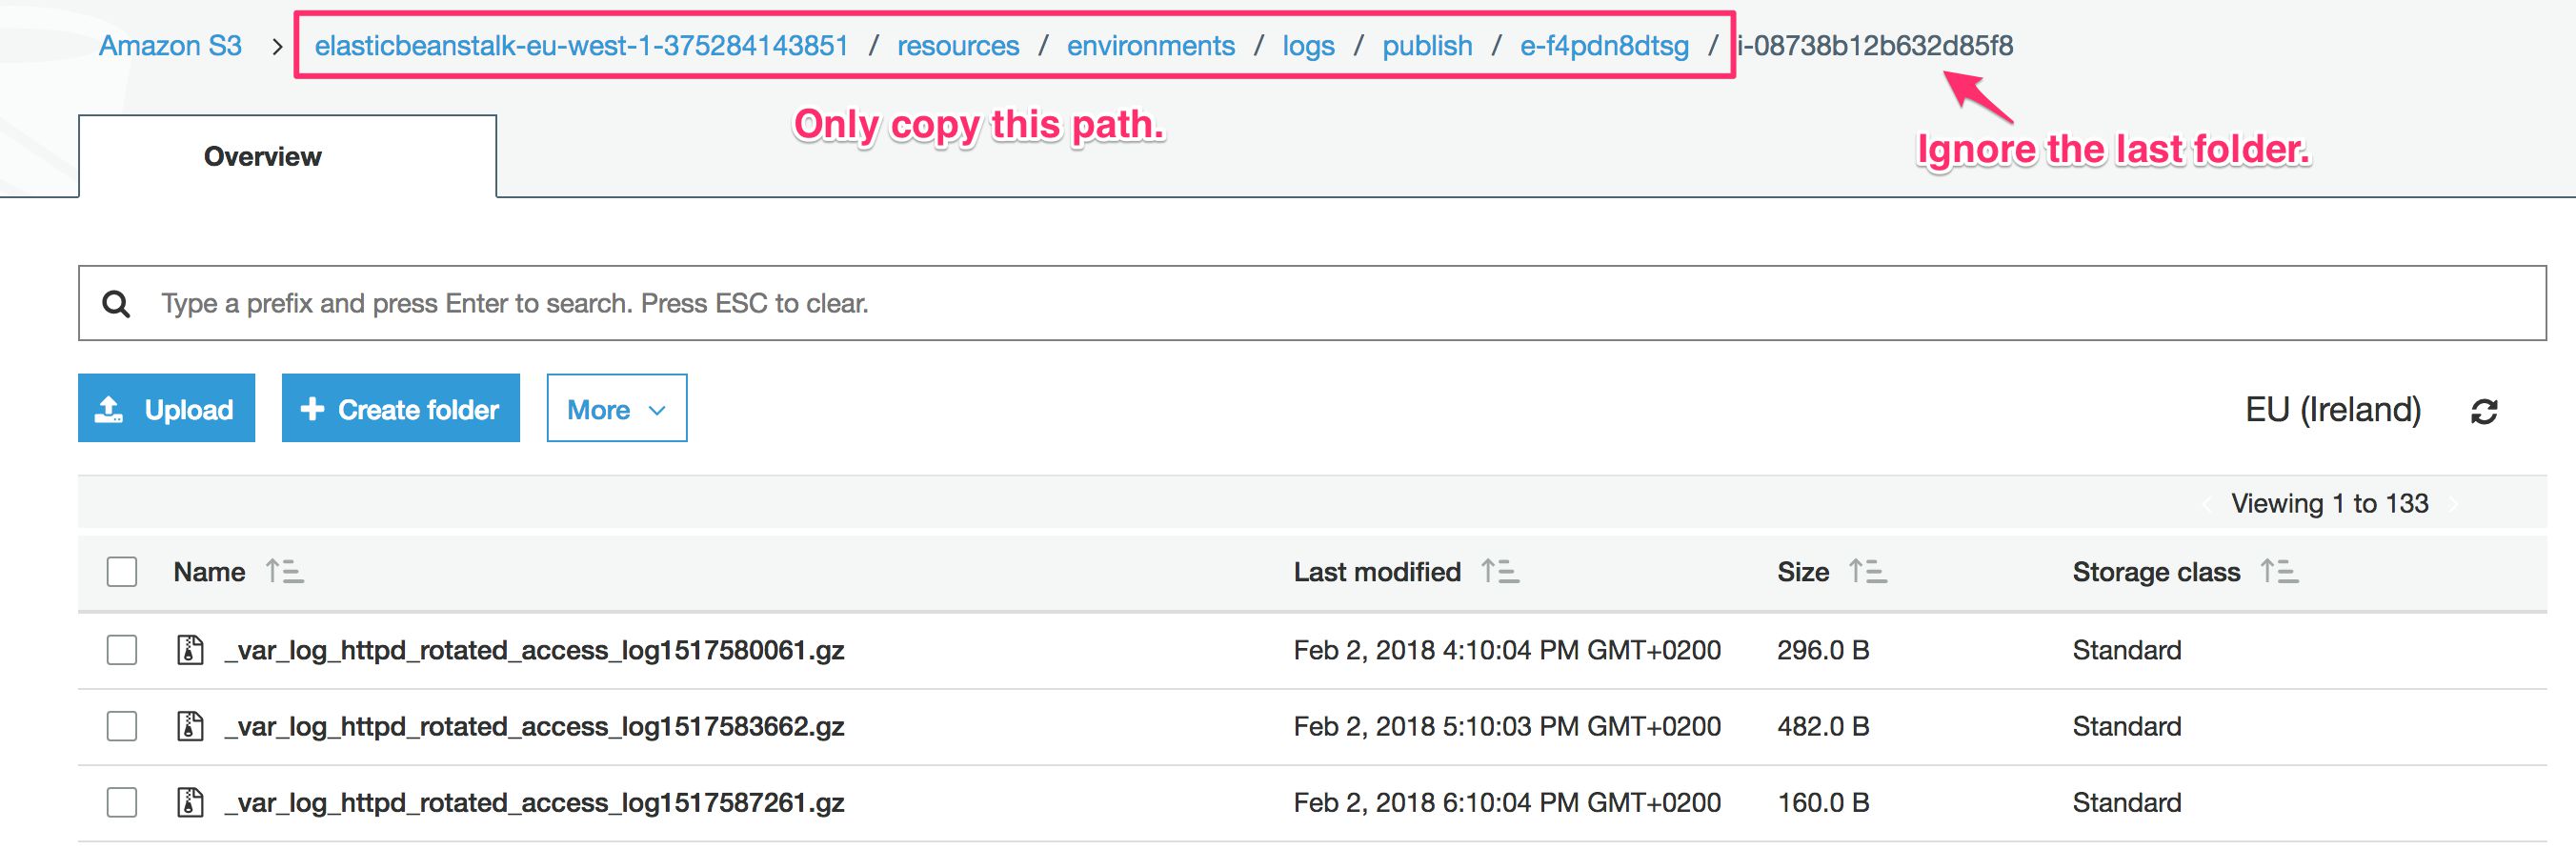
- s3://elasticbeanstalk-eu-west-1-375284143851/resources/environments/logs/publish/e-f4pdn8dtsg
processing: s3://simoahava-snowplow-data/processing
archive: s3://simoahava-snowplow-data/archive/raw
enriched:
good: s3://simoahava-snowplow-data/enriched/good
bad: s3://simoahava-snowplow-data/enriched/bad
errors:
archive: s3://simoahava-snowplow-data/archive/enriched
shredded:
good: s3://simoahava-snowplow-data/shredded/good
bad: s3://simoahava-snowplow-data/shredded/bad
errors:
archive: s3://simoahava-snowplow-data/archive/shredded
emr:
ami_version: 5.9.0
region: eu-west-1
jobflow_role: EMR_EC2_DefaultRole
service_role: EMR_DefaultRole
placement:
ec2_subnet_id: subnet-d6e91a9e
ec2_key_name: simoahava
bootstrap: []
software:
hbase:
lingual:
jobflow:
job_name: Snowplow ETL
master_instance_type: m1.medium
core_instance_count: 2
core_instance_type: m1.medium
core_instance_ebs:
volume_size: 100
volume_type: "gp2"
volume_iops: 400
ebs_optimized: false
task_instance_count: 0
task_instance_type: m1.medium
task_instance_bid: 0.015
bootstrap_failure_tries: 3
configuration:
yarn-site:
yarn.resourcemanager.am.max-attempts: "1"
spark:
maximizeResourceAllocation: "true"
additional_info:
collectors:
format: clj-tomcat
enrich:
versions:
spark_enrich: 1.12.0
continue_on_unexpected_error: false
output_compression: NONE
storage:
versions:
rdb_loader: 0.14.0
rdb_shredder: 0.13.0
hadoop_elasticsearch: 0.1.0
monitoring:
tags: {}
logging:
level: DEBUGThe keys you need to edit are listed next, with a comment on how to edit them. All the keys not listed below you can leave with their default values. I really recommend you read through the configuration documentation for ideas on how to modify the rest of the keys to make your setup more powerful.
| Key | Comment |
|---|---|
:aws:access_key_id | Copy-paste the Access Key ID of your IAM user here. |
:aws:secret_access_key | Copy-paste the Secret Access Key of your IAM user here. |
:aws:s3:region | Set this to the region where your S3 buckets are located in. |
:aws:s3:buckets:log | Change this to the name of the S3 bucket you created for the ETL logs. |
:aws:s3:buckets:raw:in | This is the bucket where the Tomcat logs are automatically pushed to. Do not include the last folder in the path, because this might change with an auto-scaling environment. Note! Keep the hyphen in the beginning of the line as in the config file example! |
:aws:s3:buckets:raw:processing | Set this to the respective processing bucket. |
:aws:s3:buckets:raw:archive | Set this to the archive bucket for raw data. |
:aws:s3:buckets:enriched:good | Set this to the enriched/good bucket. |
:aws:s3:buckets:enriched:bad | Set this to the enriched/bad bucket. |
:aws:s3:buckets:enriched:errors | Leave this empty. |
:aws:s3:buckets:enriched:archive | Set this to the archive bucket for enriched data. |
:aws:s3:buckets:shredded:good | Set this to the shredded/good bucket. |
:aws:s3:buckets:shredded:bad | Set this to the shredded/bad bucket. |
:aws:s3:buckets:shredded:errors | Leave this empty. |
:aws:s3:buckets:shredded:archive | Set this to the archive bucket for shredded data. |
:aws:emr:region | This should be the region where the EC2 job will run. |
:aws:emr:placement | Leave this empty. |
:aws:emr:ec2_subnet_id | The subnet ID of the Virtual Private Cloud the job will run in. You can use the same subnet ID used by the EC2 instance running your collector. |
:aws:emr:ec2_key_name | The name of the EC2 Key Pair you created earlier. |
:collectors:format | Set this to clj-tomcat. |
:monitoring:snowplow | Remove this key and all its children (:method, :app_id, and :collector). |
Just two things to point out.
First, when copying the :aws:s3:buckets:raw:in path, do not copy the last folder name. This is the instance ID. With an auto-scaling environment set for the collector, there might be multiple instance folders in this bucket. If you only name one folder, you’ll risk missing out on a lot of data.
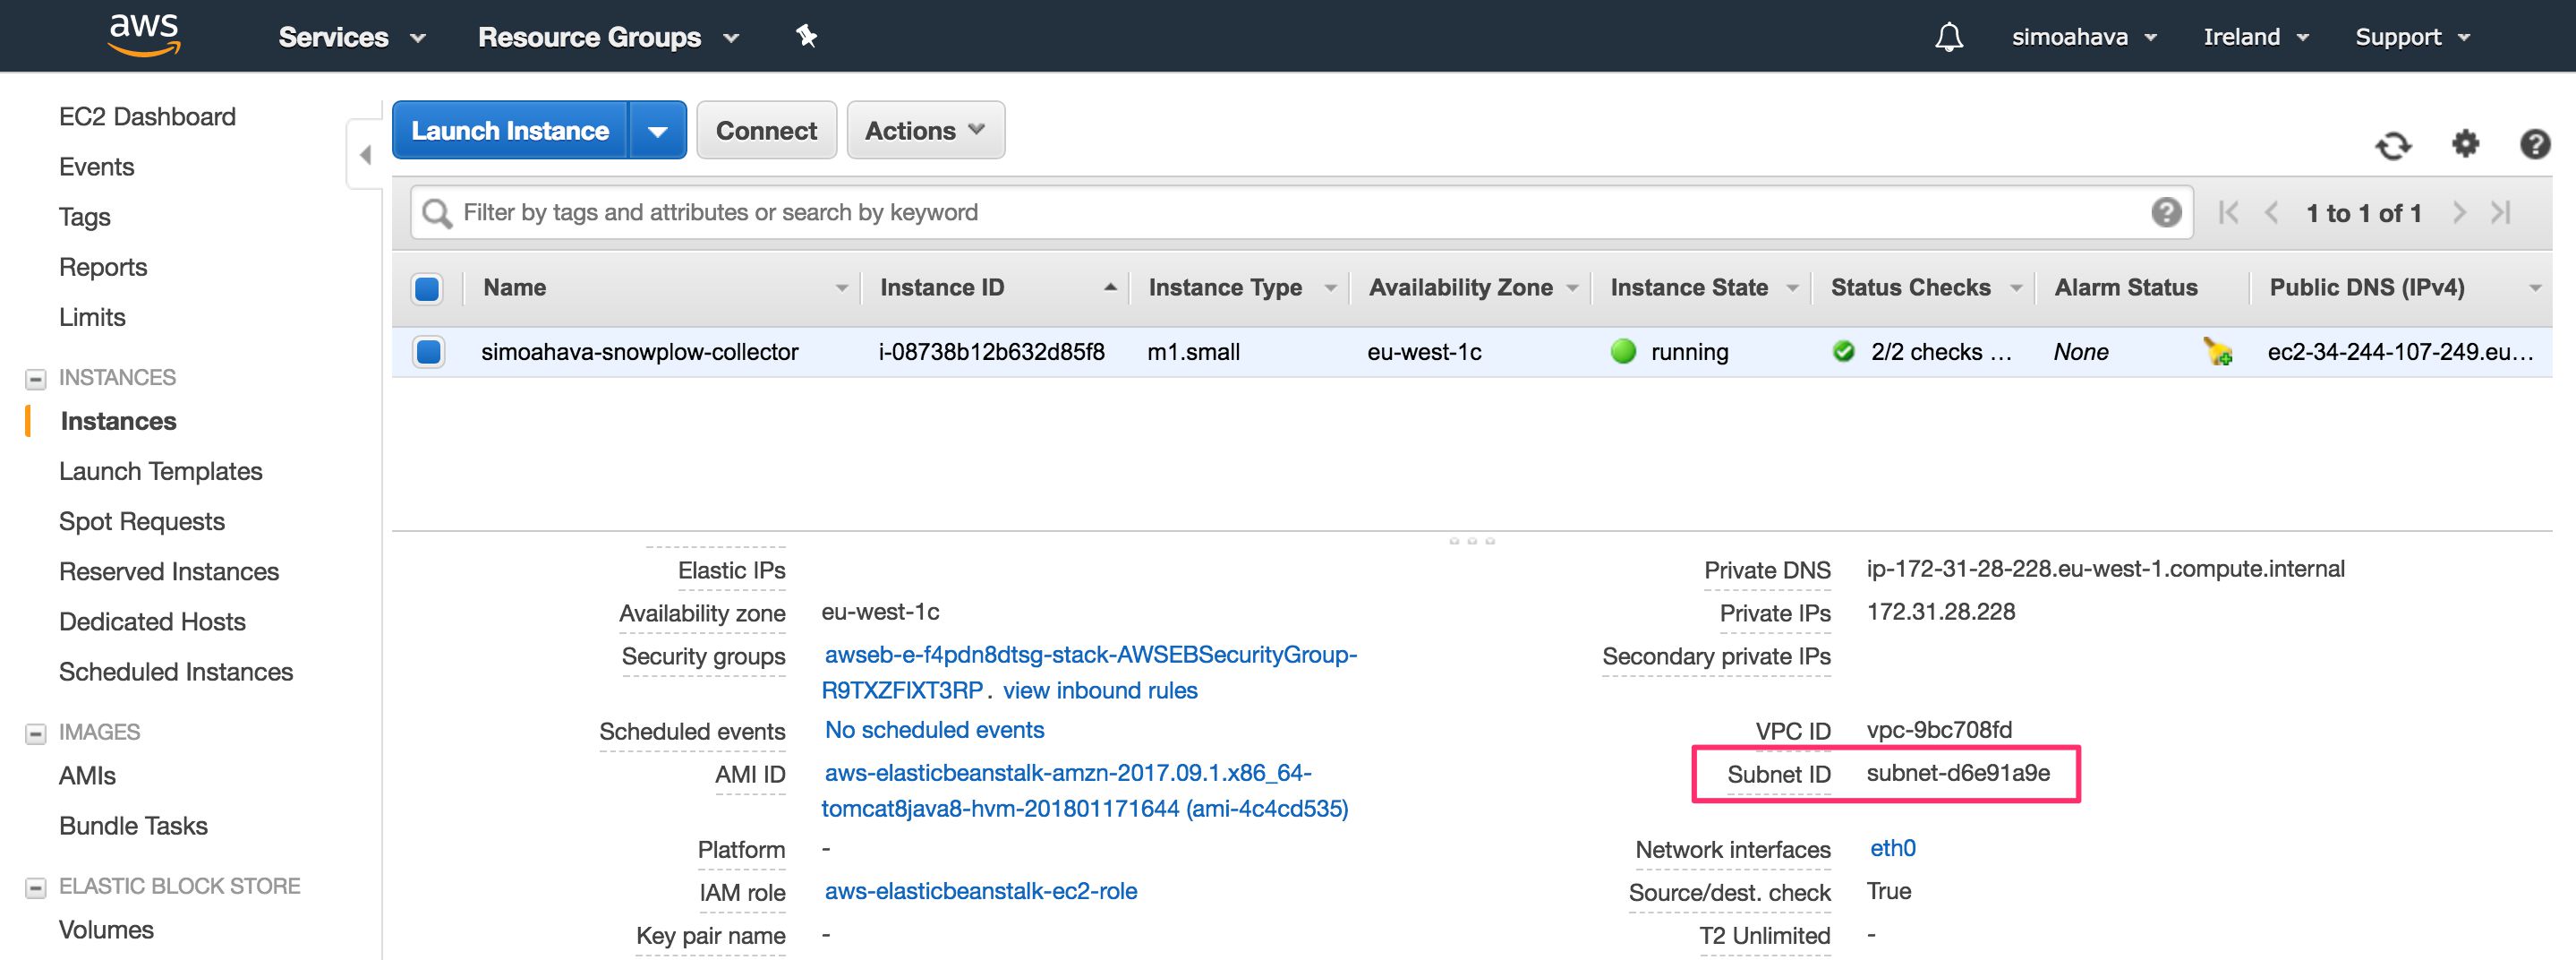
You can get the :aws:emr:ec2_subnet_id by opening the Services menu in AWS and clicking EC2. Click the link titled Running Instances (there should be 1 running instance - your collector). Scroll down the Description tab contents until you find the Subnet ID entry. Copy-paste that into the aws:emr:ec2_subnet_id field.
If you’ve followed all the steps in this chapter, you should now be set.
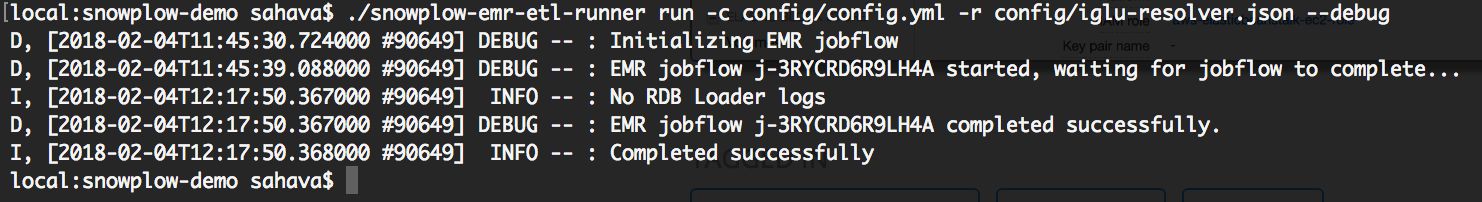
You can verify everything works by running the following command in the directory where the snowplow-emr-etl-runner executable is, and where the config folder is located.
./snowplow-emr-etl-runner run -c config/config.yml -r config/iglu_resolver.json
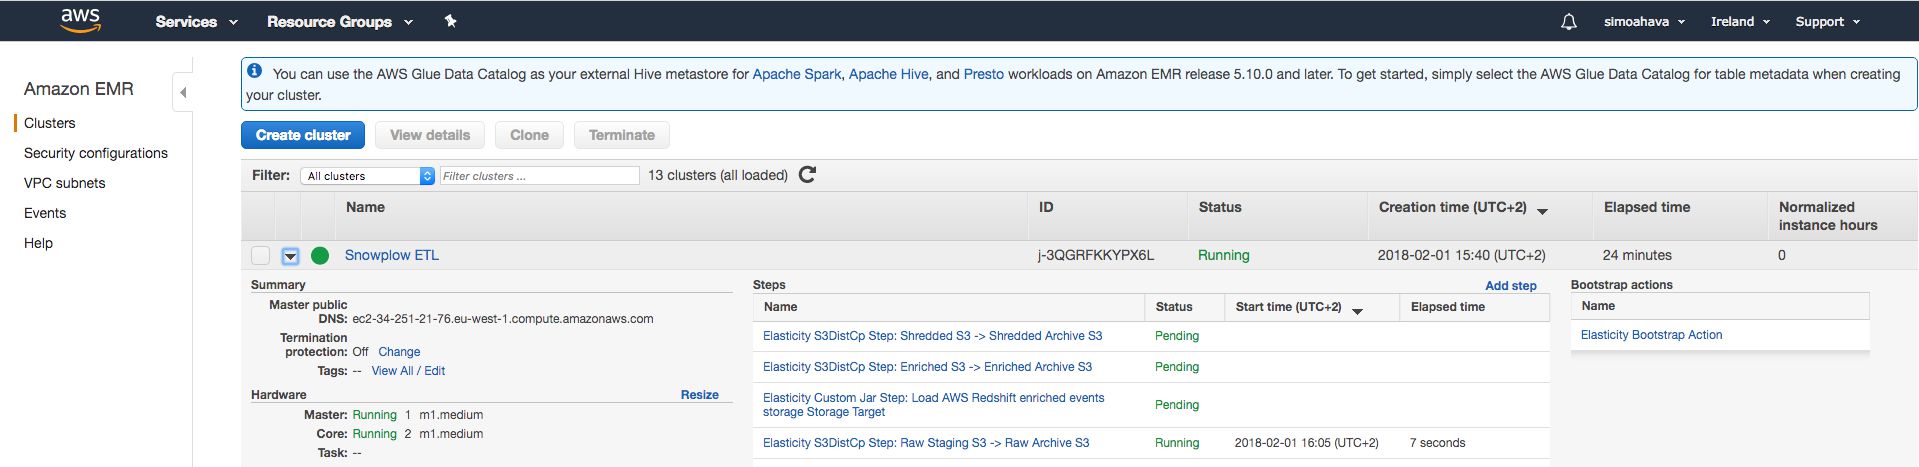
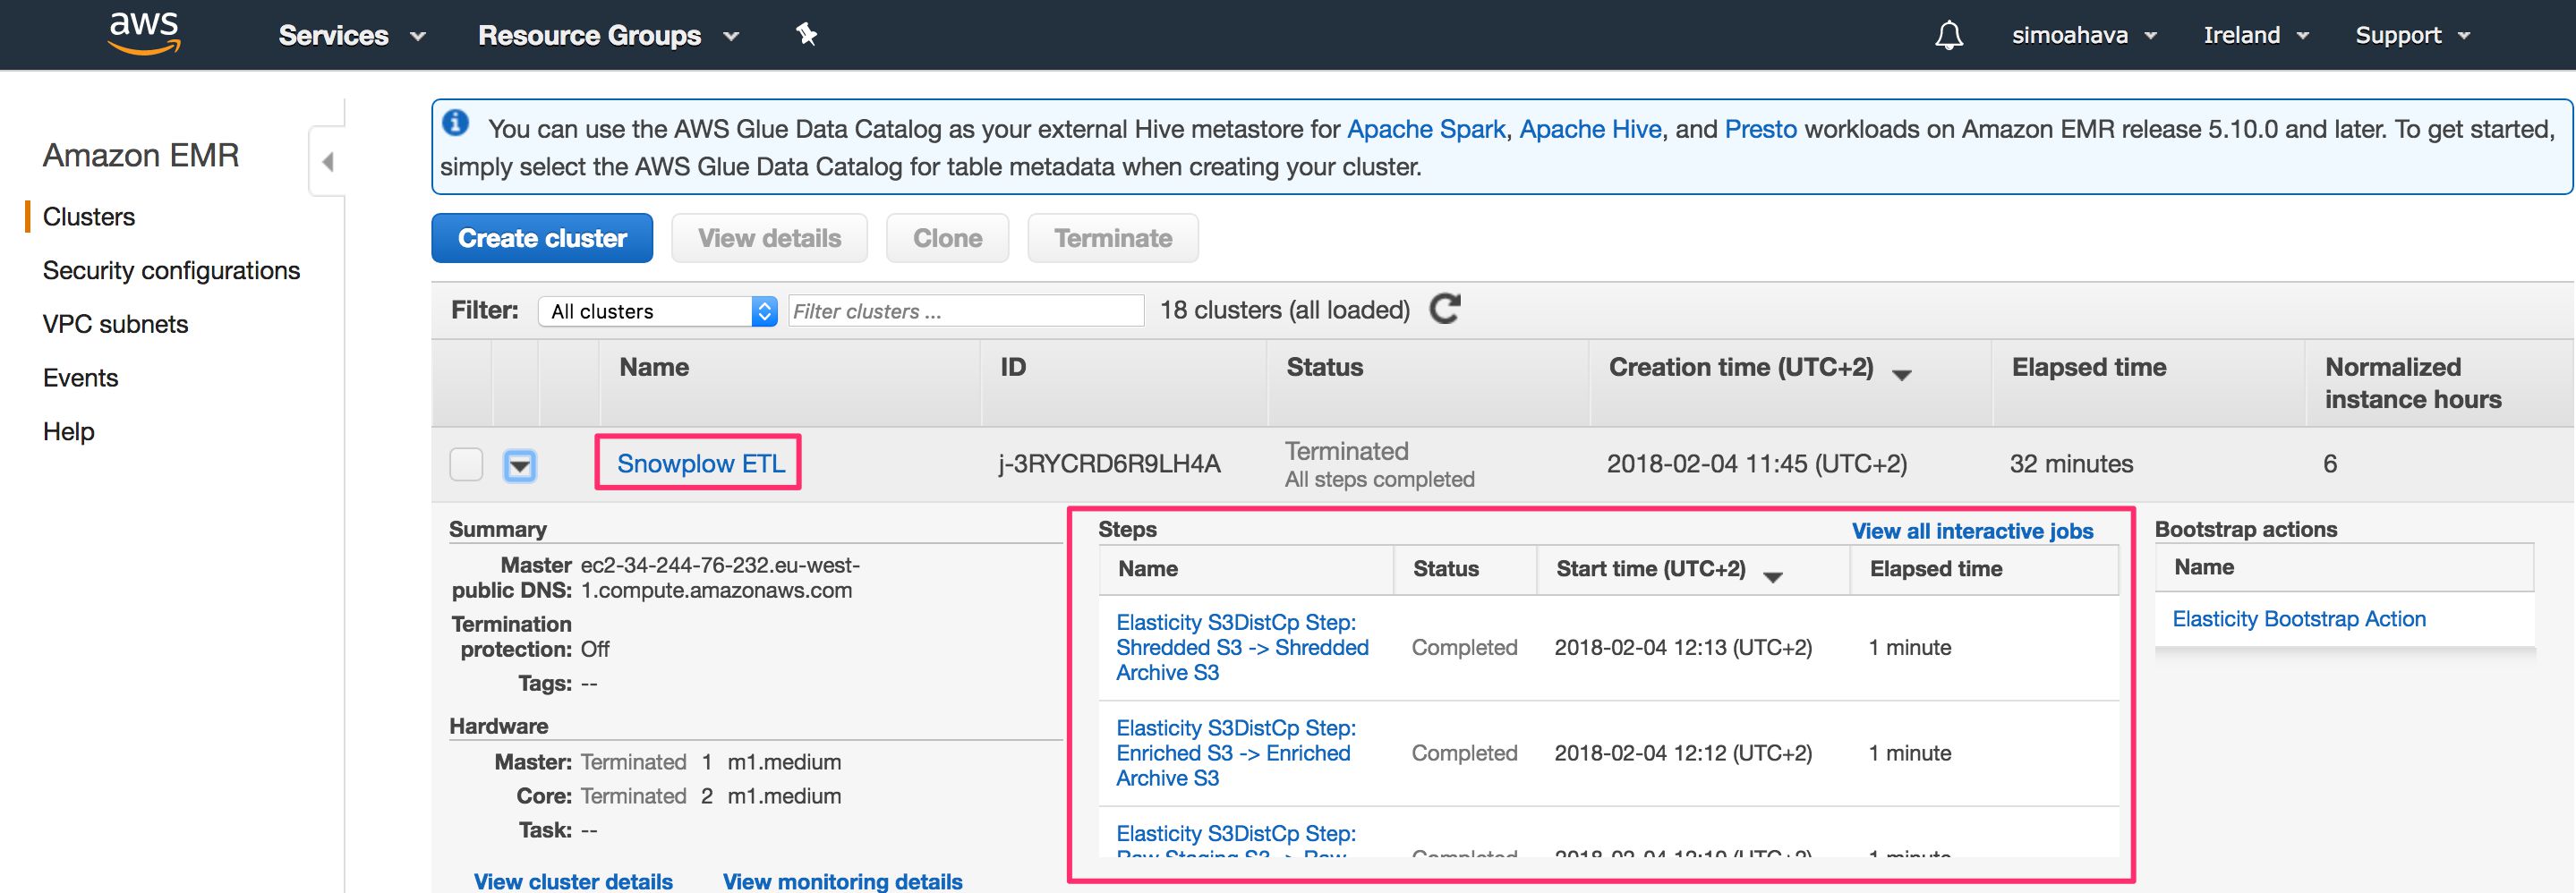
You can also follow the process in real-time by opening the Services menu in AWS and clicking EMR. There, you should see the job named Snowplow ETL. By clicking it, you can see all the steps it is running through. If the process ends in an error, you can also debug quite handily via this view, since you can see the exact step where the process failed.
Once the ETL has successfully completed, you can check your S3 buckets again. Your Snowplow data buckets should now contain a lot of new stuff. The folder with the interesting data is archive / shredded. This is where the good shredded datasets are copied to, and corresponds to what would have been copied to the relational database had you set this up in this step.
Anyway, with the ETL process up and running, just one more step remains in this monster of a guide: setting up AWS Redshift as the relational database where you’ll be warehousing your analytics data!
What you should have after this step
The
snowplow-emr-etl-runnerexecutable configured with yourconfig.ymlfile.New buckets in S3 to store all the files created by the batch process.
The ETL job running without errors all the way to completion, enriching and shredding the raw Tomcat logs into relevant S3 buckets.
Step 4: Load the data into Redshift
What you need for this step
The ETL process configured and available to run at your whim.
Shredded files being stored in the archive / shredded S3 bucket.
An SQL query client. I recommend SQL Workbench/J, which is free. That’s the one I’ll be using in this guide.
Getting started
In this final step of this tutorial, we’ll load the shredded data into Redshift tables. Redshift is a data warehouse service offered by AWS. We’ll use it to build a relational database, where each table stores the information shredded from the Tomcat logs in a format easy to query with SQL. By the way, if you’re unfamiliar with SQL, look no further than this great Codecademy course to get you started with the query language!
The steps you’ll take in this chapter are roughly these:
Create a new cluster and database in Redshift.
Add users and all the necessary tables to the database.
Configure the EmrEtlRunner to automatically load the shredded data into Redshift tables.
Once you’re done, each time you run EmrEtlRunner, the tables will be populated with the parsed tracker data. You can then run SQL queries against this data, and use it to proceed with the two remaining steps (not covered in this guide) of the Snowplow pipeline: data modeling and analysis.
Create the cluster
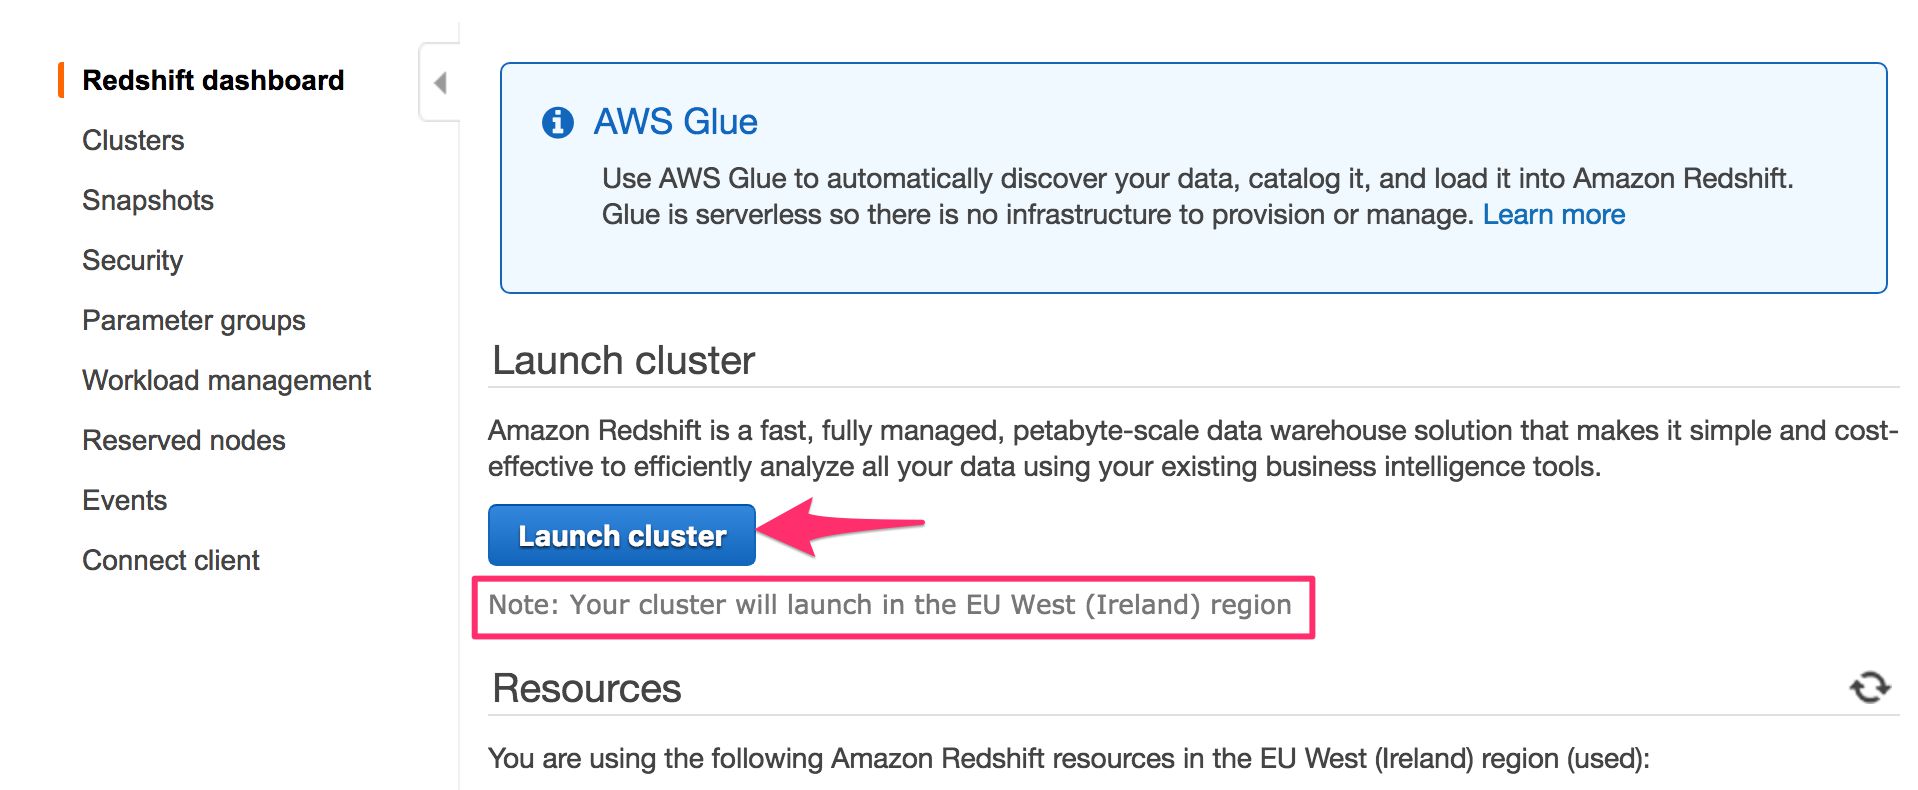
In AWS, select Services from the top navigation and choose the Amazon Redshift service.
Again, double-check that you are in the correct region (the same one where you’ve been working on all along, or, at the very least, the one where your S3 logs are). Then click the Launch cluster button.
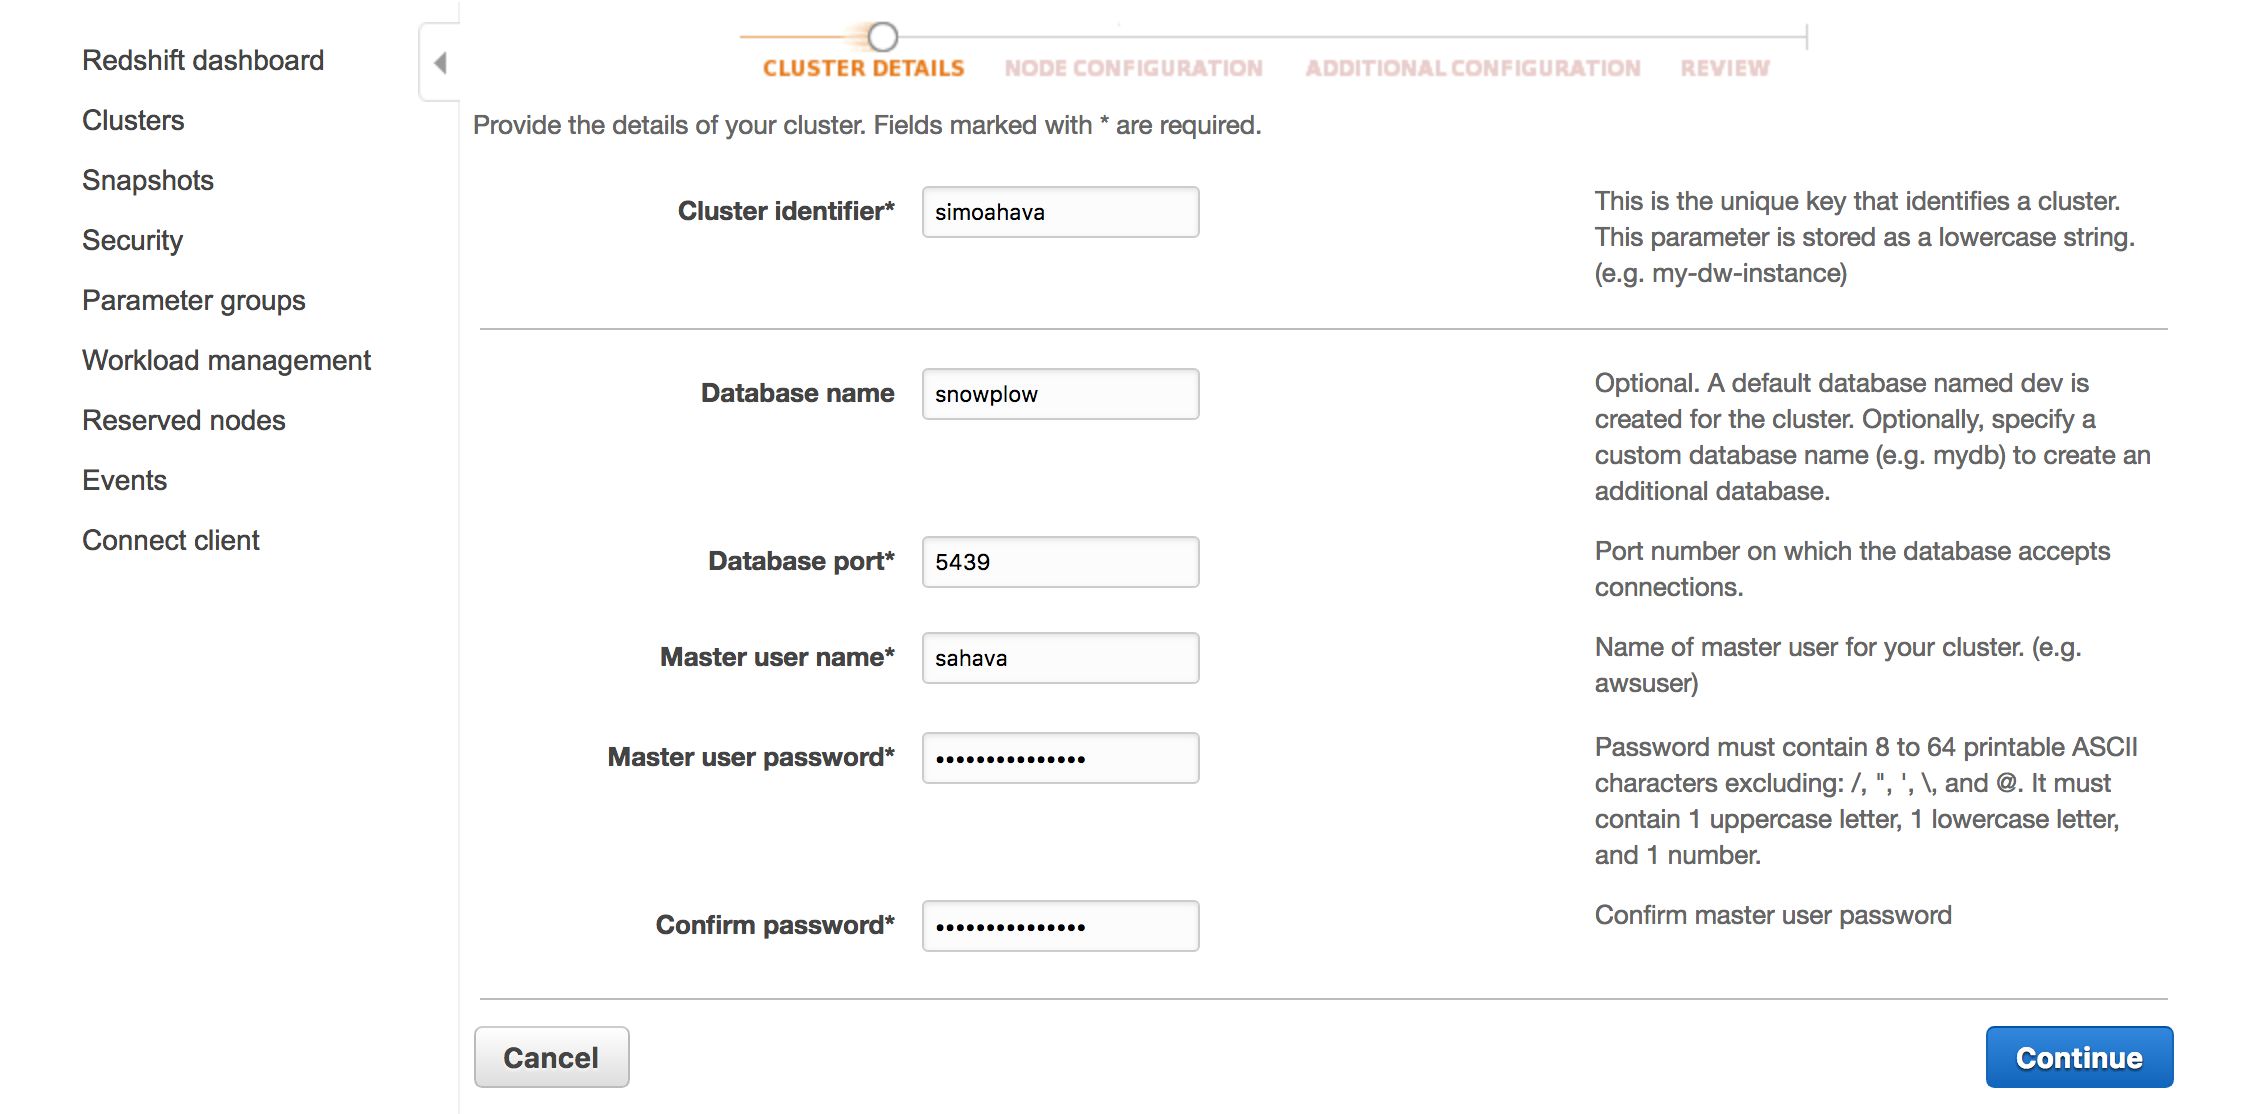
Give the cluster an identifier. I named my cluster simoahava. Give a name to the database, too. The name I chose was snowplow.
Keep the database port at its default value (5439).
Add a username and password to your master user. This is the user you’ll initially log in with, and it’s the one you’ll create the rest of the users and all the necessary tables with. Remember to write these down somewhere - you’ll need them in just a bit.
Click Continue when ready.
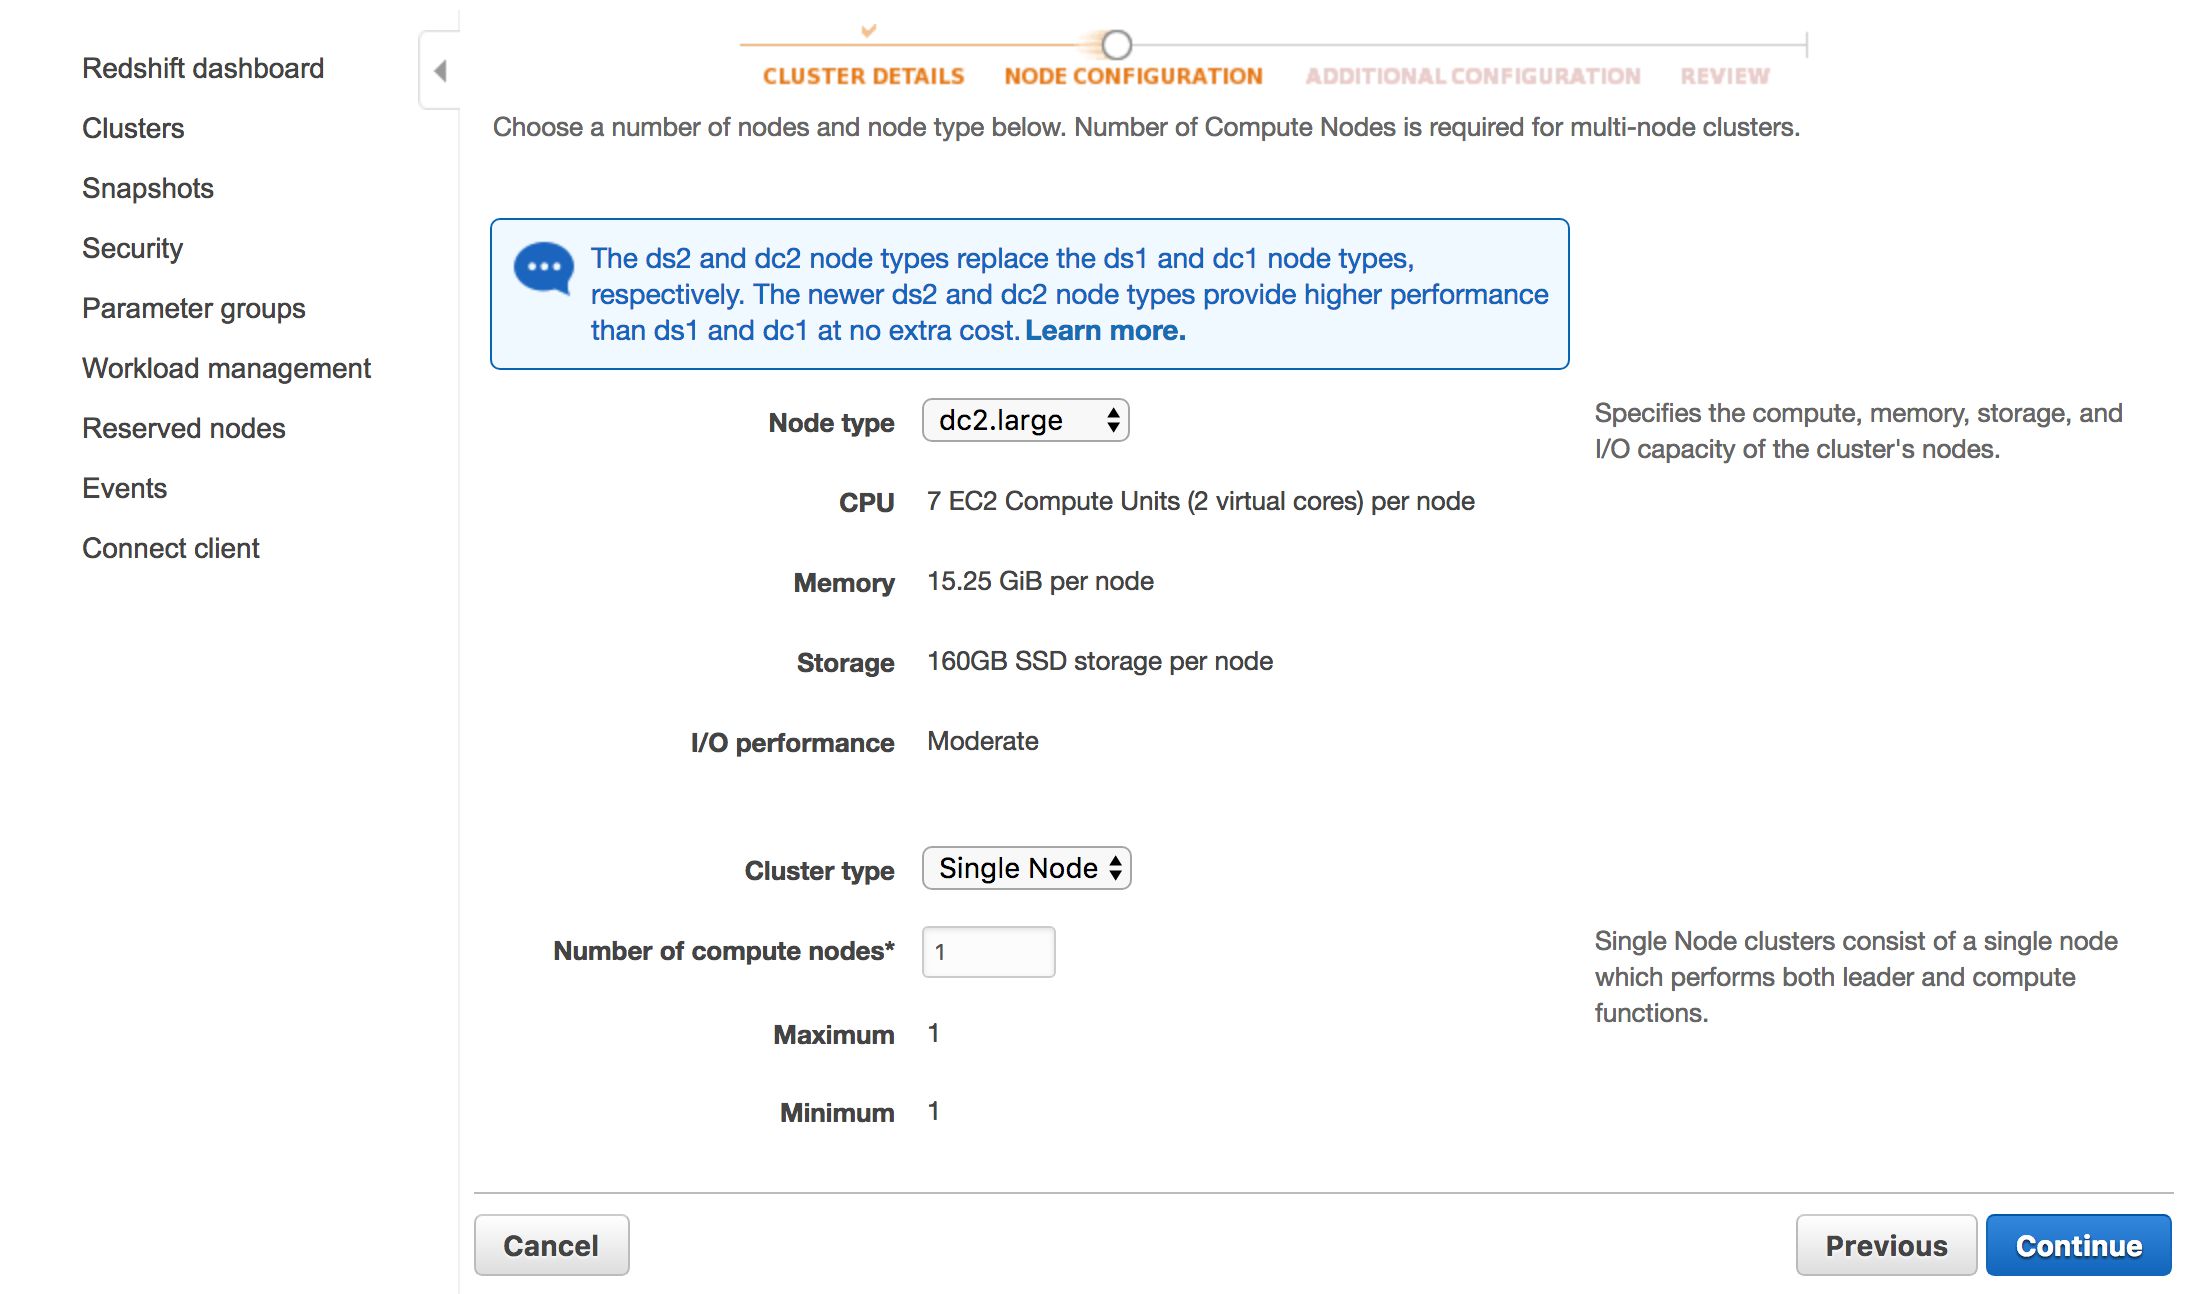
In the next view, leave the two options at their default values. Node type should be dc2.large, and Cluster type should be Single Node (with 1 as the number of compute nodes used). Click Continue when ready.
In the Additional Configuration view, you can leave most of the options at their default values. For the VPC security group, select the default group. The settings should thus be something like these:
Cluster parameter group: default-redshift-1.0
Encrypt database: None
Choose a VPC: Default VPC (…)
Cluster subnet group: default
Publicly accessible: Yes
Choose a public IP address: No
Enhanced VPC Routing: No
Availability zone: No Preference
VPC security groups: default (sg-…)
Create CloudWatch Alarm: No
Available roles: No selection
Once done, click Continue.
You can double-check your settings, and then just click Launch cluster.
The cluster will take some minutes to launch. You can check the status of the cluster in the Redshift dashboard.
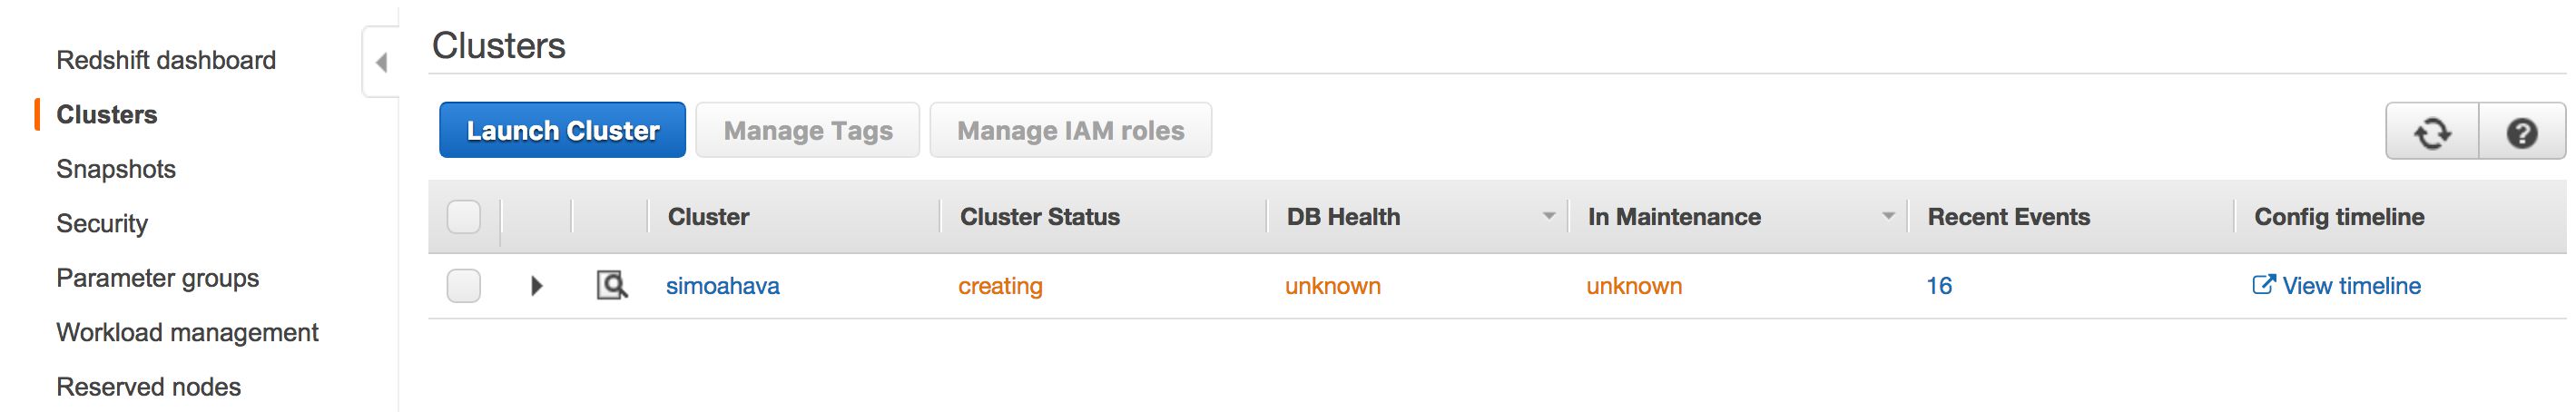
Once the cluster has been launched, you are ready to log in and configure it!
Configure the cluster and connect to it
The first thing you’ll need to do is make sure the cluster accepts incoming connections from your local machine.
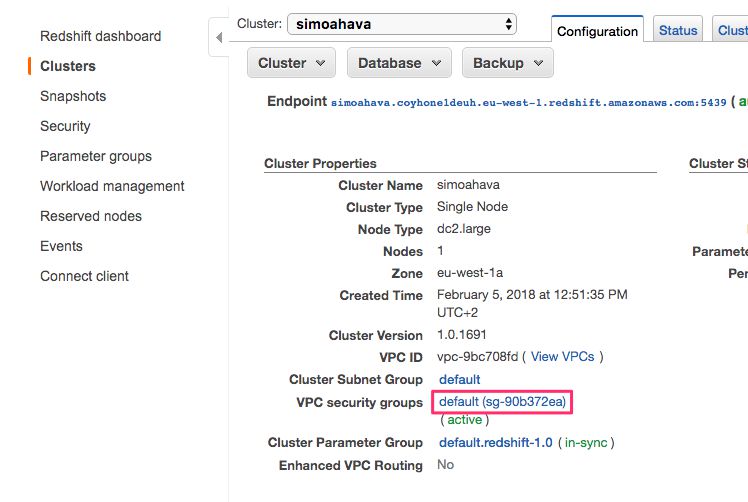
So after clicking Services in the AWS top navigation and choosing Amazon Redshift, go to Clusters and then click the cluster name in the dashboard.
Under Cluster Properties, click the link to the VPC security group (should be named something like default (sg-1234abcd)).
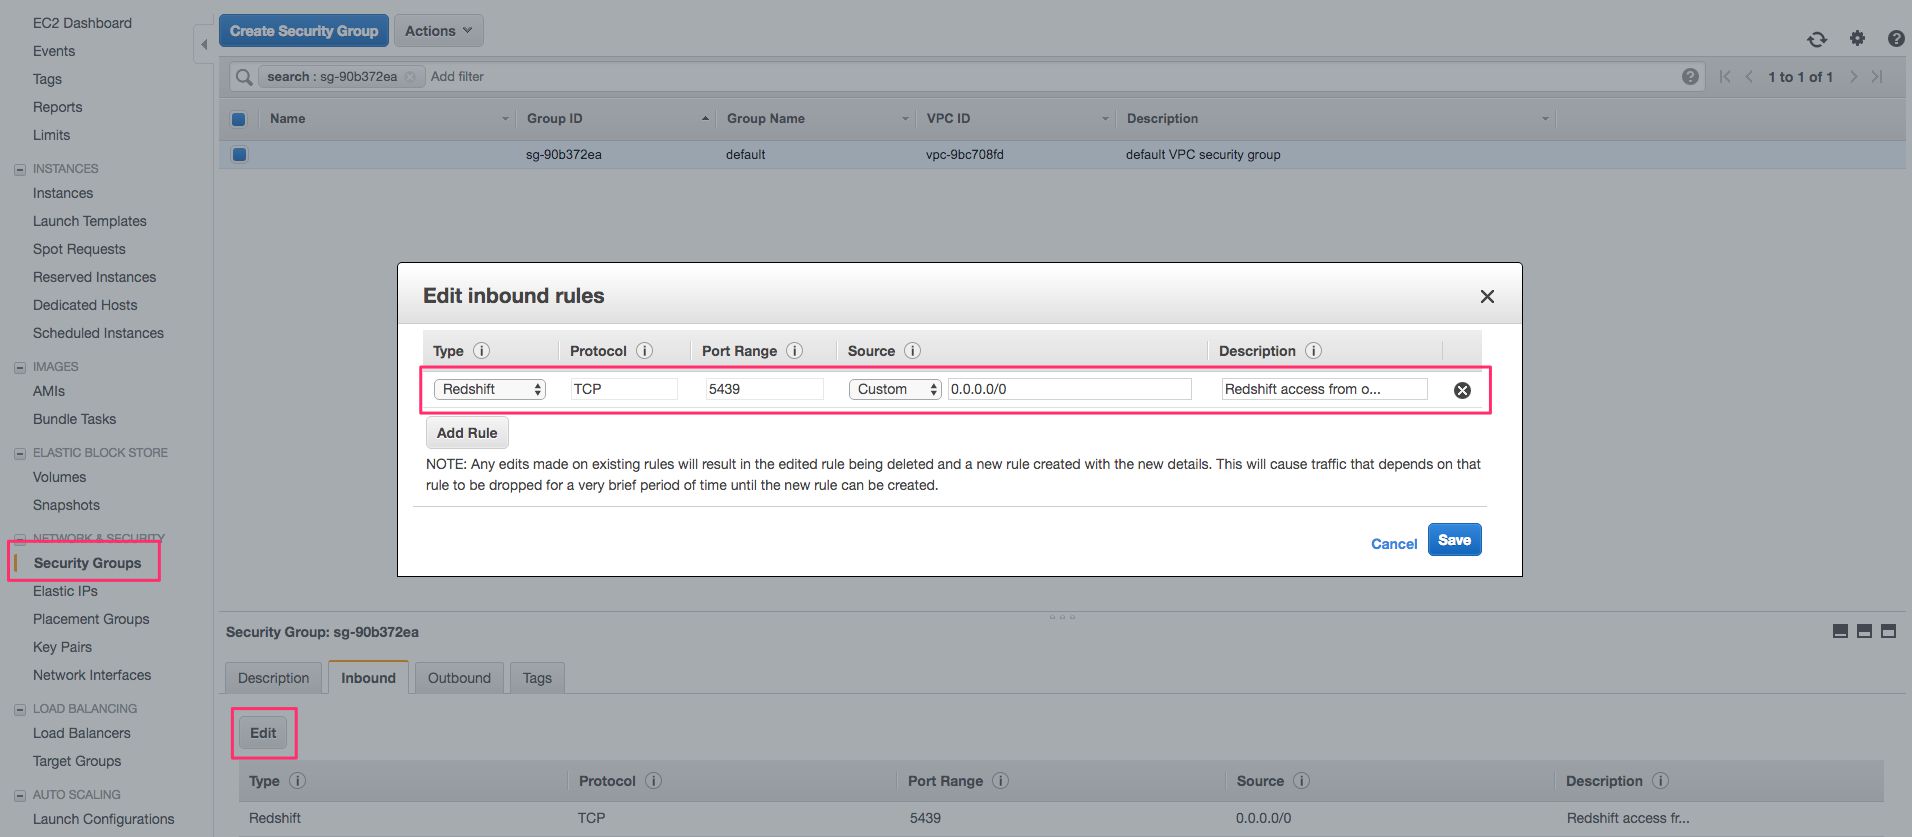
You should be transported to the EC2 dashboard, and Security Groups should be active in the navigation menu.
In the bottom of the screen, the settings for the security group you clicked should be visible.
Select the Inbound tab, and make sure it shows a TCP connection with Port Range 5439 and 0.0.0.0/0 as the Source. This means that all incoming TCP connections are permitted (you can change this to a more stricter policy later on).
If the values are different, you can Edit the Inbound rule to match these.
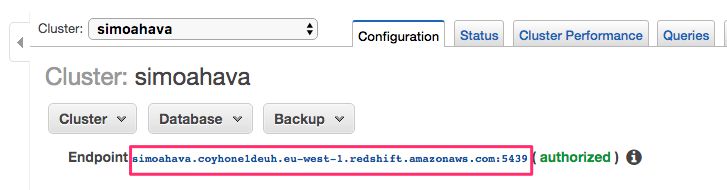
Now it’s time to connect to the cluster. Go back to Amazon Redshift, and open your cluster settings as before. Copy the link to the cluster from the top of the settings list.
Next, open the SQL query tool of your choice. I’m using SQL Workbench/J. Select File / Connect Window, and create a new connection with the following settings changed from defaults:
Driver: Amazon Redshift (com.amazon.redshift.jdbc.Driver)
URL: jdbc:redshift://cluster_url:cluster_port/database_name
Username: master_username
Password: master_password
Autocommit: Check
In URL, copy-paste the Redshift URL with port after the colon and database name after the slash.
As Username and Password, add the master username and master password you chose when creating the cluster.
Make sure Autocommit is checked. These are settings I have:
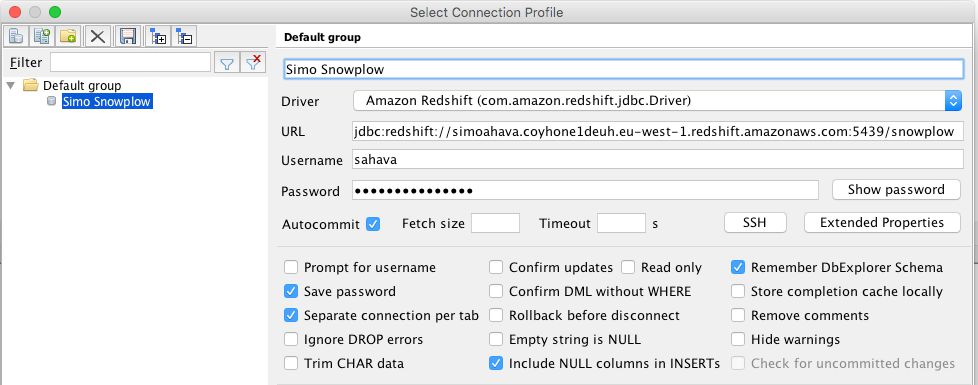
Once done, you can click OK, and the tool will connect to your cluster and database.
Once connected, you can feed the command SELECT current_database(); and click the Execute button to check if everything works. This is what you should see:
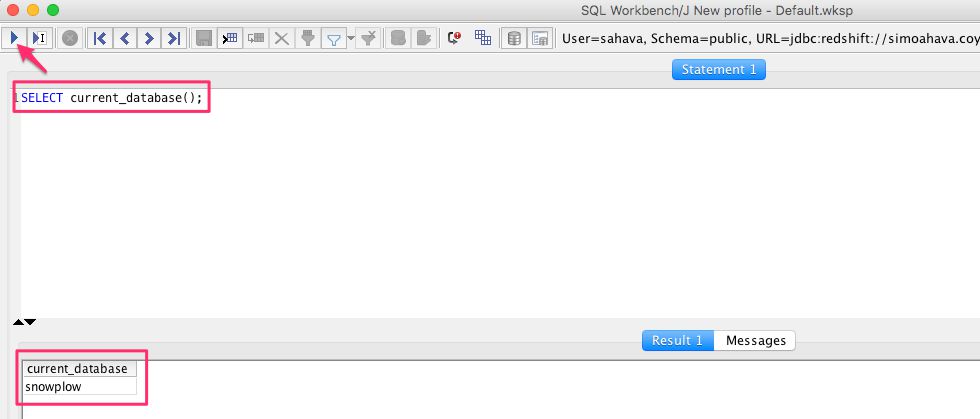
If the query returns the name of the database, you’re good to go!
Create the database tables
First, we’ll need to create the tables that will store the Google Analytics tracker data within them. The tables are loaded as .sql files, and these files contain DDL (data-definition language) constructions that build all the necessary schemas and tables.
For this, you’ll need access to the schema .sql files, which you’ll find in the following locations within the snowplow Git repo:
Load atomic-def.sql first, and run the file in your SQL query tool while connected to your Redshift database. You should see a message that the schema atomic and table atomic.events were created successfully.
Next, run manifest-def.sql while connected to the database. You should see a message that the table atomic.manifest was created successfully.
Now you need to load all the DDLs for the Google Analytics schemas. If you don’t create these tables, then the ETL process will run into an error, where the utility tries to copy shredded events into non-existent tables.
You can find all the required .sql files in the following three directories:
https://github.com/snowplow/iglu-central/tree/master/sql/com.google.analytics
https://github.com/snowplow/iglu-central/tree/master/sql/com.google.analytics.enhanced-ecommerce
https://github.com/snowplow/iglu-central/tree/master/sql/com.google.analytics.measurement-protocol
You need to load all the .sql files in these three directories and run them while connected to your database. This will create a whole bunch of tables you’ll need if you want to collect Google Analytics tracker data.
It might be easiest to clone the iglu-central repo, and then load the .sql files into your query tool from the local directories.
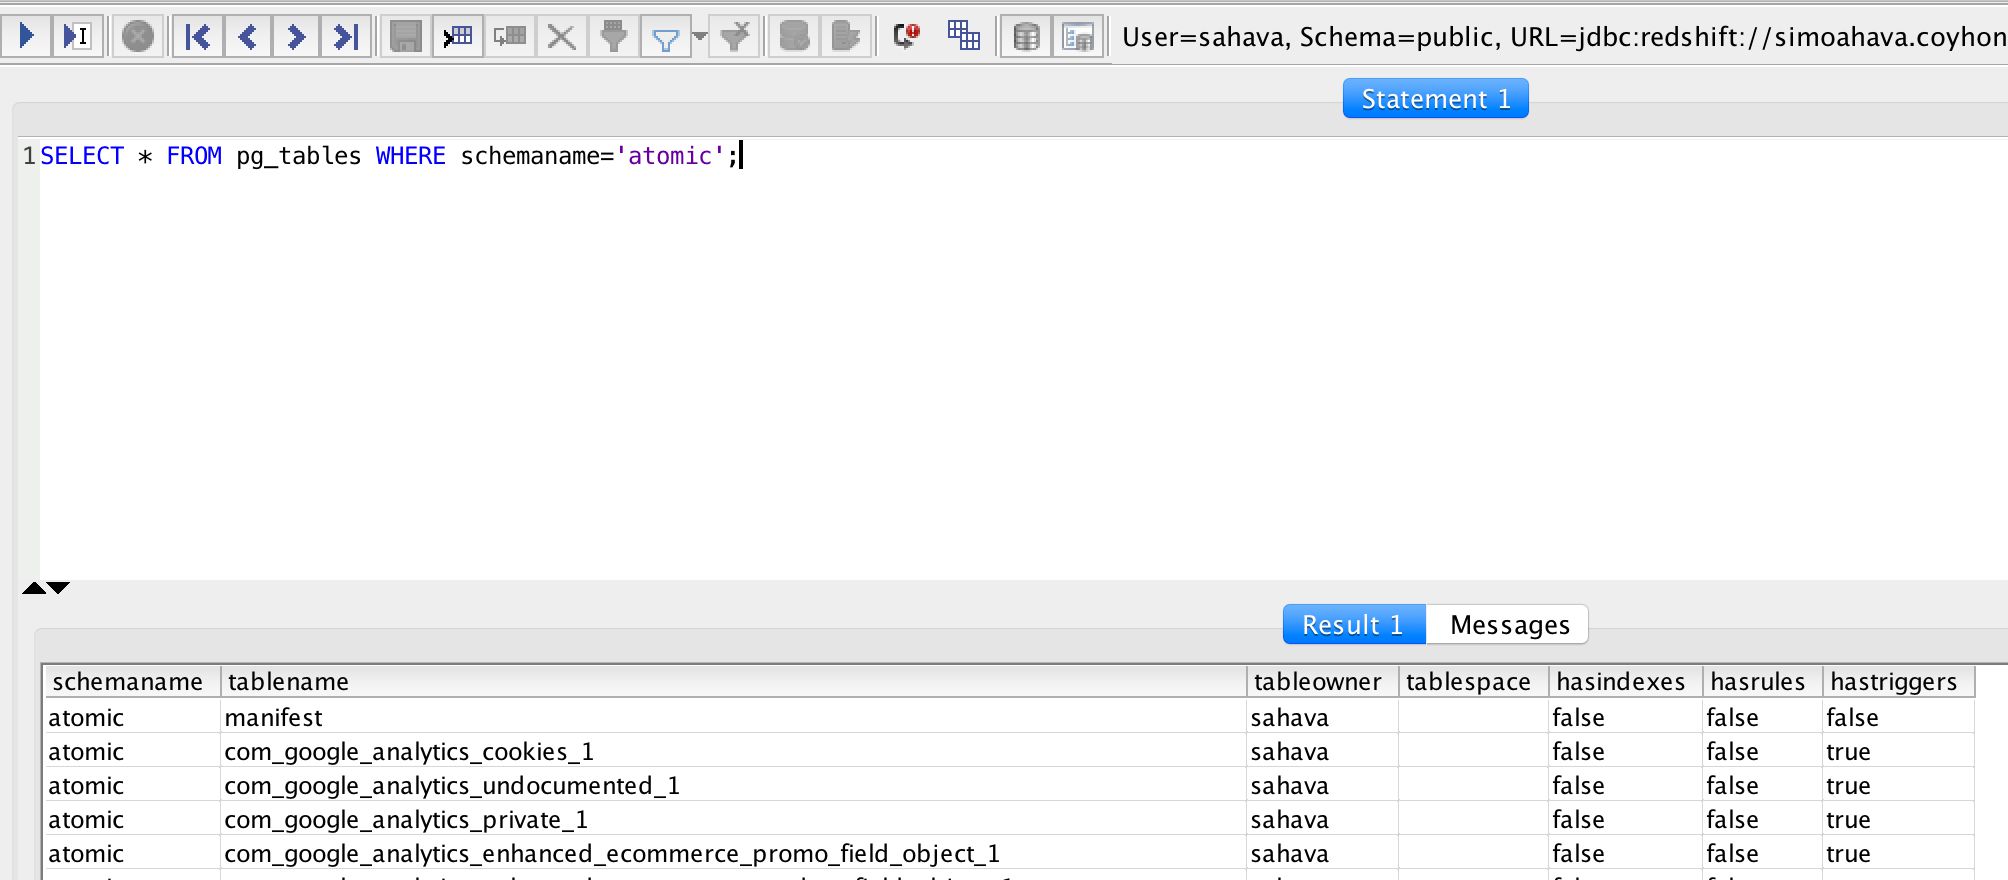
Once you’re done, you should be able to run the following SQL query and see a list of all the tables you just created as a result (should be 40 in total):
SELECT * FROM pg_tables WHERE schemaname='atomic';
Create the database users
Next thing we’ll do is create three users:
storageloader, who will be in charge of the ETL process.power_user, who will have admin privileges, so you no longer have to log in with the master credentials.read_only, who can query data and create his/her own tables.
Make sure you’re still connected to the database, and copy-paste the following SQL queries into the query window. For each $password, change it to a proper password, and make sure you write these user + password combinations down somewhere.
CREATE USER storageloader PASSWORD '$password';
GRANT USAGE ON SCHEMA atomic TO storageloader;
GRANT INSERT ON ALL TABLES IN SCHEMA atomic TO storageloader;

CREATE USER read_only PASSWORD '$password';
GRANT USAGE ON SCHEMA atomic TO read_only;
GRANT SELECT ON ALL TABLES IN SCHEMA atomic TO read_only;
CREATE SCHEMA scratchpad;
GRANT ALL ON SCHEMA scratchpad TO read_only;

CREATE USER power_user PASSWORD '$password';
GRANT ALL ON DATABASE snowplow TO power_user;
GRANT ALL ON SCHEMA atomic TO power_user;
GRANT ALL ON ALL TABLES IN SCHEMA atomic TO power_user;
Again, remember to change the three $password values to proper SQL user passwords.
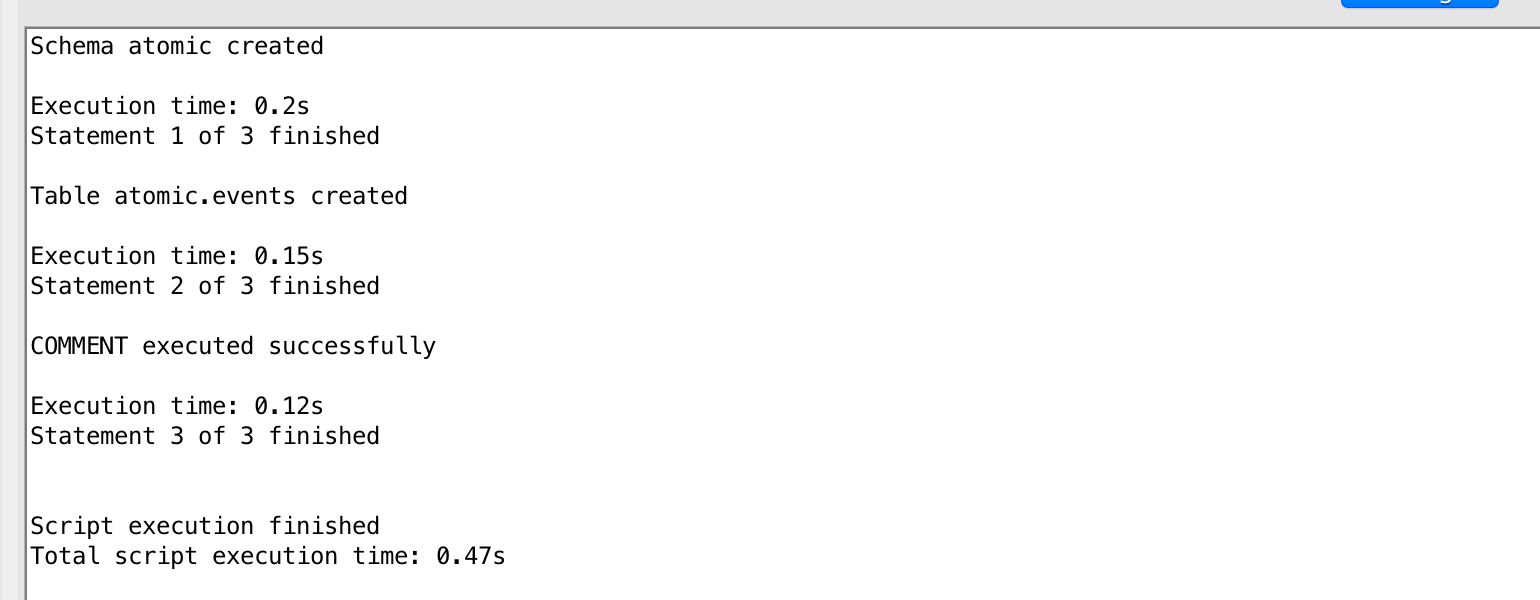
If all goes well, you should see 12 “COMMAND executed successfully” statements.
Finally, you need to grant ownership of all tables in schema atomic to storageloader, because this user will need to run some commands (specifically, vacuum and analyze) that only table owners can run.
So, first run the following query in the database.
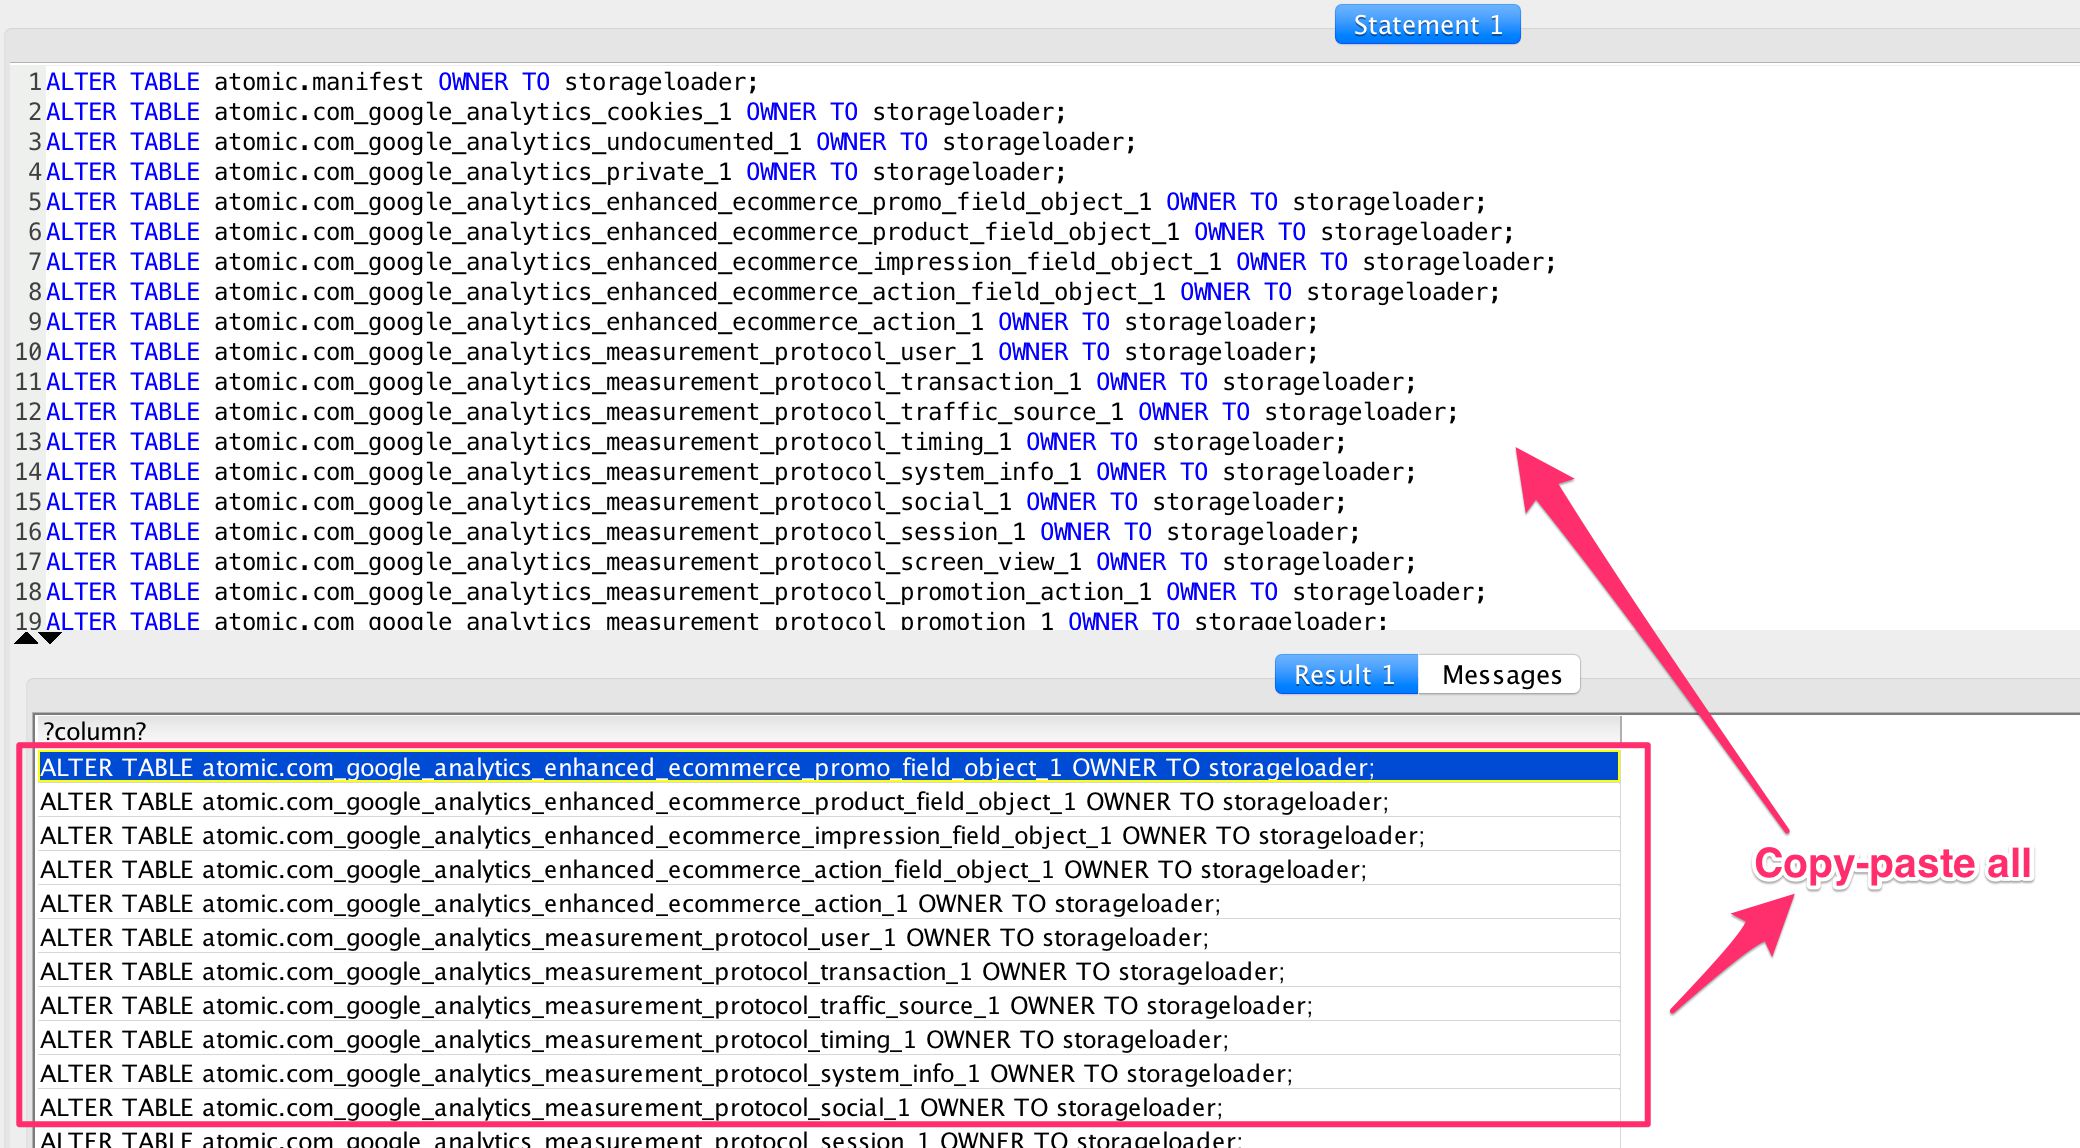
SELECT 'ALTER TABLE atomic.' || tablename ||' OWNER TO storageloader;'
FROM pg_tables WHERE schemaname='atomic' AND NOT tableowner='storageloader';
In the query results, you should see a bunch of ALTER TABLE atomic.* OWNER TO storageloader; queries. Copy all of these, and paste them into the statement field as new queries. Then run the statements.
Now, if you run SELECT * FROM pg_tables WHERE schemaname='atomic' AND tableowner='storageloader';, you should see all the tables in the atomic schema as a result.
You have successfully created the users and the tables in the database. All that’s left is to configure the EmrEtlRunner to execute the final step of the ETL process, where the storageloader user copies all the data from the shredded files into the corresponding Redshift tables.
Create new IAM role for database loader
The EmrEtlRunner will copy the files to Redshift using a utility called RDB Loader (Relational Database Loader). For this tool to work with sufficient privileges, you’ll need to create a new IAM Role, which grants the Redshift cluster read-only access to your S3 buckets.
So, in AWS, click Services and select IAM.
Select Roles from the left-hand navigation. Click the Create role button.
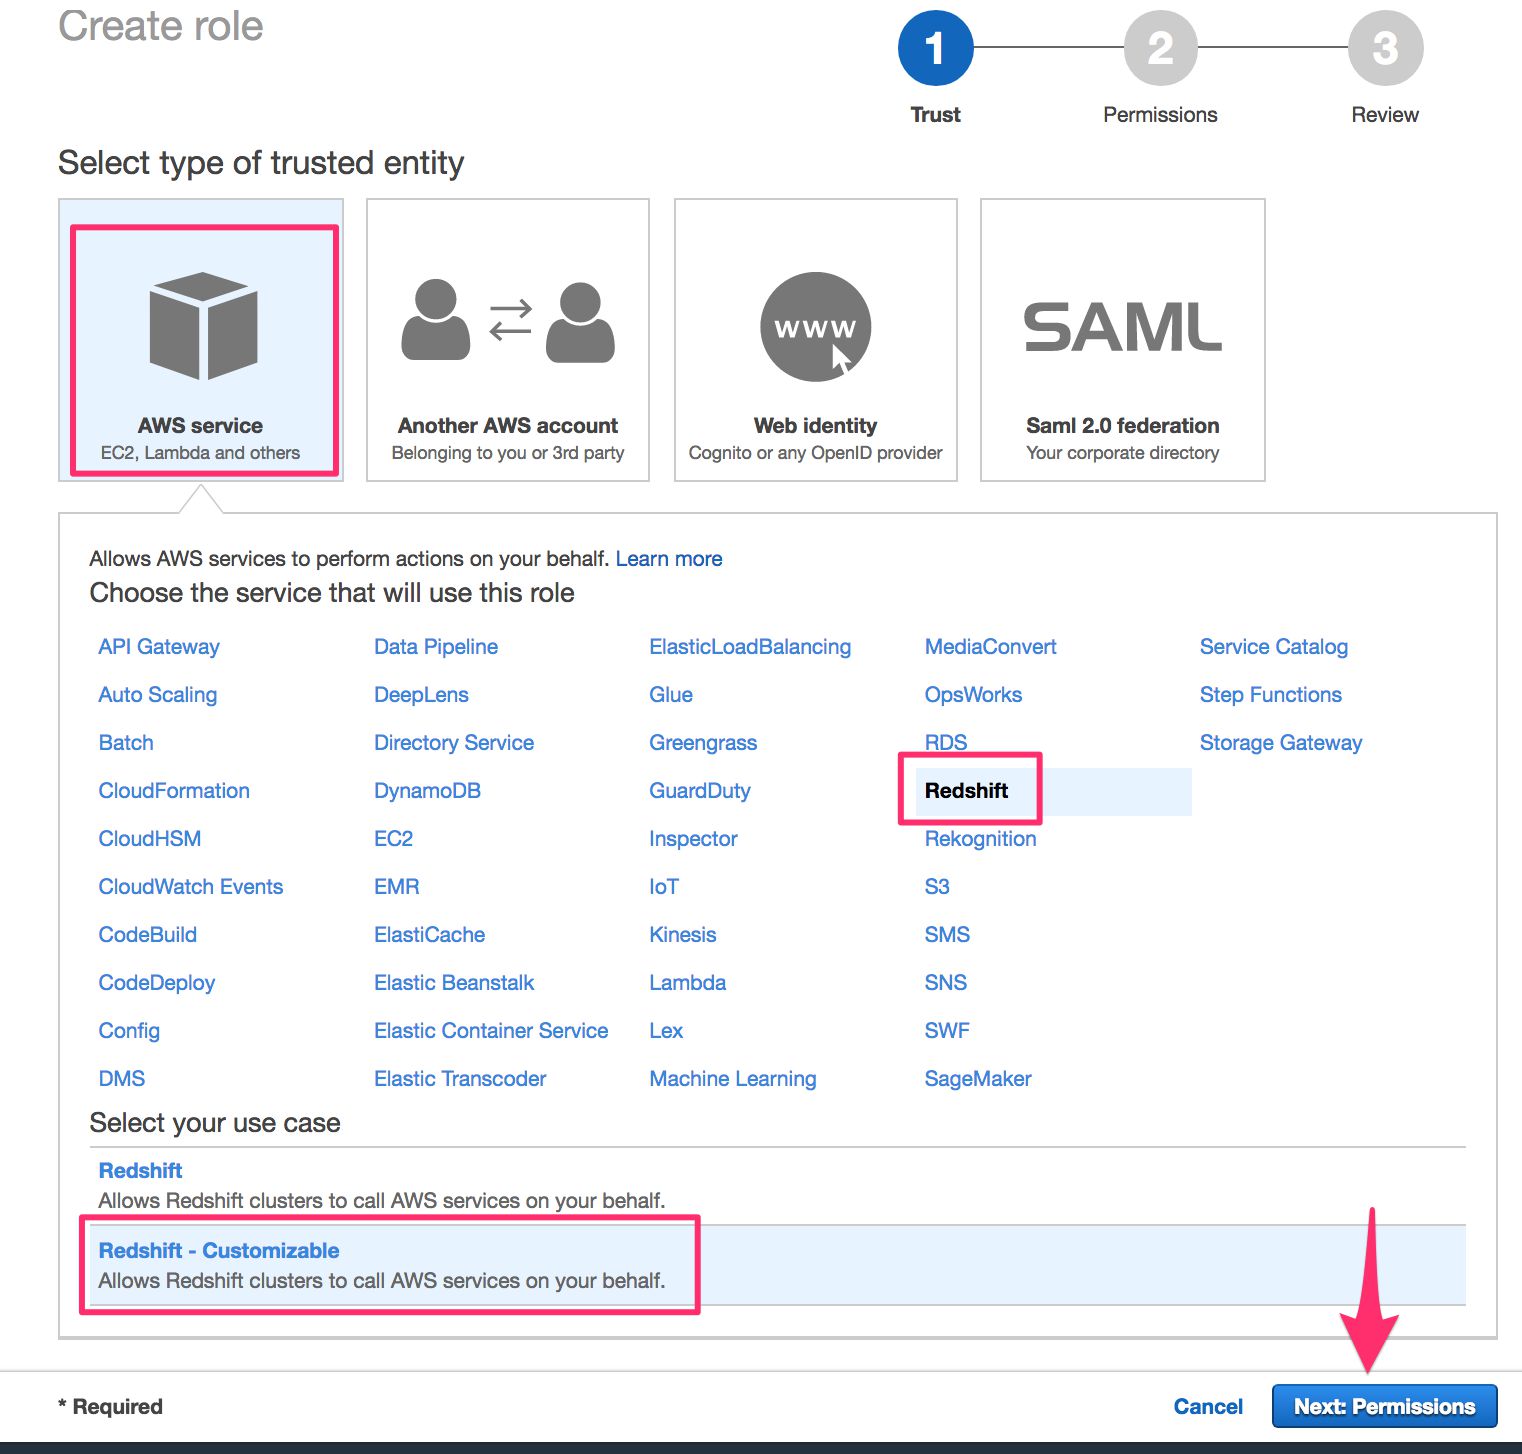
In the Select type of trusted entity view, keep the default AWS Service selected, and choose Redshift from the list of services. In the Select your use case list, choose Redshift - Customizable, and then click Next: Permissions.
- In the next view, find the policy named AmazonS3ReadOnlyAccess, and check the box next to it. Click Next: Review.
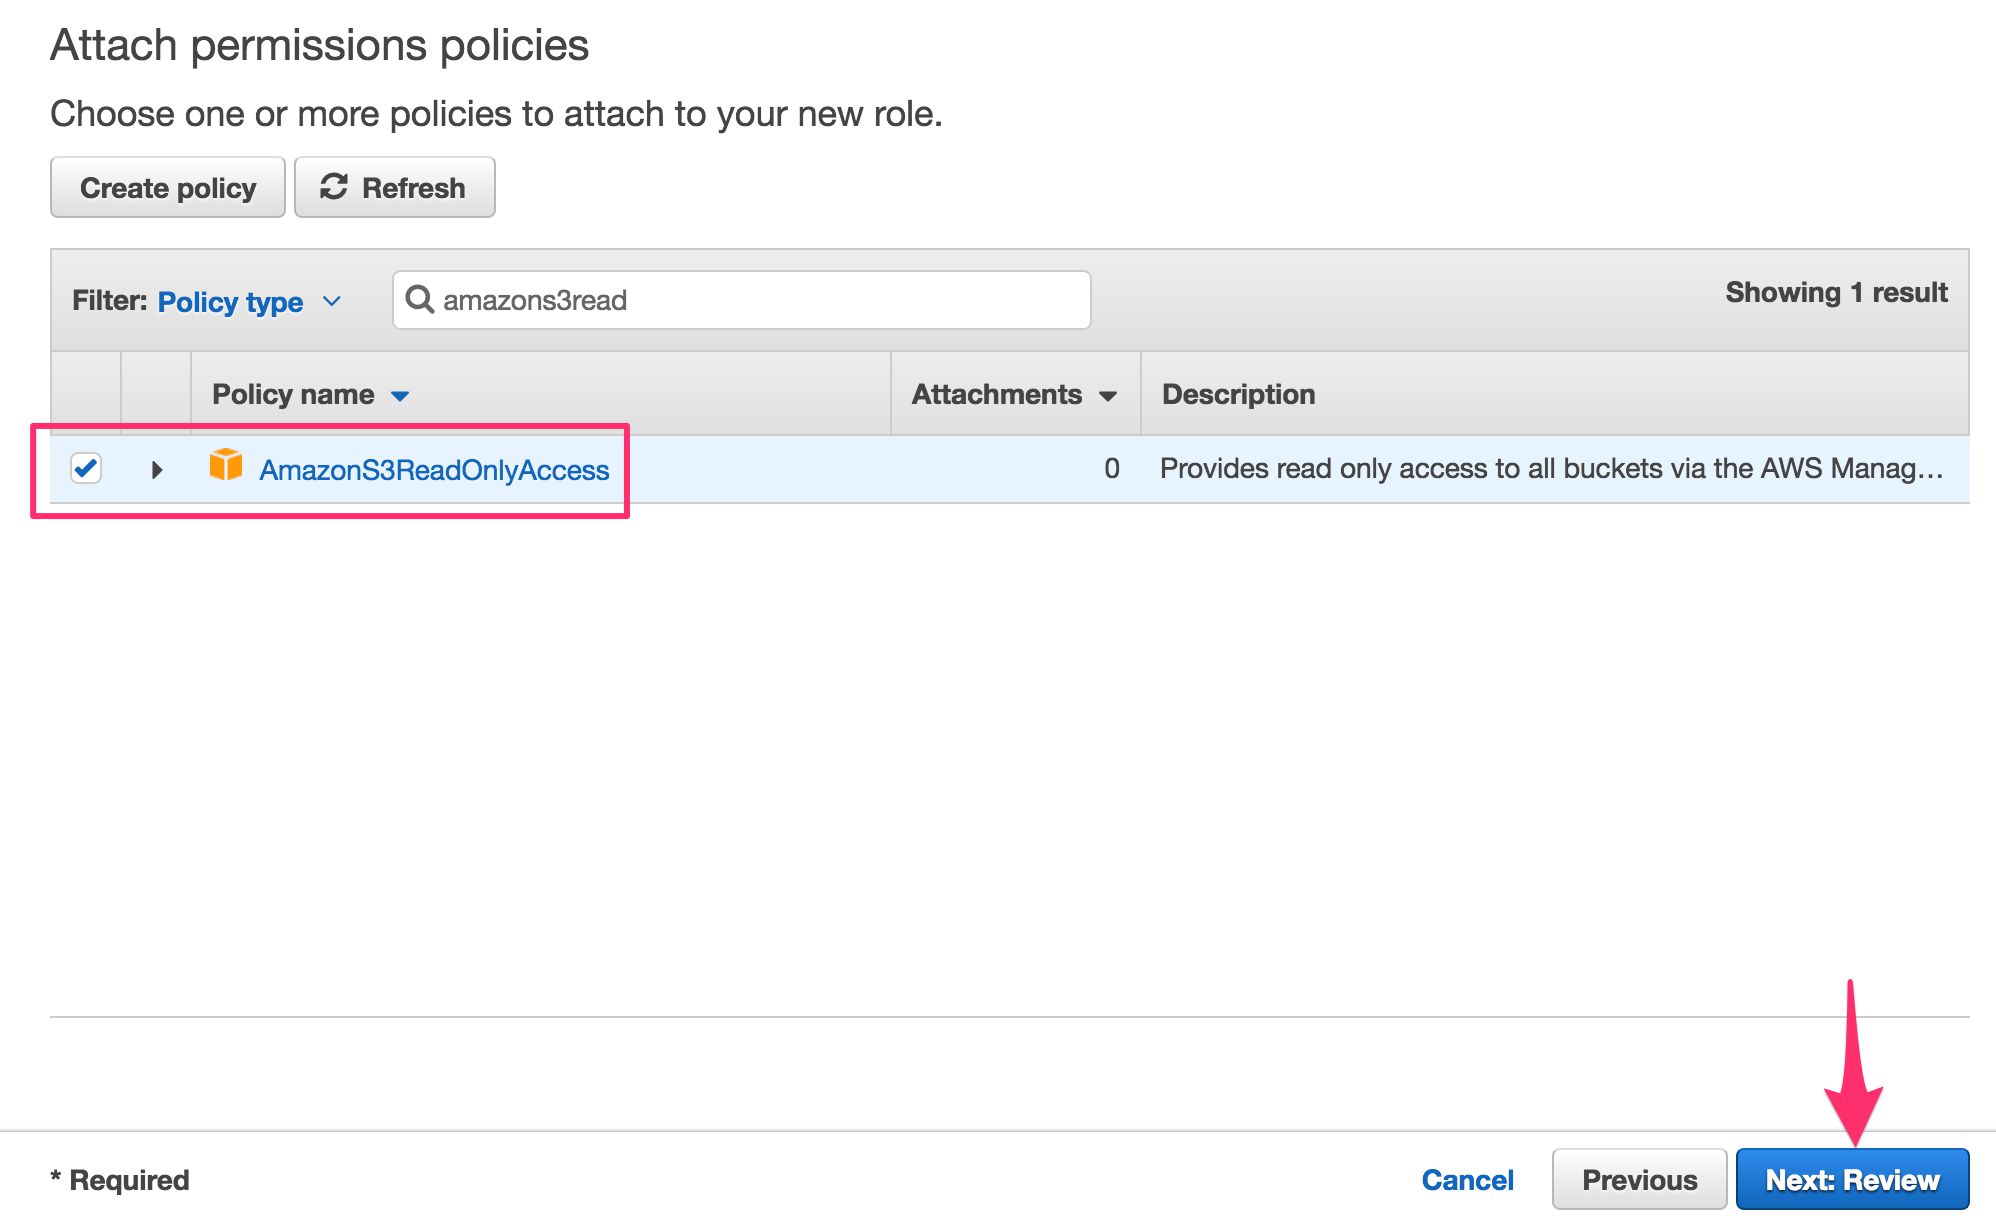
Name the role something useful, such as
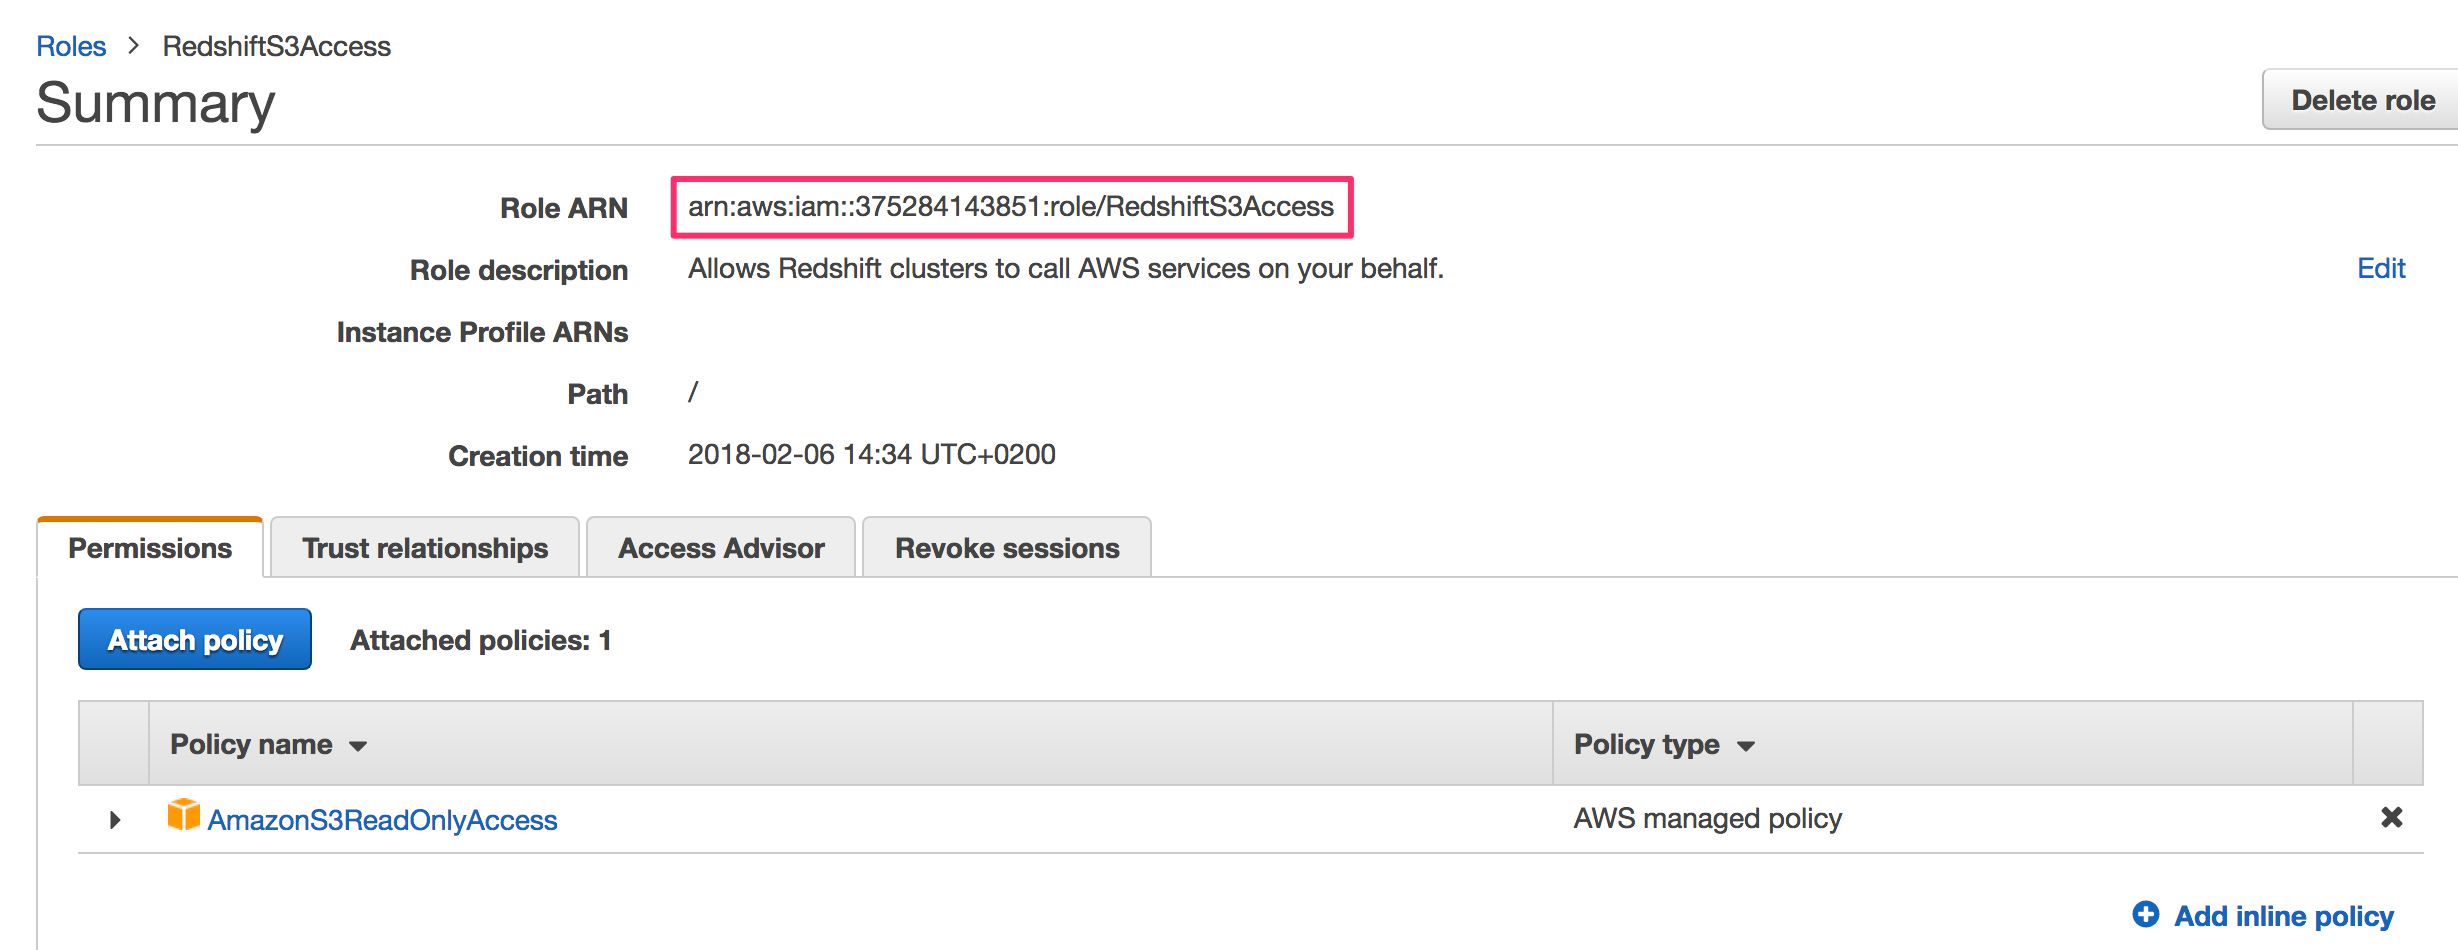
RedshiftS3Accessand click Create Role when ready.You should be back in the list of roles. Click the newly created
RedshiftS3Accessrole to see its configuration. Copy the value in the Role ARN field to the clipboard. You’ll need it very soon.
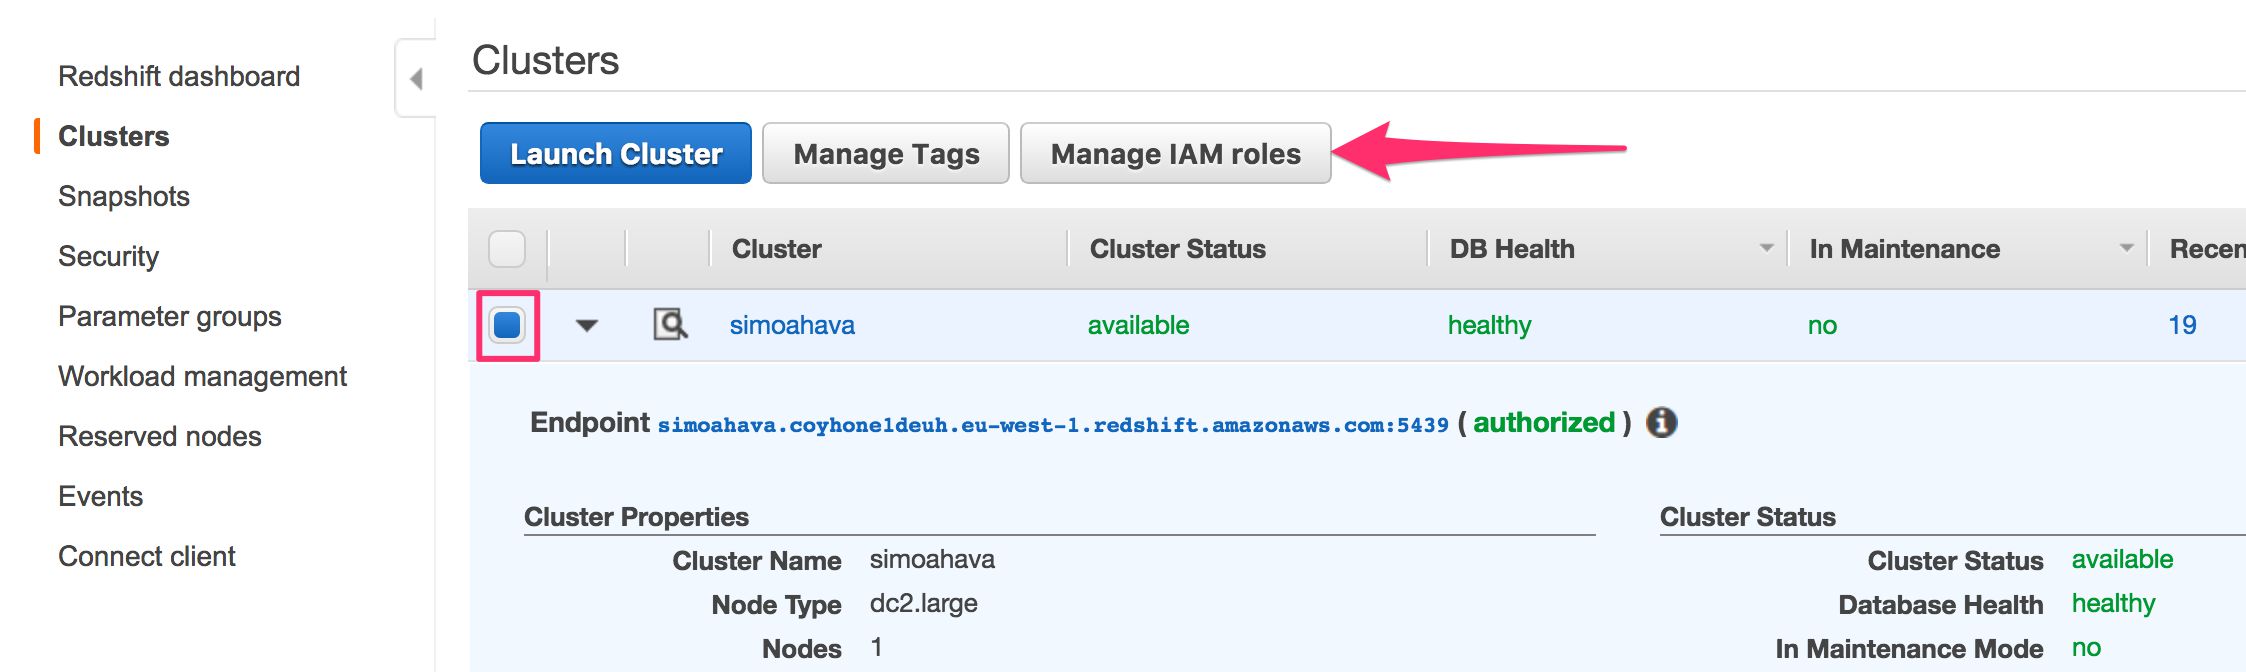
Finally, select Services from AWS top navigation and choose the Amazon Redshift service. Click Clusters in the left-hand navigation to see the list of running clusters.
Check the box next to your Snowplow cluster, and click Manage IAM Roles.
- In the Available roles list, choose the role you just created, and then click Apply changes to apply the role to your cluster.
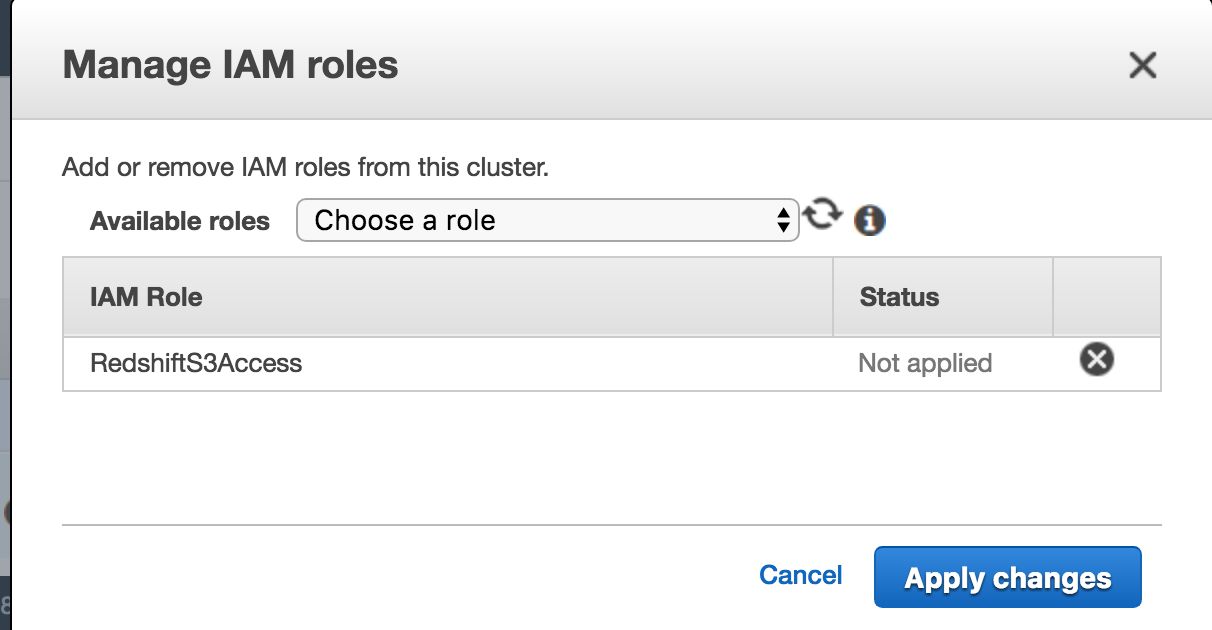
The Cluster Status should change to modifying. Once it’s done, the status will change to available, and you can check if the role you assigned is labeled as in-sync by clicking Manage IAM Roles again.
Edit the Redshift target configuration
If you copied all necessary files back in Step 3, your project config/ directory should include a targets/ folder with the file redshift.json in it. If you don’t have it, go back to Step 3 and make sure you copy the redshift.json template to the correct folder.
Once you’ve found the template, open it for editing, and make sure it looks something like this:
{
    "schema": "iglu:com.snowplowanalytics.snowplow.storage/redshift_config/jsonschema/2-1-0",
    "data": {
        "name": "AWS Redshift enriched events storage",
        "host": "simoahava.coyhone1deuh.eu-west-1.redshift.amazonaws.com",
        "database": "snowplow",
        "port": 5439,
        "sslMode": "DISABLE",
        "username": "storageloader",
        "password": "...",
        "roleArn": "arn:aws:iam::375284143851:role/RedshiftS3Access",
        "schema": "atomic",
        "maxError": 1,
        "compRows": 20000,
        "sshTunnel": null,
        "purpose": "ENRICHED_EVENTS"
    }
}
Here are the fields you need to edit:
- host: The URL of your Redshift cluster
- database: The database name
- username: storageloader
- password: storageloader password
- roleArn: The Role ARN of the IAM role you created in the previous step
All the other options you can leave with their default values.
Re-run EmrEtlRunner through the whole process
Now that you’ve configured everything, you’re ready to run the EmrEtlRunner with all the steps in the ETL process included. This means enrichment of the log data, shredding of the log data to atomic datasets, and loading these datasets into your Redshift tables.
The command you’ll need to run in the root of your project folder (where the snowplow-emr-etl-runner executable is) is this:
./snowplow-emr-etl-runner run -c config/config.yml -r config/iglu_resolver.json -t config/targetsThis command will process all the data in the :raw:in bucket (the one with all your Tomcat logs), and proceed to extract and transform them, and finally load them into your Redshift tables. The process will take a while, so go grab a coffee. Remember that you can check the status of the job by browsing to EMR via the AWS Services navigation.
Once complete, you should see something like this in the command line:
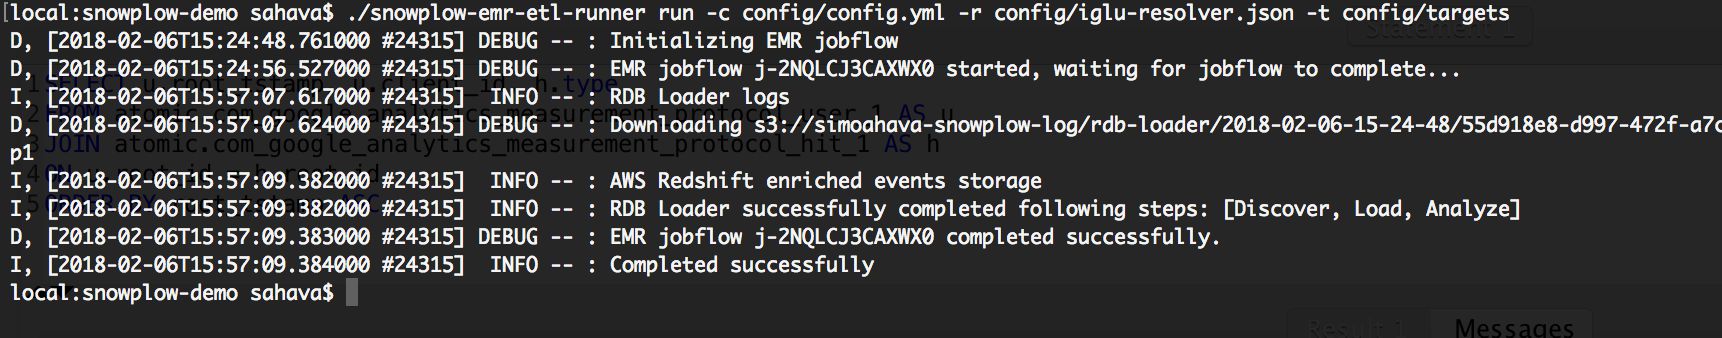
Test it
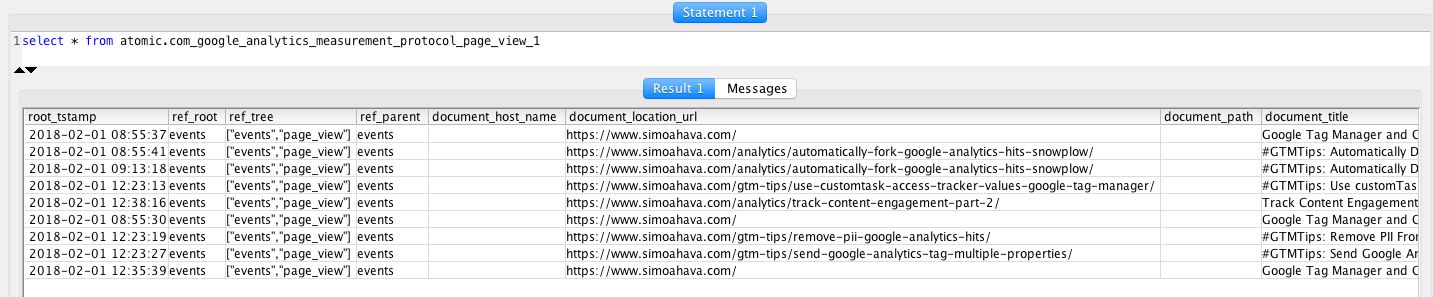
Now you should be able to login to the database using the new read_only user. If you run the following query, it should return a list of timestamps and events for each Client ID visiting your site.
SELECT u.root_tstamp, u.client_id, h.type
FROM atomic.com_google_analytics_measurement_protocol_user_1 AS u
JOIN atomic.com_google_analytics_measurement_protocol_hit_1 AS h
ON u.root_id = h.root_id
ORDER BY root_tstamp ASC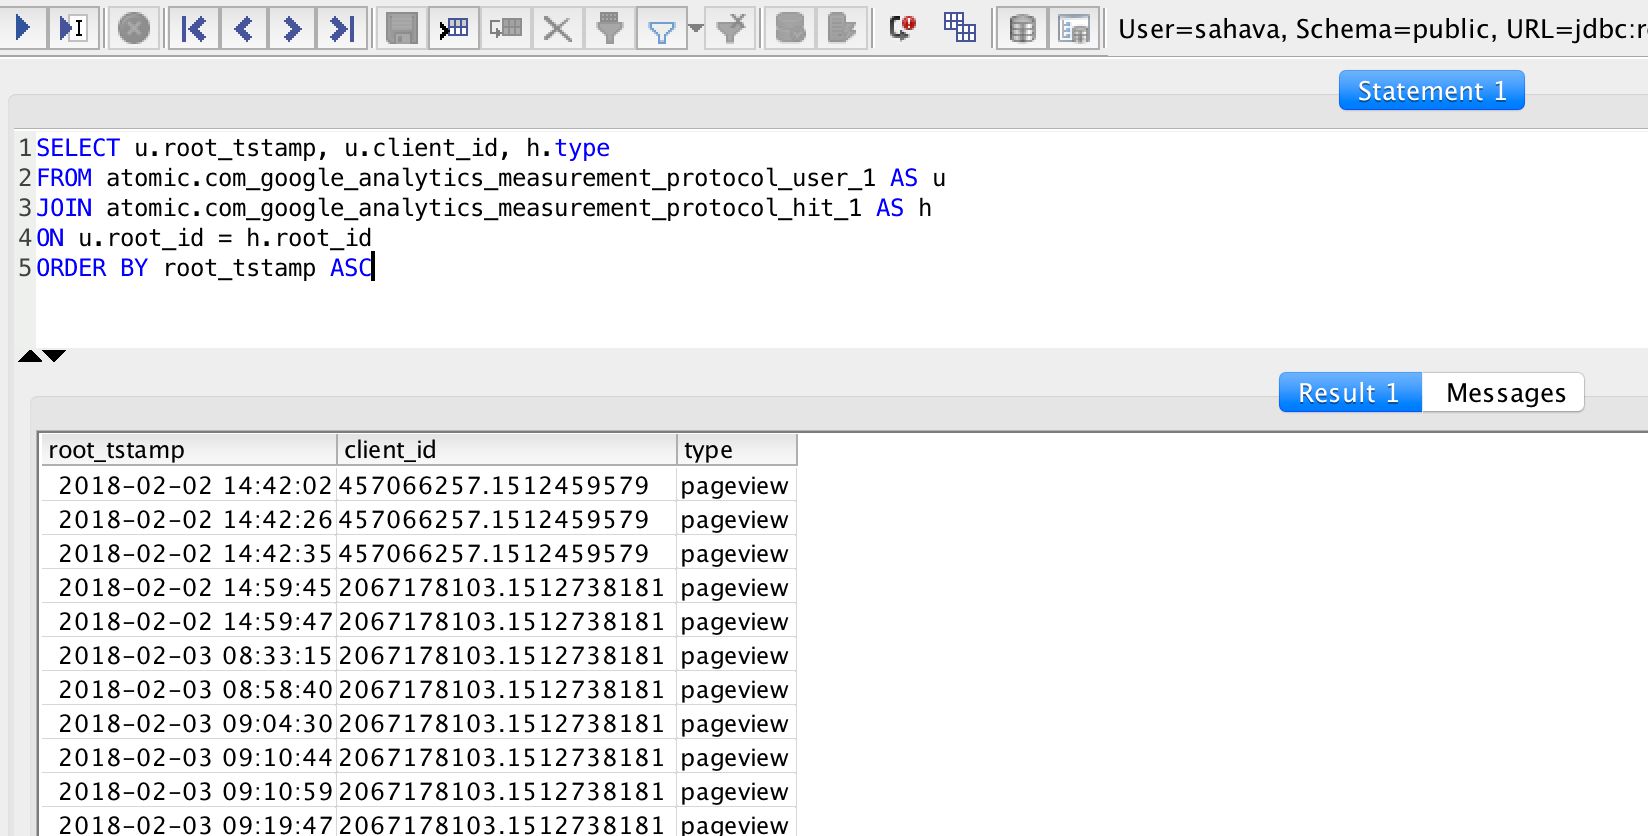
Considering how much time you have probably put into making everything work (if following this guide diligently), I really hope it all works correctly.
Wrapping it all up
By following this guide, you should be able to set up an end-to-end Snowplow batch pipeline.
Google Tag Manager duplicates the payloads sent to Google Analytics, and sends these to your Amazon endpoint, using a custom domain name whose DNS records you have delegated to AWS.
The endpoint is a collector which logs all the HTTP requests to Tomcat logs, and stores them in an S3 bucket.
An ETL process is then run, enriching the stored data, and shredding it to atomic datasets, again stored in S3.
Finally, the ETL runner copies these datasets into tables you’ve set up in a new relational database running on an AWS Redshift cluster.
There are SO many moving parts here, that it’s possible you’ll get something wrong at some point. Just try to patiently walk through the steps in this guide to see if you’ve missed anything.
Feel free to ask questions in the comments, and maybe I or my readers will be able to help you along.
You can also join the discussions in Snowplow’s Discourse site - I’m certain the folks there are more than happy to help you if you run into trouble setting up the pipeline.
Do note also that the setup outlined in this guide is very rudimentary. There are many ways you can, and should, optimize the process, such as:
Add SSL support to your Redshift cluster.
Scale the instances (collector and the ETL process) correctly to account for peaks in traffic and dataset size.
Move the EmrEtlRunner to AWS, too. There’s no need to run it on your local machine.
Schedule the EmrEtlRunner to run (at least) once a day, so that your database is refreshed with new data periodically.
Good luck!