Troubleshoot Google Analytics: 9-Step Program
I’ve had such a blast in the Google+ Google Analytics community. Not only are the people super-duper-nice, but I have the wonderful opportunity of helping people with their Google Analytics problems without feeling obligated to invoice them or ask for compensation for my troubles. I do it because I love to help, because I feel like I have a lot to share with the community, and because I’ve always believed that the more knowledge you share the more you accumulate.
Inspired by the sheer range of problems people have with Google Analytics, which is, in reality, a very complex tool, I decided to write a general guide where I reveal some of my own methods on how to troubleshoot Google Analytics. I almost always follow these steps, and if you give this data rehab program a try, chances are you’ll be more secure with your data in the future.
The Simmer Newsletter
Subscribe to the Simmer newsletter to get the latest news and content from Simo Ahava into your email inbox!
Before we begin
Remember a few things:
1. GA displays symptoms, not actual problems.
Web analytics tools measure data in your marketing channels. They don’t create data, nor do they feed anything back into the site. This means that when your boss comes storming into your room screaming “What the f*** is the problem with this report?” you’ll need to tell the boss that the report just visualizes the problem, and you need time to get to the bottom of it.
2. Every account is unique, every problem is unique
I’ve tried to be as comprehensive as possible, while still being as generic as possible. The thing is that most problems, if not purely technical in nature, have something to do with the business area you operate in. Fluctuations in your market segment, media exposure, new product launch, viral content are all possible causes behind the things you see in your reports. In those cases, remember to approach the data as the business expert. Don’t just trust any crazy blogger who gives you tips on how to fix everything.
3. Be careful with your data.
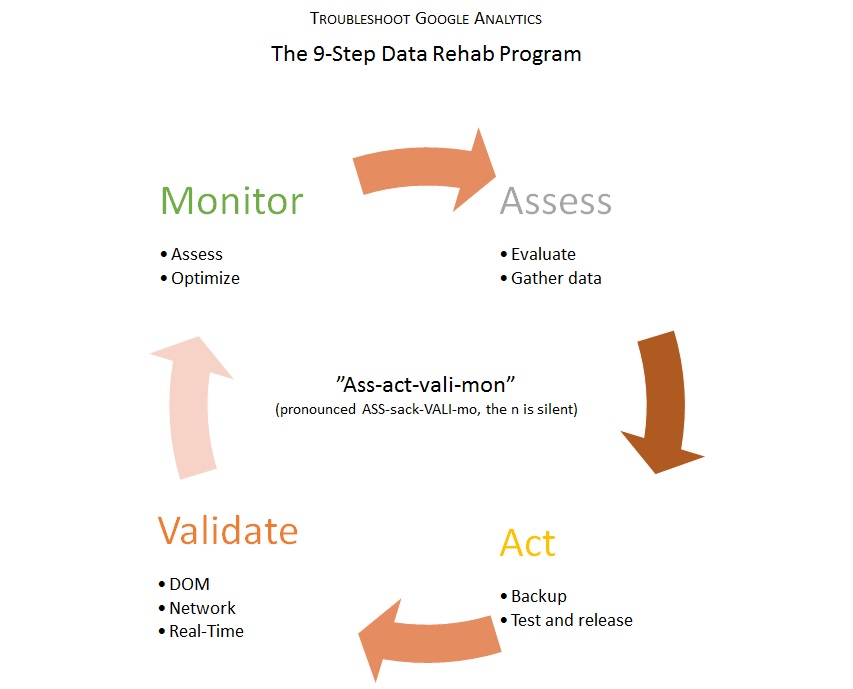
TROUBLESHOOT GOOGLE ANALYTICS
ASSESS
Step 1: Evaluate the problem Step 2: Gather data
ACT
Step 3: Cover your bases Step 4: Test and release
VALIDATE
Step 5: Check the DOM Step 6: Check requests Step 7: Check Real-Time
MONITOR
Step 8: Assess Step 9: Optimize
BONUS Step 10: When all else fails
ASSESS
During assessment, you gather as much data on the problem and its symptoms as possible. Be thorough, and make sure you look at the problem from all angles, not just the ones you’re used to.
Step 1: Evaluate the problem
First thing you have to do is narrow the problem down.
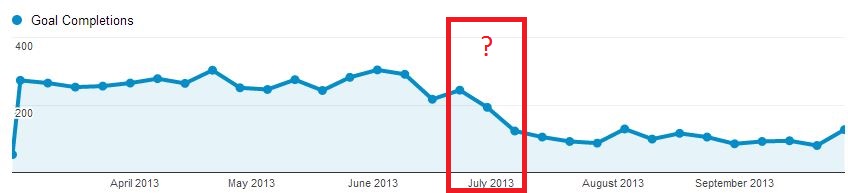
In this example, conversions fell dramatically in July, and they never got back up.
You already know the symptoms, so start following the chain backwards. For example, if your conversion rate is down,
Look at the channels which drive conversions
When looking at the channels, focus on engagement and visitor behavior: has something changed in how people use your site at the same time the conversion rate has gone down?
Once you know the behavior, look at traffic sources
Finally you should be able to draw a line from traffic sources, through behavior, all the way to conversions
So if the symptom is a gradual change in your data, make sure you understand the visitor journey completely.
However, if the symptoms are more drastic (traffic cut off completely, for example), there’s bound to be some technical issues involved.
All in all, try to narrow the issue down so that you can describe it with one sentence, e.g.
The symptom is that conversion rate for Goal X has fallen dramatically while traffic has stayed the same
Here are a couple of leads to follow:
Very little or no incoming data at all
Determine if you’re accidentally running traditional Google Analytics code (search for “_gaq”) with Universal Analytics in place (search for “analytics.js”, though this doesn’t apply with Google Tag Manager)
Abnormal data
If the problem is in your organic search traffic, make sure you’re not being penalized
Check if it’s a trend question, and people are just searching less for your services these days
Step 2: Gather data
Once you have an understanding of where the problem might be, start gathering data.
Note that if the problem is minor and easily identified, you can pretty much skip this step.
By data gathering I mean the following:
Write down the specific date/time the symptoms first occurred
Take screenshots or write down the reports which display the symptoms
Take screenshots or write down the (relevant) reports which do NOT display the symptoms
Make sure you have a step-by-step guide of how to display the symptoms in Google Analytics – this is invaluable in convincing management
Gather intel about changes in your environment.
Remember, you have to link the symptoms to a problem. You can’t just look at a plummeting conversion rate and expect to fix it in the Google Analytics UI (though sometimes the problem is in your Google Analytics settings).
If some metric has suddenly dropped, for example, you should identify who the stakeholder is.
If the problem is in your tracking code implementation, you need to contact whomever manages your page templates.
If the problem is that your servers are unresponsive, you need to contact your IT management.
If the problem is that you’ve been penalized, you need to contact your SEO consultant. And so on.
Look for clues and changes in your environment that could be causing the data problem. Without instigating a witch hunt, try to find whoever or whatever is responsible for the problem.
Note that sometimes (especially when the symptom is a gradual shift in a metric), the problem might be a combination of factors. The more problems there are, the more focus you need.
To apply this knowledge to the problem above (falling conversion rate), my data intel would look like this:
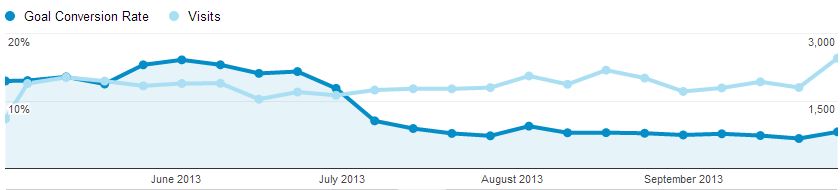
The symptoms began to appear in early **July 2013**. Since visit metrics are stable (see screenshot), the conversion rate hasn't fallen to zero (see screenshot), and we're still receiving conversions along every other marketing channel, the problem is probably in the fact that pageviews for this goal completion are not being sent in every visit to the goal completion destination
ACT
When you’ve reached this point, you know the symptoms, you know the problem, and you’ve gathered enough data to warrant action.
When making changes to your code, your site, your environment, or your Google Analytics account, just remember one thing: a single error can be fatal. Think of yourself as a neurosurgeon operating on Stephen Hawking’s brain. You really, really, don’t want to make a mistake.
Step 3: Cover your bases
Before you do anything drastic, make sure your data is secure.
Backup your page templates and JavaScript code
Make sure you have an unfiltered Analytics profile (a few good words on Google Analytics profiles)
It’s so incredibly important to have a raw Analytics profile where all data is secure. If you make the beginner mistake of creating a filtered profile, with no master profile to get back to, you’re losing potentially heaps and heaps of data.
Remember to back up your templates and code before you make any changes. Of course, if problems have cropped up because of faulty code, you should look at previous revisions (so you should already have backups of your code to roll back to).
Because some data might take from hours (e.g. new pageviews) to days (e.g. eCommerce) to collect, it’s important to have a clear implementation plan.
I always, always, record every change I make to JavaScript code with version control. Sometimes it’s overkill, but I always get a fuzzy feeling of accomplishment afterwards.
Google Tag Manager automatically saves versions of your containers, which is another brilliant reason to start using it.
In this stage, I had determined that the problem was indeed with JavaScript. A JavaScript redirection was set to fire upon page load, which meant that sometimes it fired before the pageview was sent. I wrote new code to make sure the pageview is fired first.
Step 4: Test and release
Another hugely important thing.
To test the change perfectly, you need:
A staging environment with a copy of your site templates the way they are in the live environment
A web property in Google Analytics dedicated solely to gathering data from the staging environment
Check Daniel Weisberg’s guide to building a bulletproof Analytics implementation for ideas.
If the change is something that needs to be tested on real data, you might want to shift to a higher gear and just take the change live instantly. In this case, you need to place extra focus on steps 5–7.
When testing, validate the test with the instructions in the following steps. Make sure the changes you made are actually registered in Analytics.
Note that with some problems, only time will tell if the change was for the better. That’s why it’s even more important to have a raw profile to fall back to if you happened to mess up your implementation.
I would advise going through the following checks with any new code:
Check that your code is good with JSFiddle
Check that your HTML is valid with W3C Validator
Download the Google Analytics Debugger extension for Chrome and use it to debug the implementation
When testing, make sure you do what your visitors would do. Your code should have enough try…catch blocks to make sure that errors don’t decimate your site, but you really need to follow actual use cases when testing the implementation.
If testing a sales funnel, for example, remember to drop out from each stage of the funnel. This way you can see if the funnel has been correctly configured.
When testing a new event, test it with multiple browsers and devices. There are so many browser and device incompatibilities, and you need to be aware of these when analyzing your data.
Here I tested the JavaScript with a number of browsers and a number of devices. I tried to make it as performance-intensive as I could, with multiple page loads concurrently. None of the tests failed, so I was happy with the results
When you’re all done with your testing, and you’re happy with the results, you can publish the changes to your live environment. Just remember to update the tracking code from the test property to the actual live property.
VALIDATE
During testing and immediately after you’ve updated your live environment, you need to make sure that the changes are being recorded in Google Analytics.
Due to some delay in data refresh, you might not see anything for some time in the standard reports. This is why knowing how to use debugging tools and Real-Time reports is really important.
You can find a nice list of debugging tools on the Google Developer pages.
Step 5: Check requests
The first thing to do is go the page where the implemented code changes are running. Use a network debugger to monitor the requests that are sent to the server when loading the page. Firebug, Chrome Developer Tools and IE Developer Tools all have tabs for Network debugging.
You might have to reload the page for data to appear in the Network tab.
When looking at the requests, try to locate any requests for GIF files that are done to Google. You can identify these by looking for the domain “google-analytics.com” in the path or domain information.
If you see no requests, then the tracking code isn’t working and you need to go right back to your code.
For each page, you need to find one request which includes the pageview, and one request for every event that you fire on the page.
You can identify what type of request you’re dealing with by looking at the parameters sent with the request. So first choose the request and then click on Params (Firefox) or Headers (Chrome). With IE it looks like there’s no default option to view parameters, so you have to look at the URL call instead.
In the image below you’ll see what a Universal Analytics pageview in Chrome vs. a Universal Analytics event in Firebug look like.
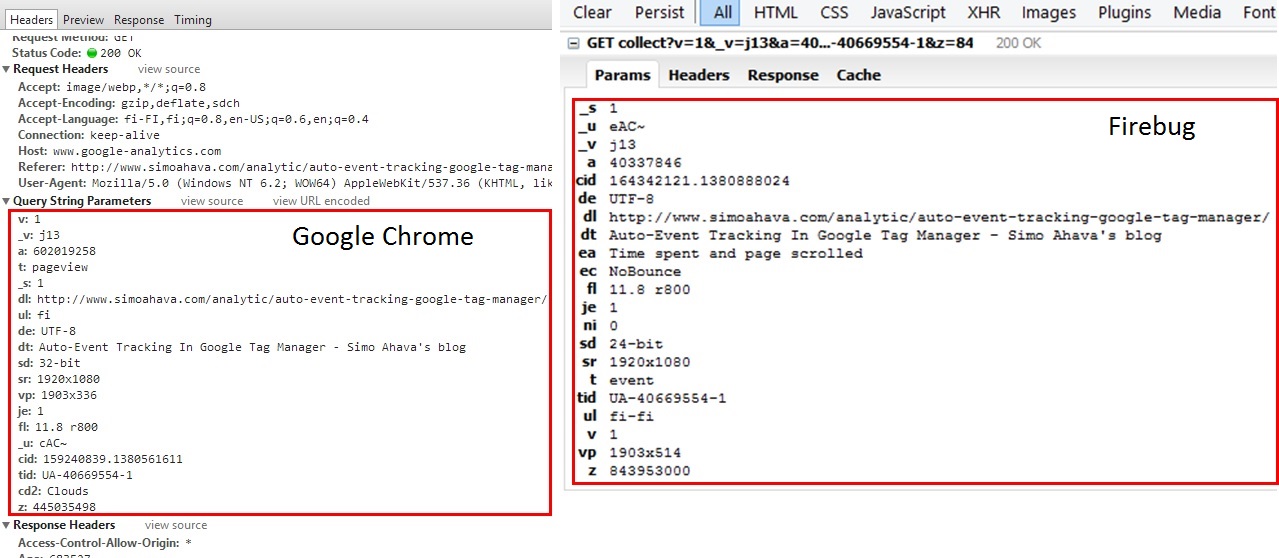
Here are the GIF parameters for Google Analytics and for Universal Analytics.
Step 6: Check the DOM
The DOM, or the Document Object Model, represents all the objects that can be accessed client-side in your web page. This means that if some data is stored in a variable (for example to be sent to Google Analytics), you’ll find it in the DOM.
Check the DOM to verify that your custom functions and variables work. So if data is sent to Google, but it’s not right or the strings are empty, check your DOM to validate at which point you mess things up. Use also the Console tab in your developer tools to look for JavaScript errors.
I really recommend using Firebug, since it has a very intuitive UI for DOM and console inspection.
Here’s an example of what the DOM would look for a couple of custom Universal Analytics variables, which have been pushed into the data layer:
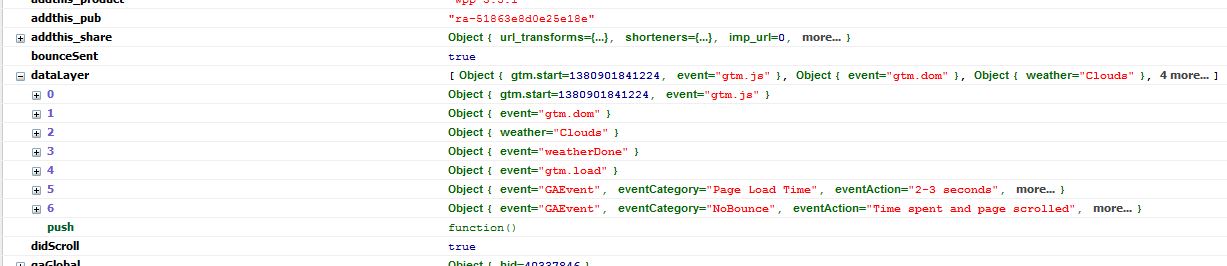
Familiarize yourself with the DOM profile of your pages, so you’ll know where to look for information in the future.
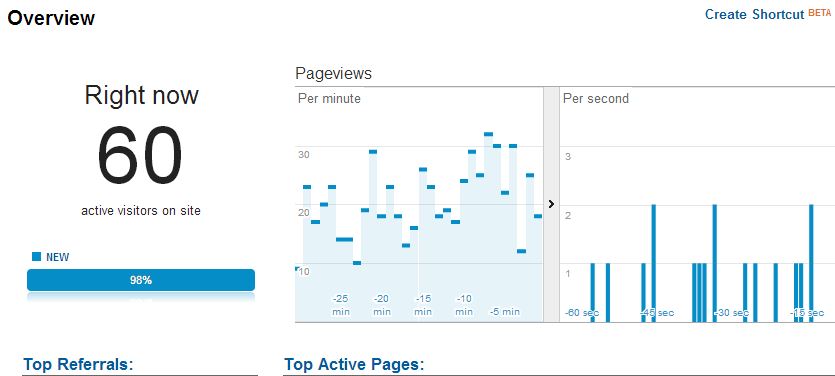
Step 7: Check Real-Time
One of the incredible features of Google Analytics are the Real-Time reports. Seriously, I could spend hours just looking at the traffic come and go.
Real-Time reports show data as it passes through the Google Analytics API. You’ll see visits, visitors, events and so forth, all in a nice graphical interface with a number of segments you can play around with.
So if the GIF requests are passed correctly, and if the DOM is healthy, open Real-Time in the GA interface to make sure that data is actually being collected, labelled, and processed correctly.
Test it by going on different pages of the site with different browsers. Go to pages where there used to be problems, and check that pageviews and events are fired correctly.
Use Real-Time until you’re bored, and then use it some more. It’s a really powerful debugging tool.
MONITOR
Monitoring is crucial if the change you’ve implemented has a gradual effect.
Sometimes the changes you make are realized only after enough traffic passes through your site. This might mean that you don’t know for days, or even weeks, whether or not the change was for the better.
This is why you have to monitor your site effectively, especially in the days following the update.
Step 8: Assess (again)
Go back to the reports you gathered in the first stage of the rehab program. Follow the step-by-step guide of reproducing the symptoms, and verify whether or not the symptoms have subsided.
Identify, locate, and follow any collateral symptoms that might arise due to the changes you made to fix the previous problems. Make sure you have enough evidence to support the fact that the changes you made were necessary, and any further fluctuation in the data is the result of the update you did. It might be that what you did was effectively a lose-lose situation, where you just chose the lesser of two evils.
So when monitoring the data in the few weeks following the changes, look for
Traces of the symptoms you fixed
Related metrics, dimensions, graphs, data that could have been affected by the change
Be prepared to act on your findings, since the relationship between traffic on your website and your Analytics account can be very fragile. Smallest changes in the system might have big ripple effects on the quality of the data you collect.
Step 9: Optimize
Especially after writing new code or making changes in the templates, you might need to go back to your code and optimize it.
Take a look at load times and site performance. Did they change for the worse after your implementation? Are you losing traffic data because you don’t understand (a)synchronicity of JavaScript?
Especially if you’re chaining events or making stuff happen before the pageview is called, you might see problems in the future. If the pageview is not sent, you might be seeing “ghost” visitors, who add to conversions, but who don’t count towards visits. This will have an adverse effect on your conversion rate.
Similarly, if you’re chaining events, you might come across a situation where the previous event hasn’t completed once the next event is already firing. This is a sure-fire way to get events with empty parameters.
I would seriously recommend you to familiarize yourself with Google Tag Manager. It handles event chaining like a charm, and debugging, testing, and implementing code changes is really simple and handy.
BONUS Step 10: When all else fails
If all else fails, contact me and I’ll help you.
My e-mail: simo (at) simoahava.com
Seriously, I love to help. As long as we’re just talking about simple consultation (helping with the steps in this guide, for example), I’m sure I can help. If we’re talking about bigger stuff (such as new implementations, writing custom code, managing your accounts, etc.), you’ll have to contact me through my agency, NetBooster Finland.
Also, remember to check the wonderful Google Analytics Google+ group for help as well.
Conclusion
To sum it all up, here are the key action points in my 9-step data rehab program:
Google Analytics shows symptoms of a problem, not the problem itself
Make sure you have enough data gathered before taking action (for benchmarking as well)
Have a staging environment handy, where you can test development work
During testing and after you go live, make sure you spend a lot of time validating the update
Keep monitoring for a period of time after the update
Google Analytics is a wonderful, complex tool, with so many opportunities for analysing your online presence. However, due to the complexity, there’s a very high probability that you’ll come across problems with your Google Analytics implementation.
Just be methodical in your approach, make sure you record what you’re doing (for further use), Google furiously if you come across any problems, and you should be fine.
And if you just have to remember one thing:
Don’t forget to have a raw data profile for each of your Google Analytics web properties!