
DebugView With GA4 Measurement Protocol
While Measurement Protocol for GA4 is still rather, well, rough, it can be used to augment existing collection quite nicely. Recently, I wrote an article that discussed the nuances of session attribution with Measurement Protocol.
One of the pain points of any data ingestion setup is how to debug it.
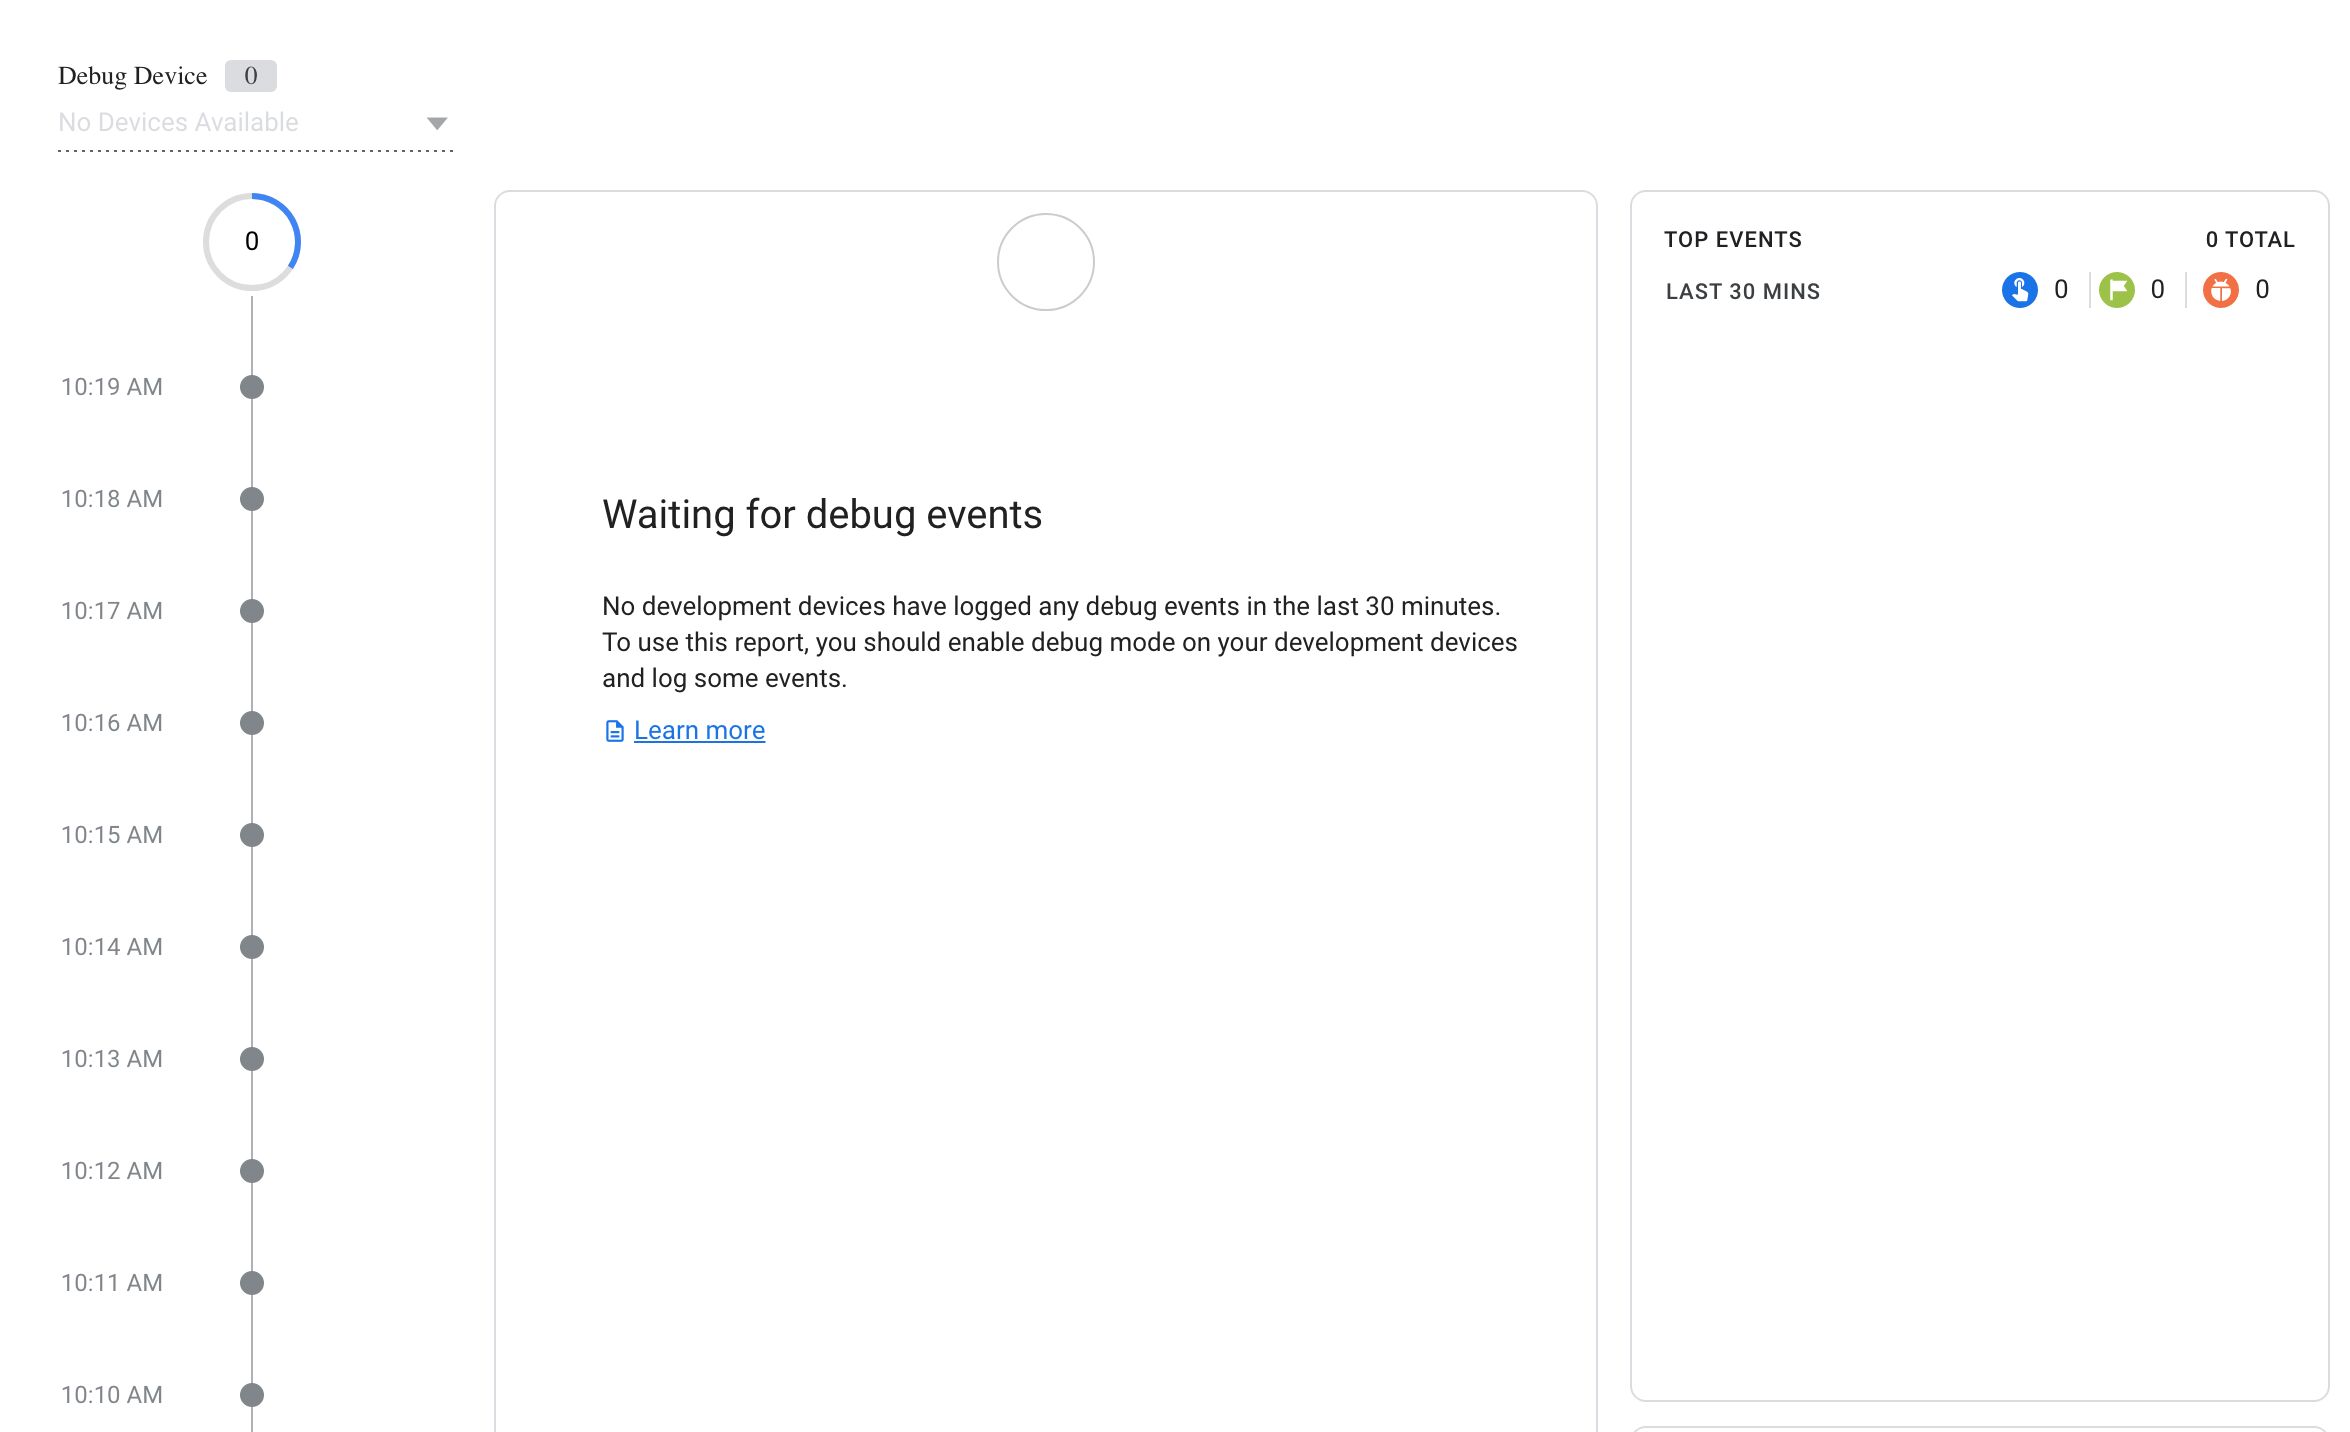
Measurement Protocol hits are not automatically surfaced in GA4’s DebugView.
In this article, I’ll show you how to make those hits pop up in the debug stream. It’s very straightforward to do, and contrary to many of the articles I write, there’s only one caveat that I could think of.
XThe Simmer Newsletter
Subscribe to the Simmer newsletter to get the latest news and content from Simo Ahava into your email inbox!
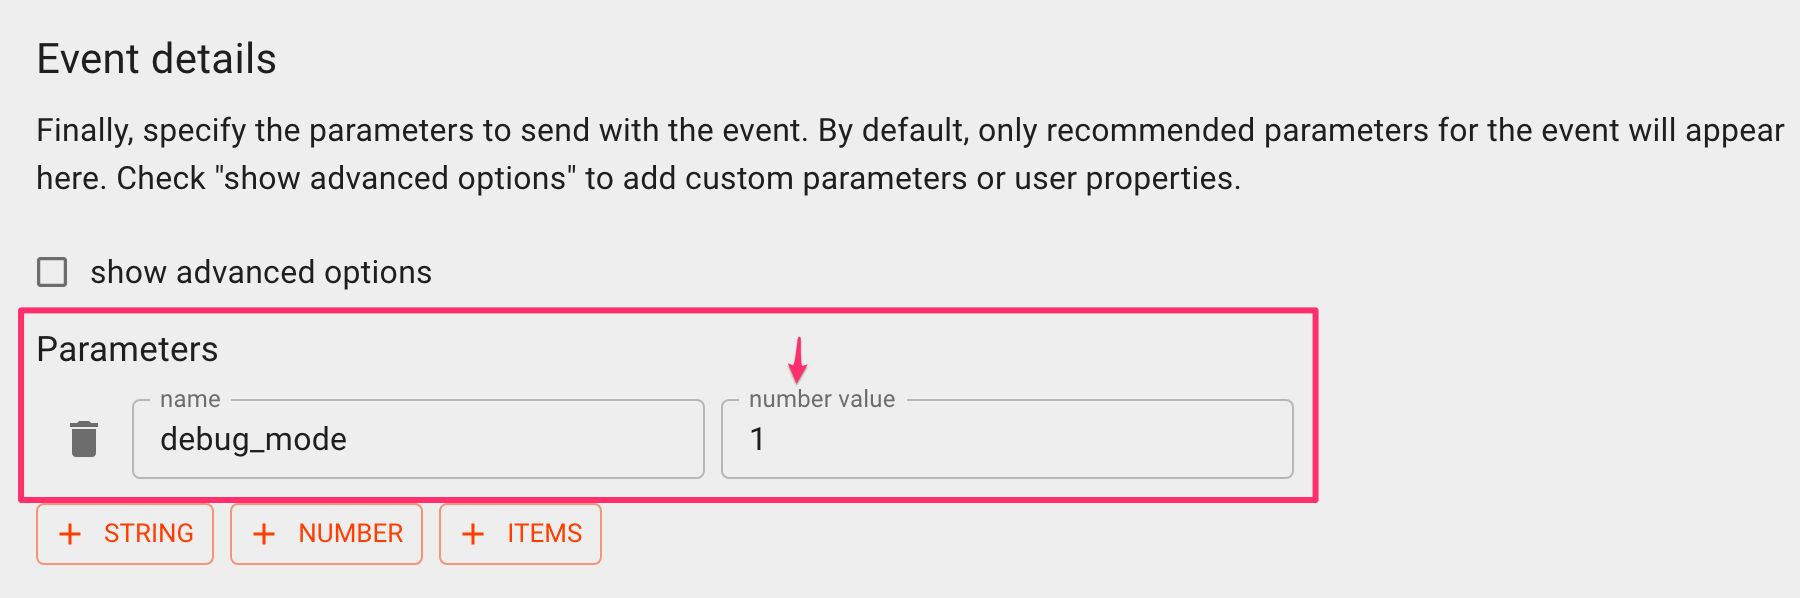
Measurement Protocol hits in GA4 DebugView
The setup is actually very simple. You just need to add an Event Parameter named debug_mode, and set its value to 1. The value can be either a string or a number – I had success with both.
The main caveat seems to be that in order for hits to appear in DebugView, the Client ID or User ID must have prior data collected. When I tried with a Client ID I generated randomly, nothing appeared in DebugView. Only once I sent a Client ID which I knew had prior data collected to GA4, did the hits start showing up in the stream.
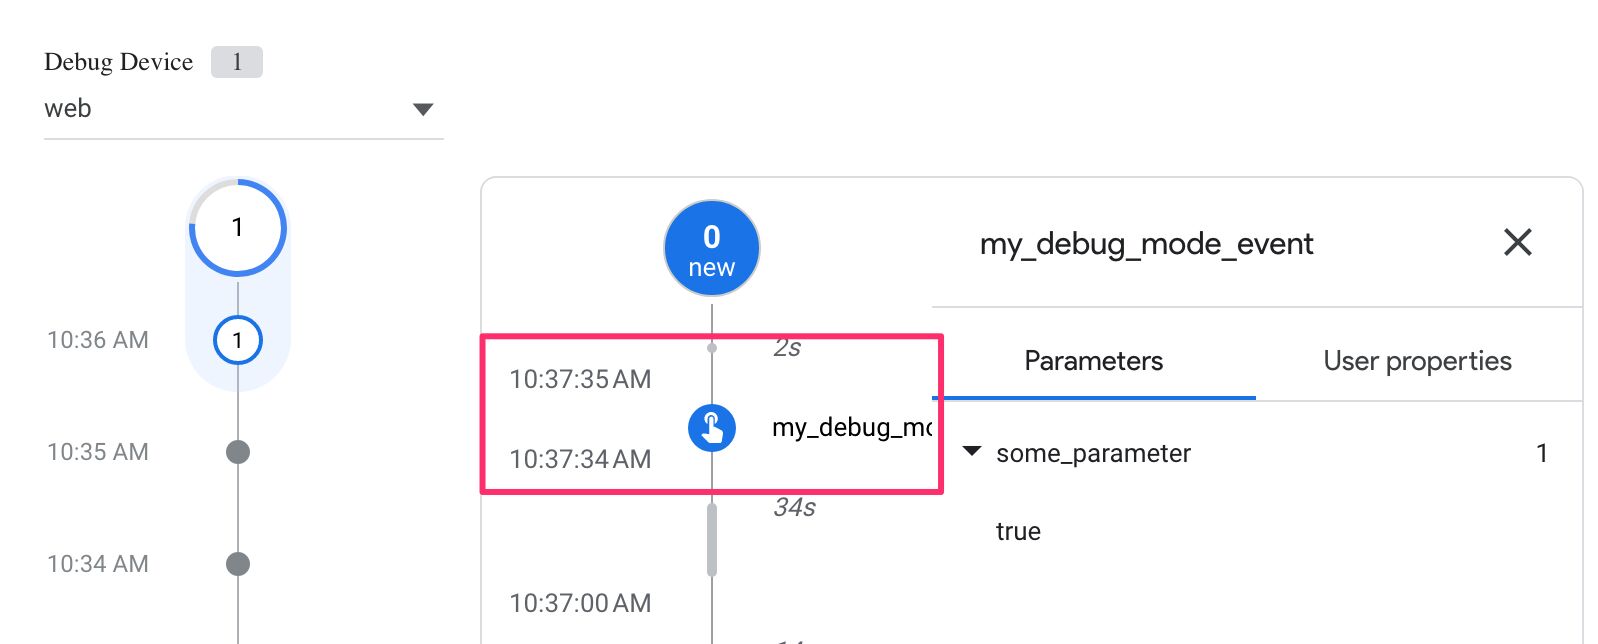
Note that the debug_mode parameter needs to be in every event hit of the batch. Only events that have the parameter will be surfaced in DebugView.
Summary
Simple tips are often the best, and this was hopefully simple indeed.
I would like it better if you could specify debug_mode on the request level instead of event by event.
I’d also like to understand better why events won’t show up in DebugView if the Client ID has no prior data processed – seems like a relic of some previous version of GA4 where this was a requirement for Measurement Protocol in general.
Let me know in the comments if you have questions or additional insight into this functionality.