GTM Auto-Event Listener Debugger v1.1
(Last updated June 2014: Read the latest post on the extension, GTM Sonar v1.2.)
I updated my Chrome Extension, GTM Auto-Event Listener Debugger v1.1. I released the first version a couple of days ago. The extension can be used to debug Google Tag Manager’s auto-event tracking and its compatibility with web page markup.
Download the latest version here.
I did some major changes, and here’s the rundown.
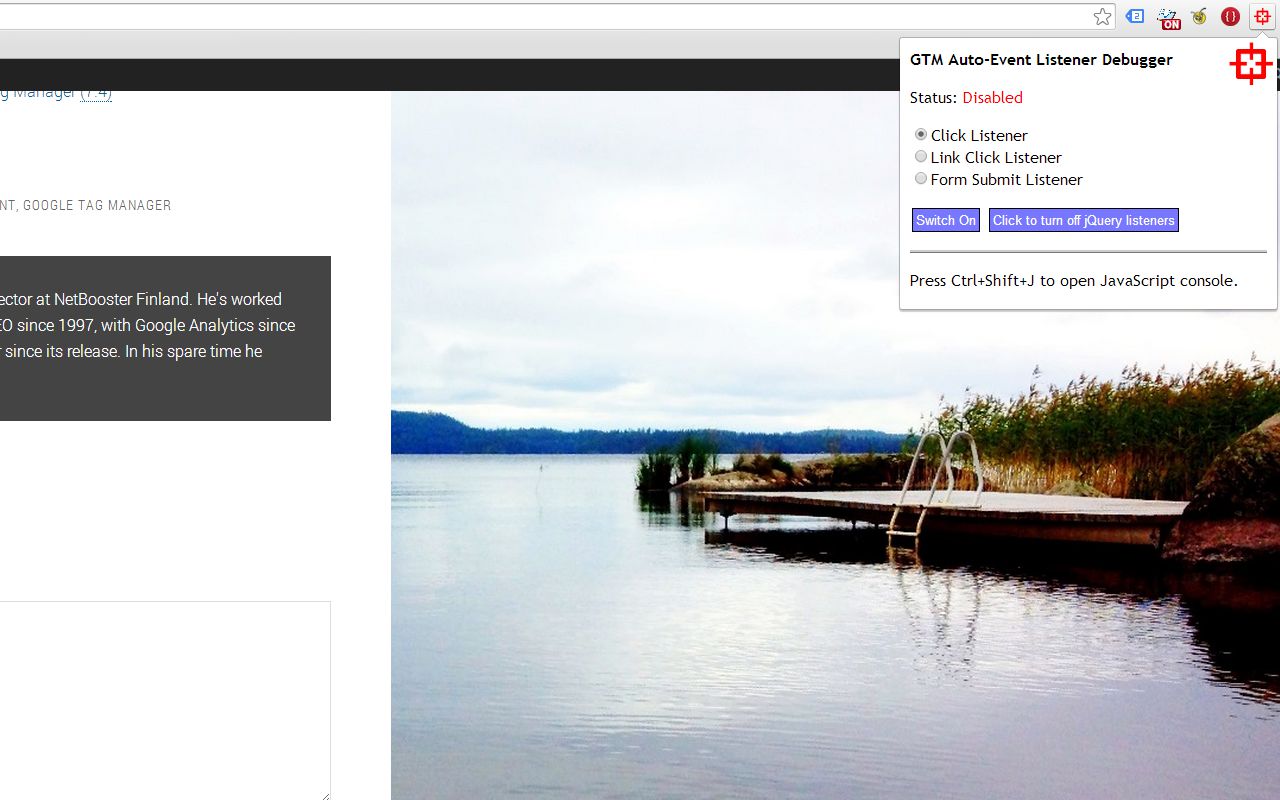
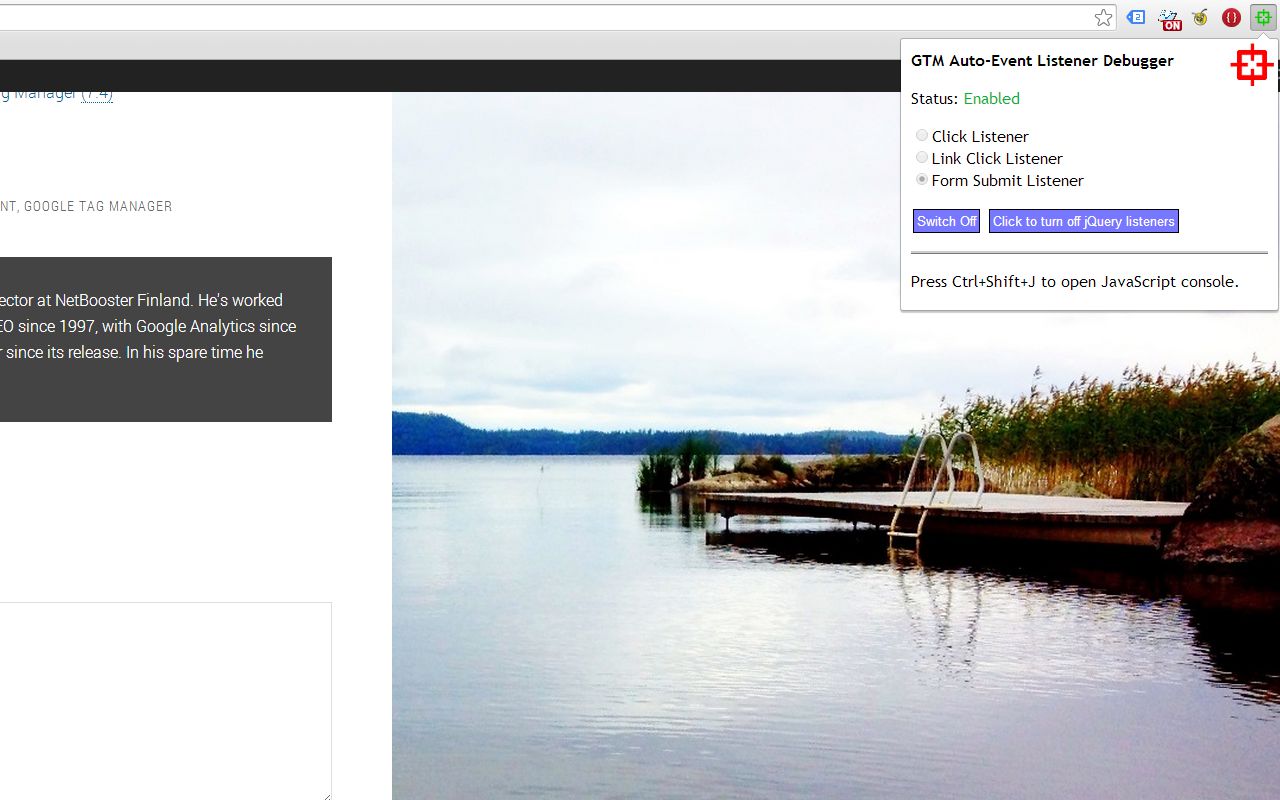
I transferred all debugger actions into a pop-up, which opens when you click the Browser Action. The debugger is still tab-specific, so it can have different states in different tabs. Also, The Browser Action still turns green when the debugger is enabled for current tab.
I added a radio button list for you to choose the listener type from. I didn’t want to enable multiple listeners at once, because halting the click event had implications for form submits as well. The three listeners are now:
- Click Listener : Halts default action of all clicks on page, and upon clicking on the page, pushes gtm.click and other data into `debugDL`

- Link Click Listener : Halts default action of all clicks on page, and if clicked element is a link, pushes gtm.linkClick and other data into `debugDL`
- Form Submit Listener : Halts default action of all forms on page, and upon submitting a form, pushes gtm.formSubmit and other data into `debugDL`
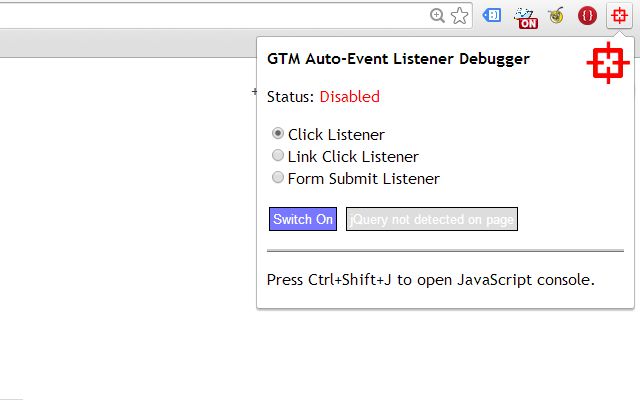
I added a switch with which you can kill all jQuery binds on the page. The switch is only available if jQuery is found on the page. When you click the switch, all jQuery handlers are cancelled. The idea behind this is that by killing the event handlers, you can verify if jQuery is preventing the listeners from working. I did this simply because more often than not this has been the problem. The switch can be used just once. To get the event handlers working again, you need to reload the page.
Basic functionality is still as it was, though I’ve made some improvements here and there. It still needs quite a bit of refactoring, as I’m pretty sure my JavaScript is just too complex. The visuals could be improved as well, but I’d rather have the basic stuff work first and only then start twiddling with the decorations.
The Simmer Newsletter
Subscribe to the Simmer newsletter to get the latest news and content from Simo Ahava into your email inbox!
Screenshots

Information about the version upgrade
Be sure to download the extension here, and read the release notes. I’ve added a short bit on version history into the release notes (along with more detailed instructions), so you can now follow the development cicle as well.
The to-do list now contains the following items (thanks for your feedback!):
Improve error handling
Show badge icon which represents number of objects in
debugDLShow a tooltip or some other visual signal when an event is successfully pushed into
debugDL
Let me know if you have any improvements in mind.
Halting the default action of clicks and submissions will not be enough on some pages. With complex sites, there’s usually a lot of other JavaScript interfering with this simple script, so no matter what you try to do, the clicks and submits still redirect you. In those cases, the only thing I can suggest for you to do is try to hit ESC or click the STOP button in your browser as soon as you’ve performed the action. This should be enough to cancel the action but still enable the data to be pushed into debugDL.