#GTMtips: Debugging Tag Execution Properly
One of the unfortunate misunderstandings regarding the wonderful Google Tag Manager Preview mode is what it actually means when GTM reports “Tags Fired On This Event”. For many, this seems to indicate that whatever code the Tag was meant to execute also completed successfully. However, this is not the case.
XThe Simmer Newsletter
Subscribe to the Simmer newsletter to get the latest news and content from Simo Ahava into your email inbox!
Tip 19: Debugging Tag execution vs. actual requests
Let’s get the distinction straight right away:
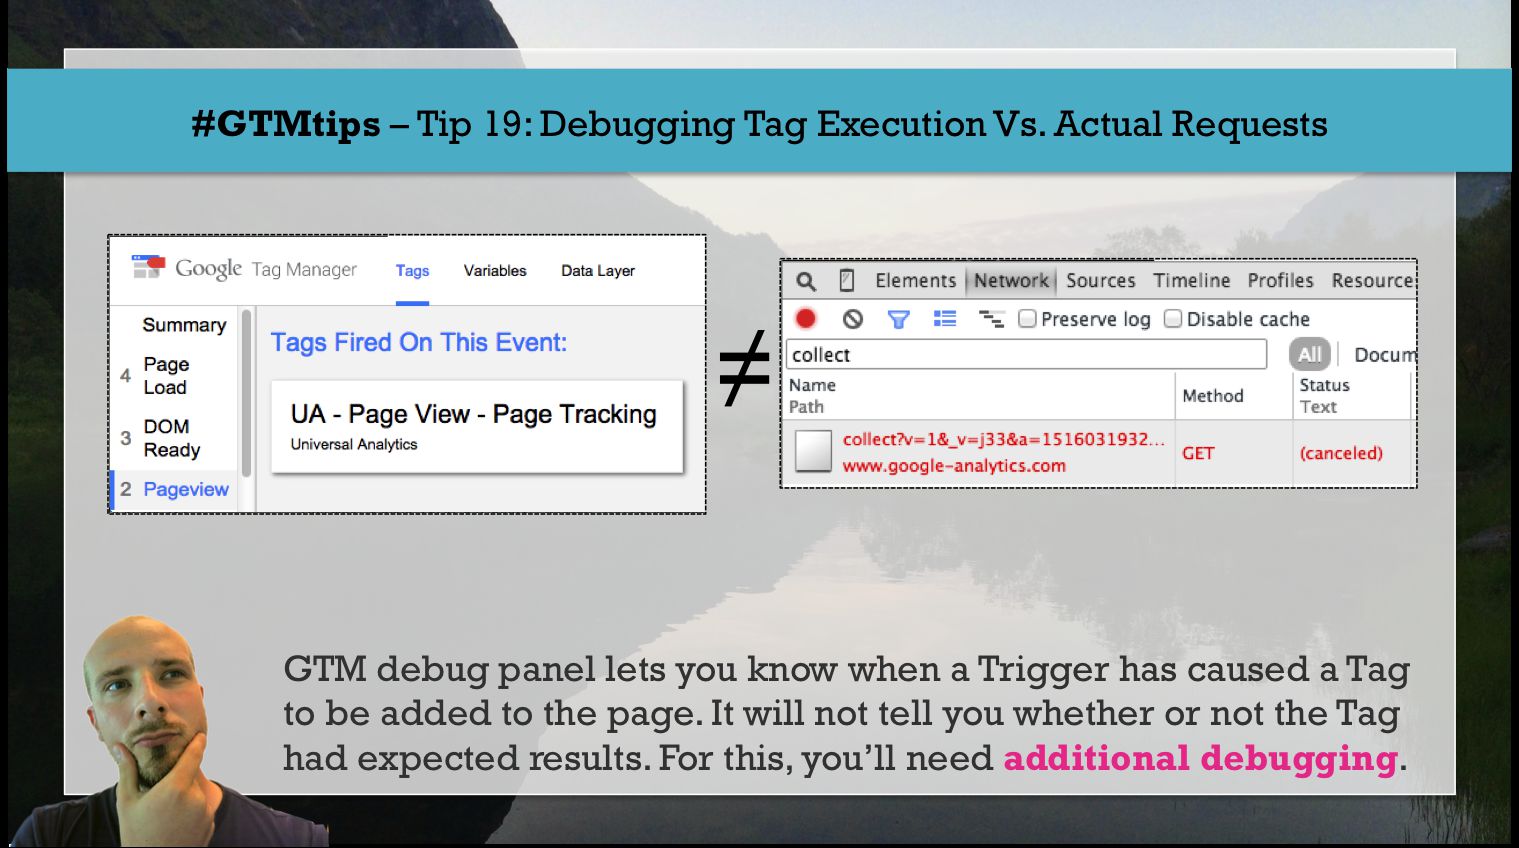
Google Tag Manager debug panel tells you when a Trigger has been invoked by certain conditions, and the Tag which uses this Trigger has its JavaScript injected into the Document Object Model.
This does not mean that the expected result of the Tag code (e.g. fire a pixel, load an iframe, perform arbitrary JavaScript) has completed successfully.
This is a very clear distinction, and it basically means that looking at the debug panel alone, you cannot debug whether or not the execution of your Tags is performing expectedly.
For example, if you have some Google Analytics blocker running in the browser, GTM’s debug panel will tell you that the Tag has “fired”, but the browser will prevent the Tag code from completing its request to Google Analytics servers.
How to debug the whole process
The best way to ensure that Tags are firing correctly is to pay attention to two things: network requests and the JavaScript console.
The former will tell you if requests are successfully completing, and the latter will tell you if the JavaScript has errors in it (or other, unexpected behavior).
Network requests can be debugged with your browser’s Developer Tools:
-
Chrome / Mac: Open the Developer Tools with Cmd + Opt + I and navigate to “Network”
-
Chrome / Windows: Open the Developer Tools with F12 and navigate to “Network”
-
Firefox / Mac: Cmd + Opt + Q
-
Firefox / Windows: Ctrl + Shift + Q
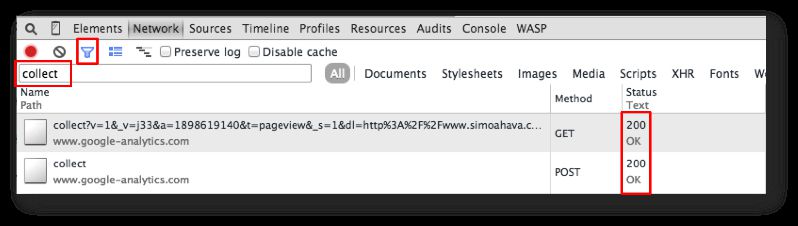
What you’ll see is the list of requests your browser has made during the lifespan of the page. You can locate a specific type of request using the filter feature (Chrome). For example, to see hits to the Universal Analytics endpoint, I would filter for requests with the word “collect”. That’s because collect is the URI where all Universal Analytics hits are dispatched to.
Next, I’ll focus on the Status column. Typical errors are e.g. 404 (not found) and 500 (internal server error). A successful request would have the response code 200.
If you want an even clearer view to what’s happening on the site, complete with an analysis of dataLayer state, take a look at my favorite debugging tool, WASP.
To debug JavaScript errors, open the same Developer Tools, but navigate to Console instead. You should see a verbose output of all JavaScript errors that the current page has dispatched, and you might see some errors in your GTM tags as well.
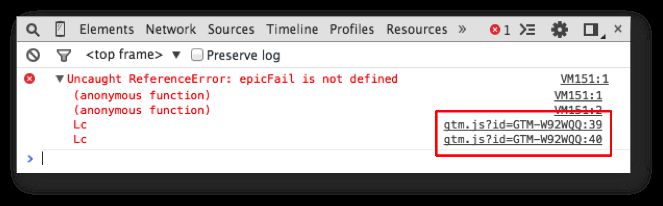
Do note that debugging JavaScript errors can be pretty difficult especially if you use frameworks like jQuery. You will have to plough through the call stack trace (if there is one), and even then the results might be inconclusive. That’s why it’s a good thing to cooperate with a developer who understands the existing scripting conditions of your website, and who can provide input on which errors are related to which scripts.
So, remember:
Debug Panel tells you when a Trigger causes a Tag to be injected on your site.
But:
Network debugger and JavaScript console tell you if the Tag code executed with expected results.