Track Content With Enhanced Ecommerce
My fingers have been tingling to write this article. Ever since I implemented Enhanced Ecommerce on my blog a couple of weeks ago, I’ve been getting such an impressive amount of useful data that it’s mind-boggling.
In this article, I’ll walk you through the steps I went to implement the solution, along with examples of the data I can now access through Google Analytics’ reporting interface. As you might have guessed, if you’ve read my articles before, I implemented Enhanced Ecommerce with Google Tag Manager. Note, this is not a step-by-step guide, but should rather provide inspiration for you to think out-of-the-box when it comes to Google Analytics’ features.
XThe Simmer Newsletter
Subscribe to the Simmer newsletter to get the latest news and content from Simo Ahava into your email inbox!
Ecommerce and content, huh?
You might be surprised at what the premise of this article is. Usually, Ecommerce plugins are used to track transactions on your web store, so what does this have to do with content? Well, I don’t have a web store on my blog, but every reader who reads an article is valuable to me. If they are valuable, there must be some way to measure their value, and perhaps use this data to benchmark against future products (i.e. articles) I want to create.
Enhanced Ecommerce gives you a bunch of useful reports, which you can use to track not only store transactions but any kind of user interaction on your site. You just have to see your site in terms of funnels. This means that you need to translate Ecommerce terminology to match the conceptual framework of your site, whether it’s a blog, a web store, a news portal, or a brand site.
On my blog, the terminology ended up something like this:
-
Product: A blog article.
-
Product price: The number of words in the article.
-
Product impression: At minimum the title, but usually title + ingress combination of articles on various category pages, and in article sidebars.
-
Product list: A page or widget which holds a number of Product impressions. For example, my home page, category pages, tag pages, and related posts lists are all considered Product lists in my Enhanced Ecommerce setup.
-
Product list click: A click action on an article title or “Read more…” link in the product lists.
-
Product detail view: When the article is loaded.
-
Add to cart: When scrolling begins on the article. I can assume that the reader wants to “buy” it if they start scrolling.
-
Checkout: The Checkout funnel in my setup is based on scroll tracking. The first step is when the reader reaches one third of the article, the second step when they scroll two thirds, and the last step is when the article end is reached.
-
Purchase: Purchase occurs when the checkout funnel is passed through, and a minimum of 60 seconds has elapsed since the article was loaded. This is an arbitrary number of seconds I simply chose to weed out casual readers from actual readers.
UPDATE: Thanks to an idea from Robert Petković, I updated the collection method with Product Detail impressions and Add To Cart actions. These were missing from the first version of this article. I also changed the checkout funnel to reflect scroll depth.
How to set it up
First, here’s the Git repository link for this solution: eec-gtm.
I’ll reveal a dirty secret from the get-go: I scrape the DOM for my setup. It’s definitely not the most robust way to go, but since I’m the developer, the marketer, the owner, and the content creator on my site, I can be safe to know that any changes to the page template are totally under my own control.
The way it SHOULD work is to leverage dataLayer. You have a number of options when doing this. You could, for example, store every single product on the page into dataLayer when the page is rendered, and then pick the relevant objects when impressions are loaded, or when user actions like clicks take place. Another way to go is to store the products in some other global JavaScript variable, which is, perhaps, a bit easier to access, but it does pollute the global namespace which should generally be avoided.
Anyway, I scrape. I’m a scraper. I did it for science, for progress, for technology. And because I was a bit lazy and didn’t want to customise my WordPress hooks. But, in short, here’s how my setup works.
1. Product impressions
On every page which has product lists, I build the ecommerce.impressions Array as soon as the DOM has loaded. In this Array, each object is a single article title (+ ingress) that’s visible in one of the possible product lists. Product lists on my site are:
-
Main posts - the home page listing
-
Category posts - if a visitor has chosen to see all posts in a given category
-
Tag posts - if a visitor has chosen to see all posts tagged with a specific tag
-
Search results - the list of results you get if you use internal search
-
Recent posts - the “Recent posts” widget in the sidebar
-
Recent comments - the “Recent comments” widget in the sidebar
-
GTM Tips - the “GTM Tips” widget in the sidebar
List position is determined by the order of posts in the list. An individual product object would look something like this:
{
    'category' : 'analytics',
    'id' : 'TriggerGuideForGoogleTagManager',
    'list' : 'Main posts',
    'name' : 'Trigger Guide For Google Tag Manager',
    'position' : 2
}
As you can see, it’s very simple. category is the WordPress category assigned to the post (there’s only every one category on my articles), id is a truncated version of the article title, name is the name of the article, and list and position define where the impression was listed.
So for every impression, I push an object like above into the Array. I also have a Promotion view for my “Were you looking for my GTM posts?…” info box on the home page of my site, but this hasn’t proven very useful, so I might remove it.
On any given page, the Array might look something like this:
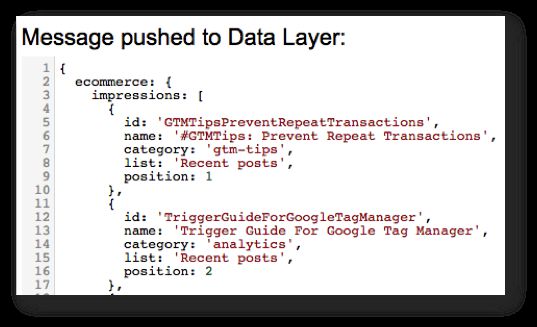
A very simple setup for a very simple purpose. I send this Array with a Non-Interaction: True Event tag, because I don’t want to delay my pageview from firing until the impression Array is built, and I don’t want impressions to affect bounce rate.
2. Product list clicks
I track product list clicks using a Link Click trigger. When someone clicks on an article title or the “Read more…” link on the product list, I push details about the clicked product into dataLayer, together with the ‘productClick’ value for the ‘event’ key, which then triggers an Event tag.
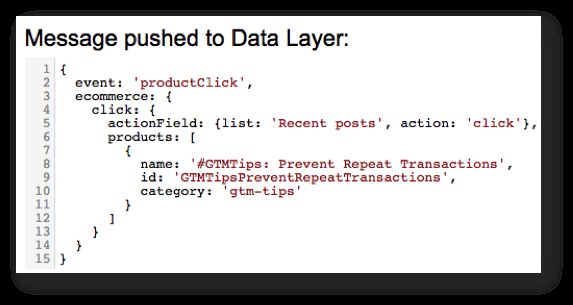
Firing this event lets me see the effectiveness of my product lists. It gives me information about how the different lists fare in light of the entire customer journey from product impression to purchase.
3. The Checkout Flow
The checkout flow combines Product Detail impressions, Add To Cart actions, and the checkout flow itself.
A Product Detail impression is sent as a Non-interaction: True event as soon as the article is loaded. This impression can thus be interpreted as the reader quickly checking out whether or not they want to read the article.
The Add To Cart action occurs when the user starts scrolling. The payload is sent with a normal Event tag to Google Analytics. I consider scrolling to be revealing of the reader’s intention to consume the content, but it’s not a checkout yet, as they might just want to skim the first paragraph.
The checkout flow itself is pretty cool. I use the scroll tracking plugin Justin Cutroni wrote about on his site. I’ve modified it to work with Google Tag Manager, and I also customised it to work with “Purchases” as well (see next chapter).
Here’s how it works right now:
-
I calculate the length of the content DIV in pixels.
-
When the viewport of the user’s browser reaches one third of this length, the first checkout step is sent as a normal Google Analytics event. This step is labelled “Read one third”.
-
When the browser reaches two thirds of the content length, the second checkout step is sent as a GA event. This step is labelled “Read two thirds”.
-
When the browser reaches the end of the content DIV, the final checkout step is sent as a GA event. This step is labelled “Reached end of content”.
-
Finally, if the user has reached Step 3 and spent a minimum of 60 seconds on the article page, the “Purchase” event is sent as well (see next chapter).
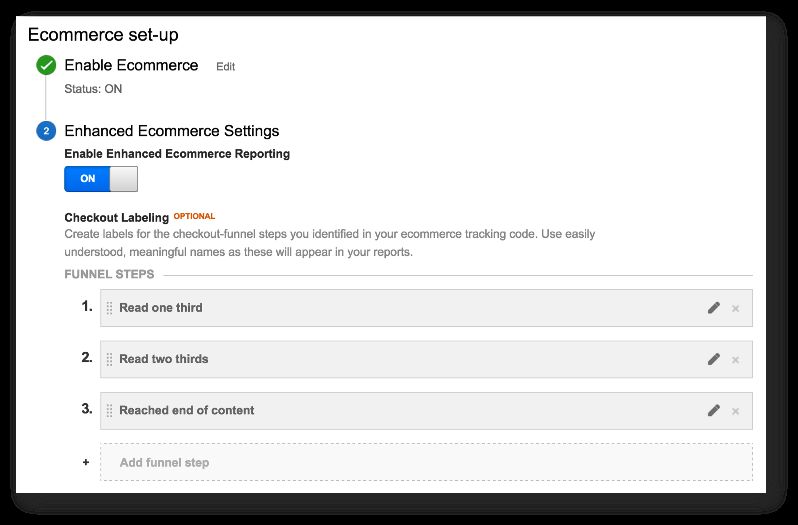
You’ll need to modify this funnel and the setup to match the type of content you write. You might want to change the dwell time from 60 seconds to something else, and you might want to add more steps to the checkout funnel (25 %, 50 %, 75 %, for example). For me, this level of granularity was enough.
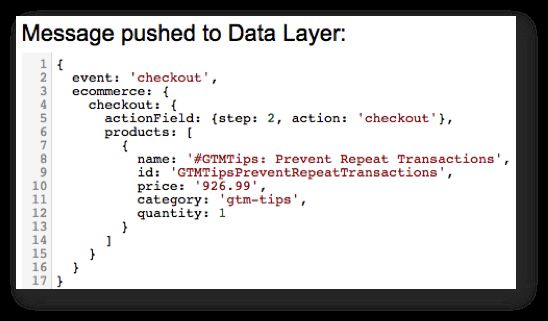
That’s a sample checkout object for the second step of the funnel. As you can see, I have price as one of the properties of the article. Here’s the kicker: price is the number of words on the article. Naturally, I’ve turned it into a “.99” number to make it more realistic as an actual price :-) You’ll see the usefulness of this once I get to the reports.
4. Purchase
Like I wrote in the previous chapter, a “Purchase” event is pushed when the checkout funnel is completed, and the visitor has spent 60 seconds on the site. The purchase itself is a perfectly standard Enhanced Ecommerce Purchase object, which might look like this:
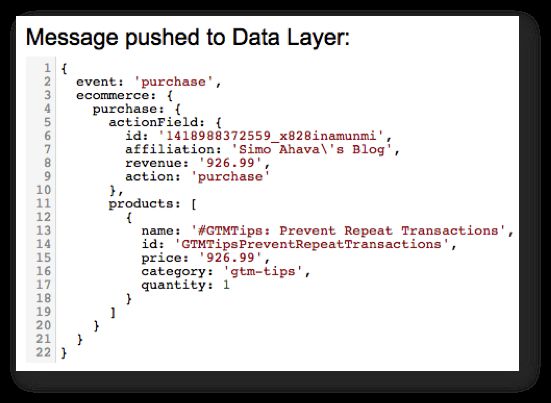
The transaction ID is basically epoch timestamp plus a string of random characters. The quantity of products in a transaction will always be 1.
The analysis
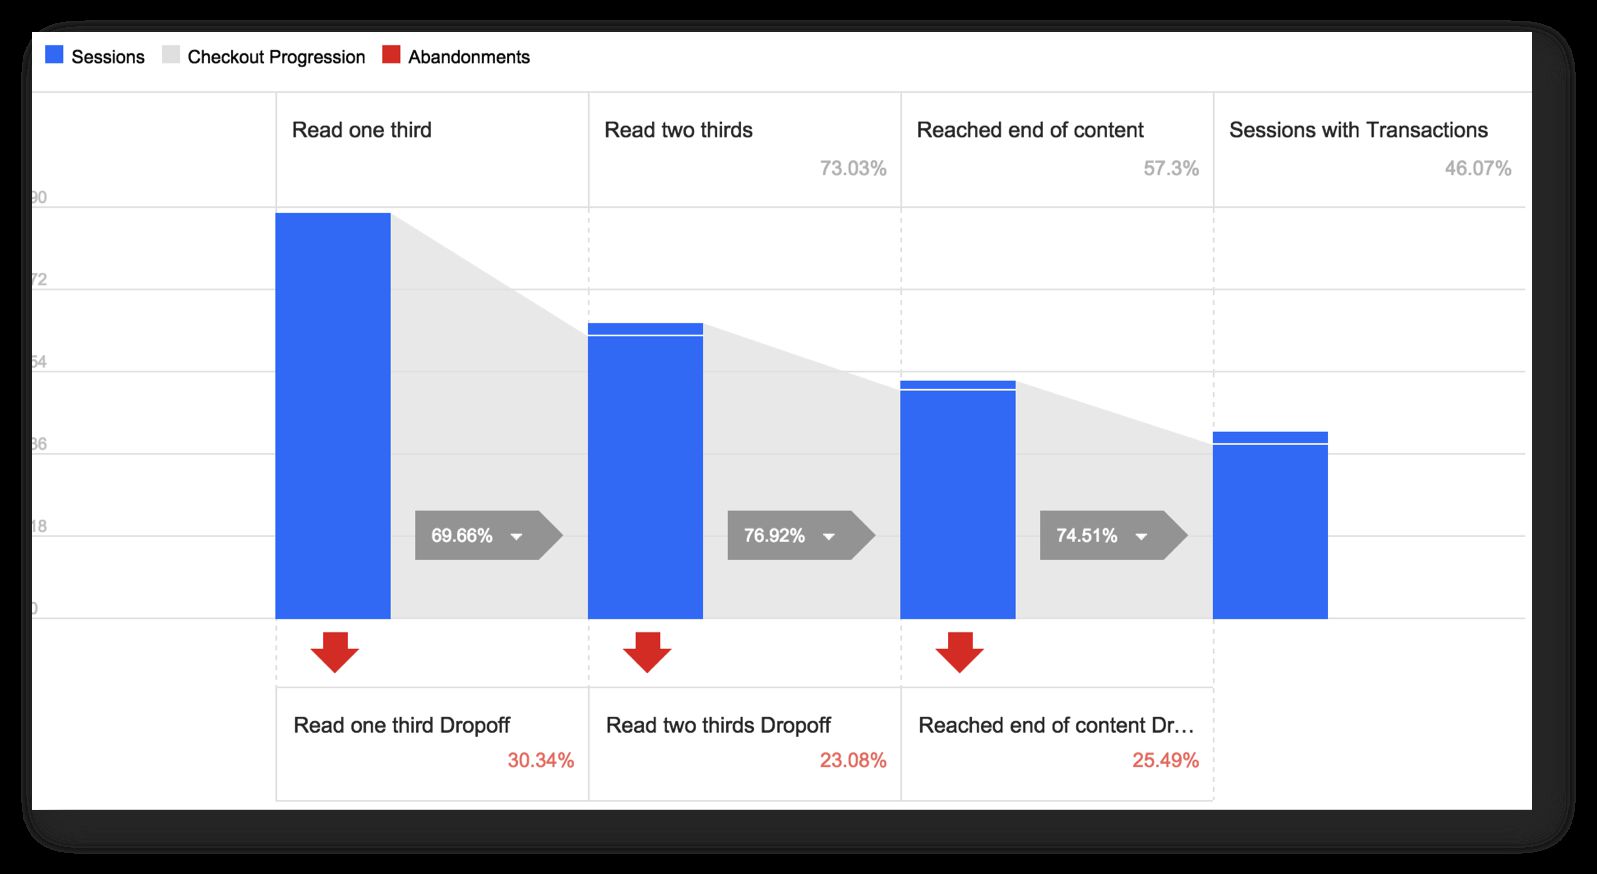
So, let’s go over my favorite reports and segments. First, there’s the Shopping Behavior report:
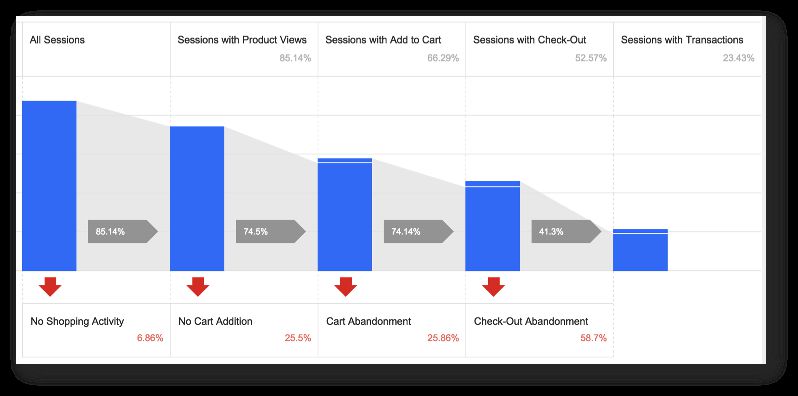
As you can see, this shows the interactions during the selected timeframe. In this example, the timeframe is just one day. I’ve removed the absolute numbers, but I’ll update this screenshot once I have more data. The behavior funnel is fairly logical. There’s around 20 % drop-off on each step, with a larger abandonment leading up to purchase. 15 % of people never open an article, which is interesting! This could also be a measurement error thanks to my DOM scraping, but it’s still understandable considering the amount of traffic I get on my blog.
Also, 25 % of the people who start scrolling never reach one third of the article. This is also interesting. It means that there’s something in the first paragraphs that drives the reader away.
This data should next be segmented and carefully analysed. How can I optimise the funnel further? Two immediate concerns I have is the overall low conversion rate (only 25 % of my readers end up reading an entire article while spending more than 60 seconds on the article page), and the fact that only 40 % of people who start reading end up reading the article thoroughly. This is, of course, a sign of normalcy in the blogosphere, but it’s definitely something I want to improve.
Now this is interesting! Half of my readers start in the checkout funnel, and only half of these reach the end and read for more than 60 seconds. Talk about selective reading! My content is pretty lengthy by average, so it’s interesting to see if article length is a factor here. Or maybe some people just jump straight to the comments, which is perfectly understandable. Actually, I should track this as well! Mental note.
So there’s a big disconnect between starting to read and reaching the end of content. I might have to do something about this. Like, writing more interesting articles. But it’s still respectable how many people actually take their time to read the article.
Naturally, one problem with this Checkout Funnel report is that the checkout funnel varies from article to article. Longer articles have a far higher threshold for hitting the funnel steps (since the steps are dependent on the pixel height of the content DIV), which means I should see a far higher rate for checkouts on shorter articles.
Next, we have the Product Performance report:
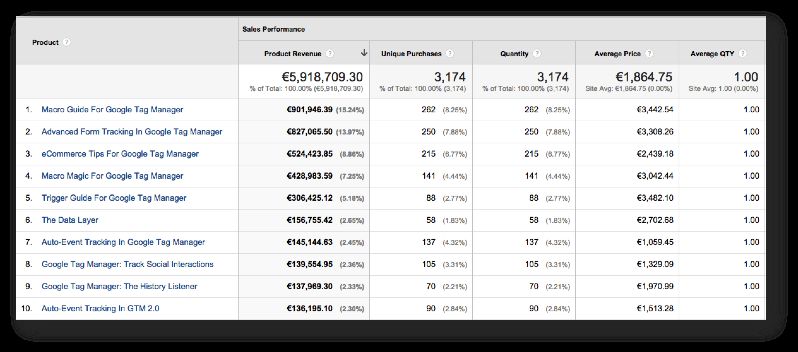
Oh, this is so much fun. During the week, almost six million words have been “Purchased” on my articles! This means that six million words worth of article content passed through the checkout funnel into the Purchase column. Awesome!
(UPDATE: I’m still waiting to get more data before updating this chapter with Buy-to-Detail and Cart-to-Detail rate analyses.)
If you look at Average Price, you can see that the list is topped by some of my longer articles. It’s still heart-warming to see some shorter ones on the top 10 list, delivering me “word revenue”.
Sales Performance isn’t very useful, since transactions are pretty arbitrary on my blog. I’ll jump straight to Product List Performance (sorry about the poor screenshot):
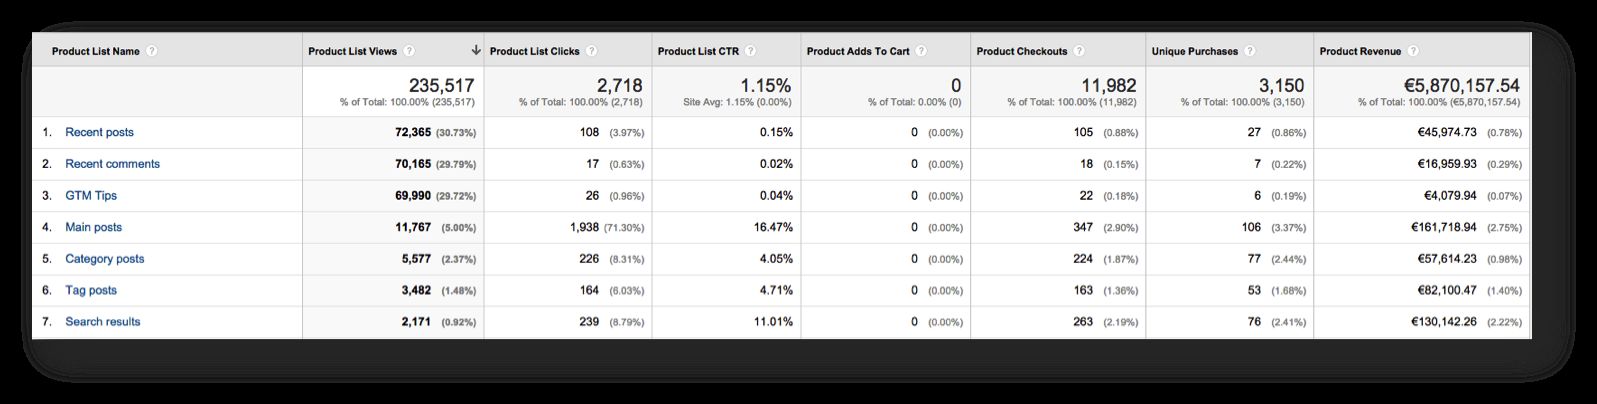
Key takeways from this report are that my sidebar widgets aren’t really useful. I should probably get rid of them as soon as I can think of something value-adding to put there instead. Well, the “Recent posts” list has a pretty high number of clicks, so I might preserve that.
(UPDATE: I’m still waiting to get more data before updating this chapter with Product Adds To Cart analysis.)
My top-performing list is naturally the home page listing. It has a very respectable CTR of 16.47 %. “Category posts” and “Tag posts” are much less popular, but even they attract clicks quite a bit.
“Search results” is doing very well, which is important. I want people to find what they were searching for. Naturally, I follow my most searched-for terms like a hawk, getting content ideas at the same time.
Since I have all this amazing data at my fingertips, I can create a bunch of awesome segments as well:
-
Whales: Revenue per user > 10000 - To track readers who’ve “purchased” more than 10,000 words in their lifespan.
-
Passers-by: Transactions per user = 1 - To track readers who’ve only “purchased” a single article in their lifespan.
-
Skimmers: Transactions per user = 0 AND Event Action exactly matches Checkout - To track readers who’ve started the checkout flow but never completed a “purchase”.
-
Loyal readers: (Include Users) Revenue per hit > 3000 - To track readers who only read my longer articles.
And many other segments as well! Now I can segment my channels to see which channels bring the most valuable readers. Note that I don’t automatically consider it more valuable to have a reader read my longer articles, which is where the whole “words as price” idea falls down. I enjoy writing short articles as well, and especially my #GTMTips posts are usually a bit shorter length-wise.
Summary
I hope this post has been inspiring. The data I’m getting into my reports is so interesting and actionable. It does require tweaking, however, so I might need to work with the checkout funnel, in order to optimise the flow of reading from article load to the end of content.
With the help of one of my blog commenters, I’ve updated the setup to include Product Detail impressions and Add to Cart actions, but it will still take a week or so to get more data, so you can expect another update to this article soon.
Let me know if you’ve tried something like this or if you have other ideas for tracking content with Enhanced Ecommerce! I’m sorry I can’t really give you a step-to-step guide at this point, but as I’ve done this with DOM scraping, I don’t really want to flaunt the solution, since I don’t consider it best practices. But they key thing in this article is to inspire you to think of your content in terms of funnels and transactions. I really love the new Enhanced Ecommerce reports, and I hope I’ve shown you how flexible they are for other uses as well than just web stores.