Page Load Time In Universal Analytics
In Google Analytics, you can monitor your site speed and get a decent overview of what pages are contributing positively and negatively to site speed. The problem with page load time metric is that it’s an average based on a sample. You can modify the sample rate with setSiteSpeedSampleRate(), but for me that’s not bloody well good enough.
(UPDATE 28.3.2014: This post is still valid, but an implementation with User Timings is a much smarter way to measure actual page load time. I’ll be doing a short update at some point in the near future.)
So in this post I continue exploring the beautiful combination that is Universal Analytics and Google Tag Manager. Be sure to check out my earlier post on using Universal Analytics to send weather as a custom dimension.
XThe Simmer Newsletter
Subscribe to the Simmer newsletter to get the latest news and content from Simo Ahava into your email inbox!
The end result
This is what you get:
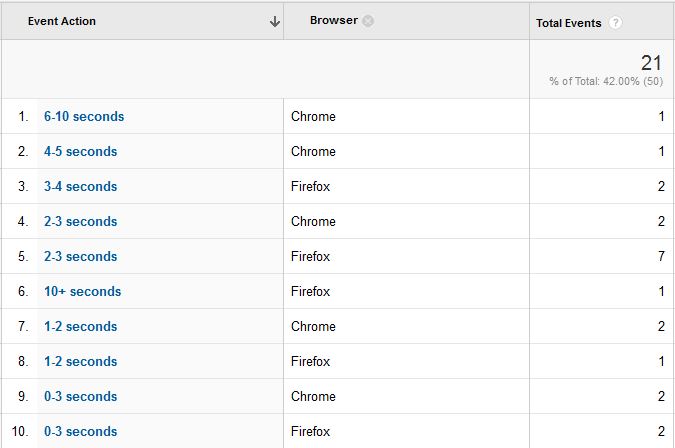
What you see is an event, sent along with each page view, telling you how long it took to load the page. The reason I’m using events, and not, say, custom dimensions, is just convenience. With events, I have a nice set of standrad reports, which means I don’t have to mess around with custom reports.
I would have liked to use absolute values (in milliseconds) as a custom metric, but the problem is that you can’t calculate with custom metrics, so recording all-important averages would be impossible. This is why I chose the scheme of converting the milliseconds to a string which approximates the page load time.
DISCLAIMER: As with Google Analytics site speed, this whole thing only works if the visitor’s browser supports the Navigation Timing (window.performance.timing) API.
Create some macros in GTM
We’re soon creating a generic event processor, so create some macros for it.
Steps:
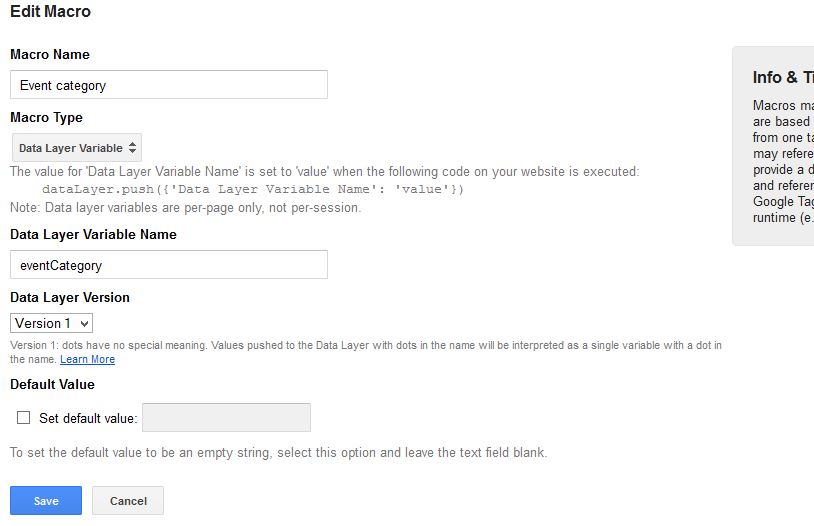
- Create a macro “Event category”, with Macro Type: Data Layer Variable and Data Layer Variable Name: eventCategory
- Create a macro “Event action”, with Macro Type: Data Layer Variable and Data Layer Variable Name: eventAction
- Create a macro “Non-interaction”, with Macro Type: Data Layer Variable and Data Layer Variable Name: nonInteraction
You could create macros for Event label and Event value as well (which would make this even more generic), but for this project I only need these.
By creating these macros, you’re making it possible to send variable data through the data layer into the tag, whose contents are eventually passed on to Google Analytics.
Create a generic event container
This is nice. I can just create a generic event processor, which uses the macros I just created, and use it in the future for all events I want to send to GA.
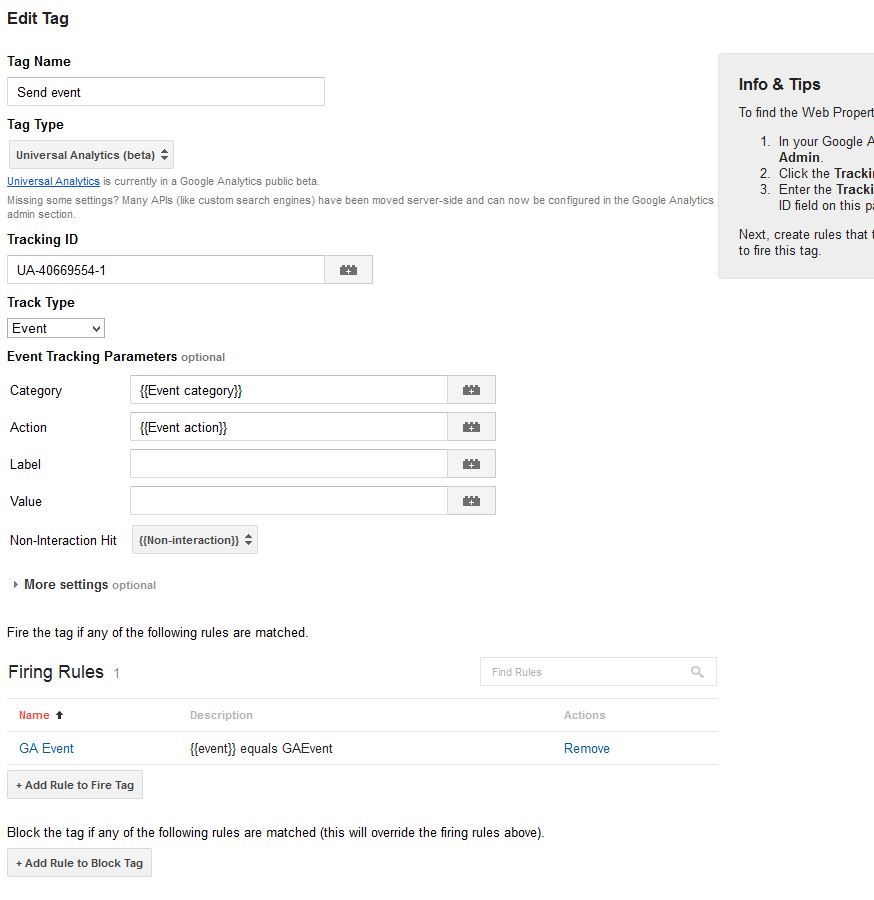
- Create a new tag called “Send event”
- Choose Universal Analytics (beta) as the Tag Type
- Add you GA tracking ID to the appropriate slot
- Choose Event as the Track Type
- Add {{Event category}} as the macro for, duh, Category
- Add {{Event action}} as the macro for, that’s right, Action
- Add {{Non-interaction}} as the macro for Non-interaction hit
- Create a firing rule “GA Event” with the condition “{{event}} equals GAEvent”
- Save your new tag
So here you create a container for all your events. Now you have your macros and your container. In the future, to send a new event, you just need to push an event named “GAEvent” to the data layer, which fires the tag you just created. And that’s what we’re doing next.
Coding the page load time script
- Create a new tag “Page load time”
- Set Custom HTML Tag as the Tag Type
- Add the following code within the HTML field:
<script>

var perfData = window.performance.timing;
var pageLoadTime = perfData.domComplete - perfData.navigationStart;
var loadTime = "";

if (pageLoadTime < 1000) { loadTime = "0-1 seconds"; }
else if (pageLoadTime < 2000) { loadTime = "1-2 seconds"; }
else if (pageLoadTime < 3000) { loadTime = "2-3 seconds"; }
else if (pageLoadTime < 4000) { loadTime = "3-4 seconds"; }
else if (pageLoadTime < 5000) { loadTime = "4-5 seconds"; }
else if (pageLoadTime < 6000) { loadTime = "5-6 seconds"; }
else if (pageLoadTime < 10000) { loadTime = "6-10 seconds"; }
else { loadTime = "10+ seconds"; }

dataLayer.push ({ 'event': 'GAEvent', 'eventCategory': 'Page Load Time', 'eventAction': loadTime, 'nonInteraction': 1 });

</script>- Add a firing rule which waits for the page to load: {{event}} matches gtm.load
- Save the new tag
What happens here is that after the document has loaded, the script counts the time from the moment the rendering of the page began to the moment the DOM was completely loaded. I tried having loadEventEnd as the end point, but for some reason the tag was fired before this was reached, so I got ridiculous results.
For more information on the Navigation Timing API, be sure to check Navigation Timing Overview.
Once I get the time (in milliseconds), I use quick and dirty if…else statement to approximate the load time to a string.
Finally, I push the data in the dataLayer. In the push, I signify GAEvent as the event name, which was the trigger for the Send Event tag to fire. It’s important to signify this event as a non-interaction event (nonInteraction: 1), since otherwise you’d start getting 0% bounce rate on all your pages.
Save the container version and publish
And that’s all there is to it. To sum up, here’s what happens:
- When the visitor starts loading a page, the load time is calculated
- This information is passed into a generic event container, with category and action names in place to make sure the event is recorded clearly in Analytics
- The container tag is fired as soon as the data is passed, since the trigger is the event name (which is passed with the data)
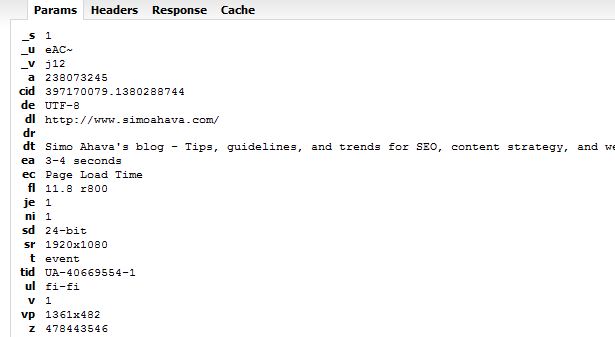
- You can verify that you did things correctly by looking at the Network log in Firebug:
Final words
This might seem a bit overkill (tracking every single load time of every single page load), but I like the idea of looking at page load time on a more detailed level. Now I can use the Event reports to see what browsers were used with the slowest visits, what countries had the lowest page load times, etc. It’s all data, baby.
Sure, I know, by upping the sampling rate you can get similar results in the Site Speed report, but hey, it’s more fun when you can code the stuff yourself!
I’m still waiting for the possibility to start doing calculations with custom metrics. It would be so cool to see what the average page load time was during a set day, with a certain browser, with visits from a specific country, etc.