Measure Google Tag Manager Event Duration
Google Tag Manager is a great tool. Yeah, you came all the way to this article to read that truism. It also performs really well, loading at a sweet, swift pace even on a slow connection, thanks to pretty decent response times from Google servers. On top of that, the library itself loads asynchronously, meaning the container download doesn’t interrupt the browser as it tries to make sense of your messy HTML.
However, after the container has downloaded, the rest is up to you. The Triggers you attach to Tags, the Variables you resolve in both Tags and Triggers, and all sorts of things like Tag Firing Priority can potentially bog down your site simply because they all represent complex JavaScript operations. Just because code is executed in the Google Tag Manager container doesn’t guarantee fast performance. The browser still needs to execute it line-by-line, using asynchronous requests where possible (such as when a call is made to the Google Analytics endpoint), but also relying on quite expensive operations such as DOM insertion.
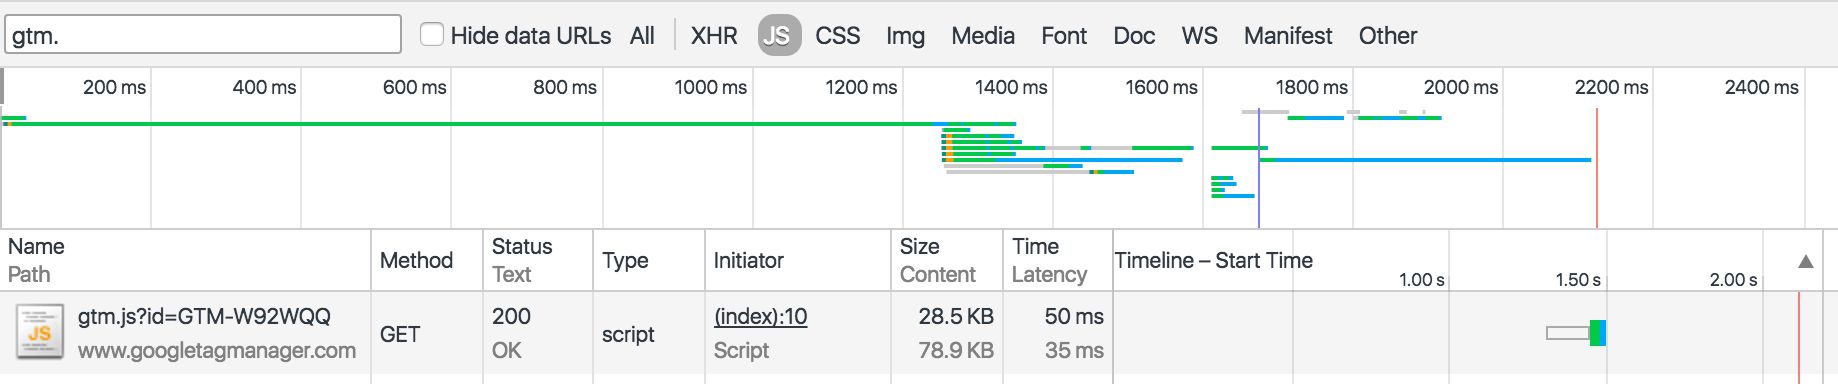
Anyway, being the experimenter that I aspire to be (how’s that for a circular statement), I wanted to measure just how much time it takes for GTM events to resolve. Here’s the result:
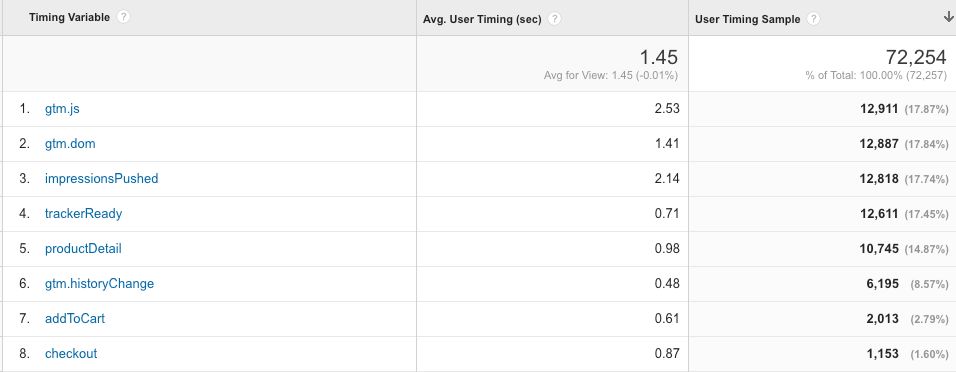
Interesting stuff! Out of the largest timing samples, it’s the most basic of events, gtm.js, which takes the longest time to complete! 2.5 seconds on average, phew! Here are the Tags on my site which fire on gtm.js:
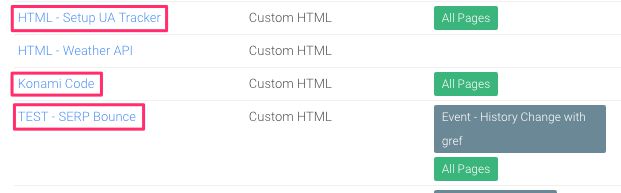
There’s a tracker setup Tag, a little Konami code surprise, as well as some code to measure the SERP bounce time on my site. Each one of them has some dataLayer.push() methods executed, and the tracker setup does load the analytics.js library, so it’s not like it’s lightweight stuff. But still, 2.5 seconds? That’s a lifetime in Internet time!
Anyway, this measurement has been quite eye-opening. It’s a good idea to be aware of what happens behind the scenes. Even asynchronous operations can be harmful to page performance, especially if there are many of them running one after the another. The reason for this is that the load event for the window object is delayed until the page and all its related resources (e.g. scripts and images) have completely loaded. This might lead to problems with frameworks like React, where many operations are executed only after the window.onload event has been dispatched in the browser.
Let me quickly walk you through how I setup this measurement. It’s not a walk in the park, and if you want to try it yourself I urge you to test it in a staging environment first!
XThe Simmer Newsletter
Subscribe to the Simmer newsletter to get the latest news and content from Simo Ahava into your email inbox!
Let’s hack the Data Layer
To make it work, we need to hack the Data Layer.
Queue ominous music.
That’s right, we need to do what Google Tag Manager has already done and hijack the dataLayer.push method to overwrite it with our own.
So, the following code needs to end up on your page template before the Google Tag Manager container snippet:
<script>
  window.dataLayer = window.dataLayer || [];
  var oldPush = window.dataLayer.push;
  window.dataLayer.push = function() {
    var e = [].slice.call(arguments, 0);
    if (e[0].event &&
        e[0].event !== "perfTime" &&
        ["gtm.linkClick","gtm.formSubmit","gtm.timer"].indexOf(e[0].event) === -1 &&
        document.readyState !== "complete") {
      var t = (new Date).getTime(),
          a = e[0].event;
      e[0].eventStartTime = t,
      e[0].eventCallback = function(c){
        window.dataLayer.push(
          {
            event : "perfTime",
            "perfEvent.event" : a,
            "perfEvent.totalTime" : (new Date).getTime() - t,
            "perfEvent.containerId" : c
          }
        )
      }
    }

    oldPush.apply(window.dataLayer, e);

  }
</script>
Wow. That’s a beast. I’m not going to walk you through it line-by-line, but here’s how it works:
-
When a
dataLayer.push()happens, this code is first executed. -
It takes the object that was pushed, and if it contains an
'event'key and if it matches some other conditions, the following code is then run:-
A timer is started (the time when the event execution began) and stored in the key
eventStartTime -
The
[eventCallback](/gtm-tips/hitcallback-eventcallback/)of this object is set to a function, which basically pushes anotherdataLayerobject, where a new timer calculates the difference between the event execution start and end times -
Finally, whatever was processed by this script (whether it be the modified object or the new “perfTime” object) is returned to the original
dataLayer.pushmethod, so that GTM can pick it up
-
Ah, that IS a beast. Perhaps it’s easier if I show you an example. When this code is running (i.e. before the page has completely loaded), a simple dataLayer.push() like this:
window.dataLayer.push({
  'event' : 'testing',
  'someVar' : 'someVal'
});
…is automatically turned into:
window.dataLayer.push({
  'event' : 'testing',
  'someVar' : 'someVal',
  'eventStartTime' : 1464890512708,
  'eventCallback' : function(e) {...}
});
And when all Tags which fire on 'event' : 'testing' have completed their execution, the following is, again, automatically pushed into dataLayer:
window.dataLayer.push({
  event : 'perfTime',
  'perfEvent.event' : 'testing',
  'perfEvent.totalTime' : 421,
  'perfEvent.containerId' : 'GTM-W92WQQ'
});
So my little hack is automatically measuring the time any 'event' takes to complete, as long as it happens before the page has loaded (as that’s the only performance I’m interested in).
By the way, you don’t really need to add the eventStartTime into the object, as you already have a locally scoped variable t which stores the start time in a closure. However, I prefer to keep it there in case I want to do further debugging, since with the start time I can also build a waterfall model out of the performance times, to see how much execution of these different pre-load events overlap.
NOTE!! The script automatically excludes gtm.linkClick, gtm.timer and gtm.formSubmit, as these have their own uses for eventCallback (the Wait for Tags option). Similarly, if you’re already using eventCallback with some events, be sure to add them to the Array of excluded events, or you might break your site!
Remember to test first, please!
The setup in GTM requires the following:
-
A Data Layer Variable named DLV - perfEvent.event, pointing to variable name
perfEvent.event -
A Data Layer Variable named DLV - perfEvent.totalTime, pointing to variable name
perfEvent.totalTime -
A Custom Event Trigger named Event - perfTime, with Event name set to
perfTime -
A Universal Analytics Tag of type Timing (see below)
Here’s the Tag:
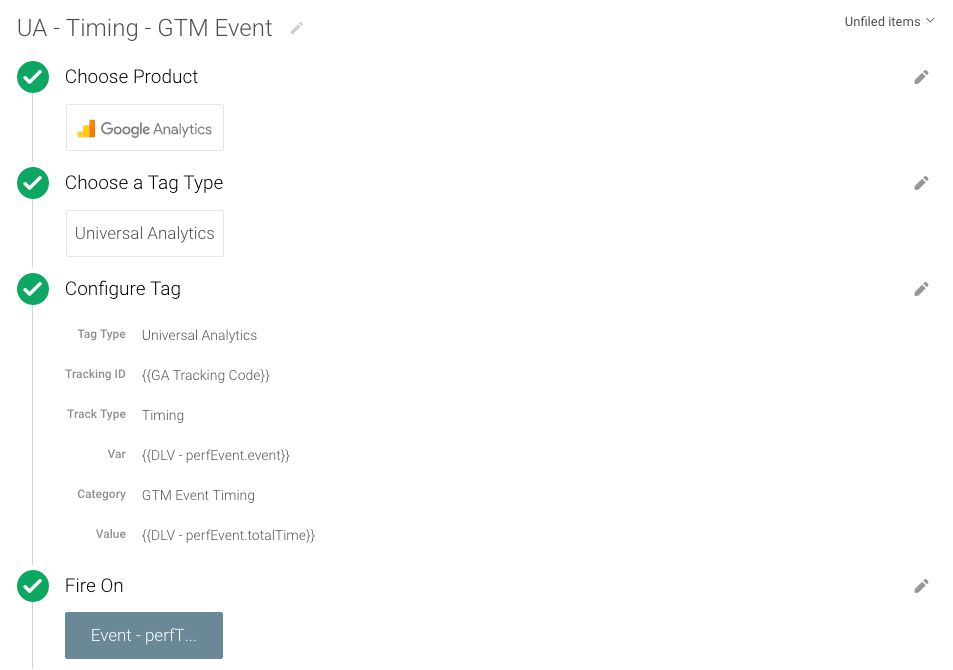
And this Tag will send your hits as User Timings, after which you’ll find the report in Google Analytics, under Behavior -> Site Speed -> User Timings.
I’ve given User Timings a thrashing before, since they’re really useless for timing ALL the hits on the site. But if you’re fine with just a sample, such as in this case, they work really well.
Summary
Remember kids, good performance is good. Bad performance can kill… your site’s user experience, and other stuff, too!
However you want to do it, it’s a good idea to keep an eye on the processes that take place before the window object has completely loaded on your site. You can use User Timings to measure all sorts of important milestones, such as just how long it takes for that awesome font library you paid hundreds of bucks for to download. Or how long your favorite JavaScript framework (rhymes with “lay brewery”) hinders your page load times. Or how long it takes for you to reach the end of these articles of mine. Well, the last one might need some creativity, but I’ll leave it in your capable hands!