Google Analytics And The Page Load
If you use Google Analytics, Google Tag Manager, or any JavaScript-based data collection or analytics platform, have you ever stopped to wonder how they actually work? I mean, you obviously care about getting the data in, but are you taking the machinations of these tools for granted?
This is something I’ve been thinking about for a long while, because I’m not so sure that many who work with these platforms actually understand how the browser and the web page interact.
That doesn’t make sense. And it scares me a little.
Since the predominant paradigm for web analytics today revolves around JavaScript, it’s important to have a sense of what the weak links in this technology are. Also, even before JavaScript kicks in, there are certain aspects of the page load process that you need to observe to get better quality data.
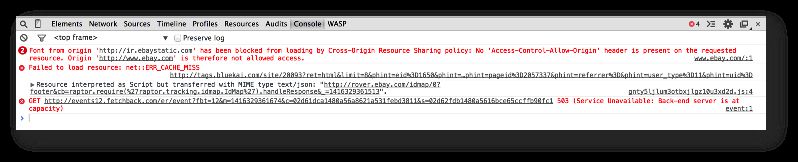
Fortunately, even the most basic understanding of these leads to elucidation: No, the tools do not cover 100 % of the visits to your site, no, “pageviews”, “sessions”, and “users” should not be taken literally, and no, it’s most often not Google Tag Manager or Google Analytics that’s at fault when tracking on your site fails. You’ll find the real culprit by opening the JavaScript console on your darling website, but don’t forget to close this dimension rift to the nether pits of the hell of all hells once you’re done, lest some of the demon spawn gets through.
The core of this article boils down to a simple statement:
The only way to evaluate the quality of the data you use is to understand how it was collected.
Keeping this in mind, I want to take a look at the page load sequence in the user’s browser, and what implications the different parts of the load process have on Google Analytics tracking.
XThe Simmer Newsletter
Subscribe to the Simmer newsletter to get the latest news and content from Simo Ahava into your email inbox!
The sequence of events in the page load
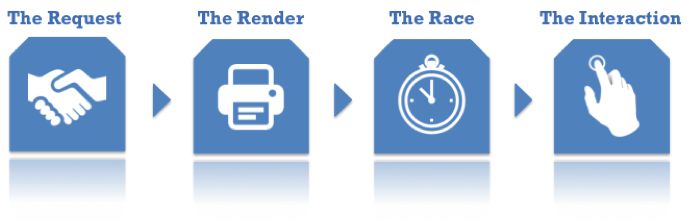
This short essay (or long rant, however you want to see it) is split into a number of sections. Each section represents a stage in the intricate process of what takes place in the user’s browser when they visit your website. Each part of this process has implications for how you can and should track the interactions this user has with your content.
-
The Request - What happens when a user types an address into the location bar of the browser, and what are the pressure points for web tracking.
-
The Render - How the browser turns the source code into a living document.
-
The Race - How asynchronous JavaScript works, what race conditions are, and what you should watch out for.
-
The Interaction - Once the page is loaded, how are user interactions measured, and what are the biggest pitfalls here.
As always, I wrap up with a summary.

Everything starts with the request.
When a user types your website address into the browser’s location bar, the desired outcome is usually that they see a web page. In order for this to happen, the browser uses the HTTP protocol to issue a request to the machine that hides behind the address.
If there is a web server at that endpoint, if that endpoint has mapped the requested address to some resource, and if the request is valid (there’s no additional authentication required, firewalls don’t block the request, no security policies are violated etc.), the web server sends an “OK” response, most commonly with a status code 200, and the document that was mapped to the address in the response body.
This document is usually an HTML template file, i.e. the page source code, and the browser’s job is to turn this document into a dynamic web page.
I mean, obviously, it’s a much more intricate and complex process than this, but the key interaction here is what happens when the web server receives the request.
For successful collection of data to Google Analytics, there are some things here that you need to be aware of.
1) 404 - Resource not found
If there is no resource mapped to the address the user requested, it means that the web server has to respond with a “resource not found” error. Now, at this point your web server should be configured so that if there is no resource to send to the user, a “Page not found” template is served instead.
You should have GA running on this page with a tag that tracks pageviews. 404 page tracking is a wonderful addition to the toolset of any savvy webmaster-slash-analyst.
If you haven’t set up a template, the user might see the default error page served by your web server (they’re usually pretty horrible), or, lacking that, the browser will cook up an error message instead (even more horrible). The key here is that if you don’t have a custom template with the GA tracking code, you won’t be able to track these hits in Google Analytics. For example, my GTM Tools serves the following, unhelpful, untrackable default page if no resource is found:
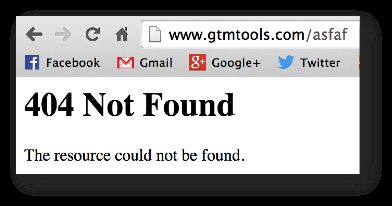
This is a bad practice. Use a custom template instead.
Check the Bounteous post if you want to see a great way of tracking 404 errors in GA and GTM!
2) Redirects
If you’ve set up a redirect server-side, you must remember preserve query string parameters in the redirect! If you strip them out in the redirect, you’ll risk losing important campaign tracking information.
This is essential to preserving data quality!
3) Single-page apps
If your website is essentially a single-page app, where instead of the expected HTTP GET request, the user’s browser sends POST calls, the rules of traditional page tracking change a little.
You can no longer trust the reset that occurs with every page load, since there are actually no page loads after the first one. Instead, you’re going to have to come up with a new terminology for tracking your visitors. For some it’s scroll tracking, via events or virtual pageviews, and for some it’s tracking user interactions with the page, such as clicking on tabs or call-to-action buttons, and for some it’s invoking GTM’s history listener, which reacts to changes in browser state.
If you’re using Google Tag Manager, an important aspect of these single-page apps is that the dataLayer object is not reset as it is with page refreshes. That’s because in a web context, the painstakingly rendered web page with all its variables, objects, elements, texts, links, images, and other clutter is recreated with every page refresh. In other words, objects on a given page do not persist to other pages. With a single-page app, there is no page refresh, so there’s no purge. The data layer is alive for the entire time the user stays on the page, meaning it’s more than possible that anything you store into dataLayer and send to GA might be sent with subsequent hits as well.
With single-page apps, then, you need to be aware of the state of dataLayer at all times, and if necessary you need to emulate a page refresh by deleting keys that you don’t want to persist:
dataLayer.push({
  'key_to_be_deleted' : undefined
});
4) Don’t be idiot…idiosyncratic
Finally, an important aspect of interacting with the web server is that many analytics platforms expect standard behavior from your server. So don’t whip up your own custom responses if just the regular “200 OK” will do. If you don’t serve standard responses, it’s possible that callbacks are not executed, hits don’t get sent, and valuable data is lost again.
The key takeaway here is this:
Adhere to best practices in template handling and server responses - your analytics tool will thank you with good data.

When the browser receives the source code, it does something inexcusable. It gives the website a break. You see, one of the reasons JavaScript is reviled and browser wars are raging is because errors are glossed over. Your site can have the most horrendous source code, but depending on the browser, it turns into an amazing, well-crafted, dynamic web document.
It’s much like what Auto-Tune does to talentless singers. The music industry uses Auto-Tune to turn pitchy Idol dropouts into pop stars. In much the same way, the web browser turns a hideous piece of anti-code into a web page without actually telling the developer bluntly that they’ve done a poor job.
Now, we can argue that Auto-Tune is a good thing, and we can argue that it’s great that the browser helps you like this. But having a machine correct your singing is no excuse to stop trying to reach the correct pitch naturally, and having a browser fix your source code problems is no reason not to aim for good markup.
For analytics, this browser behavior has some implications.
Because every browser wants to be a bit better than the next, they have their own ways of parsing source code. Sometimes these idiosyncrasies are subtle enough to not make a dent, but sometimes they erupt into full-blown compatibility issues, polyfills, and disgruntled developers. At the heart of this tragedy is the analyst, who only wanted to know how many people leave a specific form field empty when submitting the contact form.
// Classic example of browser compatibility checking
if (document.addEventListener) {
  // For real browsers
  document.addEventListener('click', handleClick);
} else {
  // For IE8 and earlier
  document.attachEvent('onclick', handleClick);
}
To combat these problems in the render process, it’s often wise to adopt a framework. If you’re tracking the “traditional way”, jQuery is something you might want to take a look at. If you’re using Google Tag Manager, well, you’re already using a JavaScript framework. By leveraging the built-in features of GTM, such as auto-event tracking and tag templates, you’re externalizing cross-browser woes to Google Tag Manager. It’s the framework’s job to take care that any features you want to use work across the wide variety of browsers and devices.
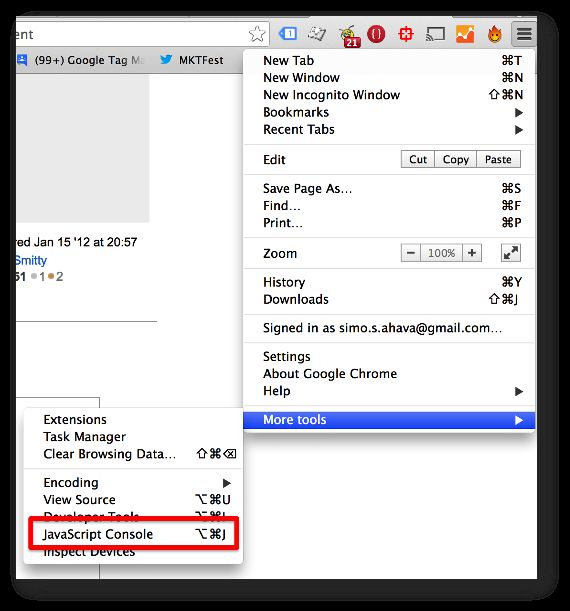
In some cases, even the smartest browser won’t help you. These are called single points of failure, because they essentially disrupt the current execution context when an error occurs. If you run JavaScript such as the Universal Analytics tracking snippet in your page template, a single syntax error will break the current script context and the code will fail. Again, your browser is probably trying to be helpful and doesn’t raise any alarms if this happens, so you’ll need to do some debugging. Make the JavaScript console of your browser your new best friend. Use it religiously for debugging.
It’s a shame if your entire tracking plan for a website fails because of a mistyped quote or a missing semicolon. Also, remember to watch out for formatted quotes. If you copy-paste from a document where quotes are formatted in some unorthodox way (such as Microsoft Word), you might run into trouble with JavaScript compilers, which expect regular, unformatted quotes in the code.
So the key takeaway in the render process is:
Make sure that your [markup is valid](http://validator.w3.org/), and that your [JavaScript is flawless](http://jslint.com/). If your JavaScript is getting too complex to manage, take a look at a sustainable framework that will take some of the management overhead away.

JavaScript is single-threaded. This means that at any given time, only a single line of JavaScript can be executed. Thus, JavaScript is, by nature, blocking. Every line of JavaScript that is executed on the page template blocks the template until the line of code has been executed.
Before asynchronous JavaScript became the norm, we resorted to adding potentially risky JavaScript to the end of the document, at the very bottom. This reduced the risk of breaking down your entire web page if the JavaScript refused to agree with the browser. Also, if really large, external JS files were loaded, these calls were added to the end of the page as well, because the loading and the execution of the external file were queued in succession, meaning some severe page blocking would take place.
Well, today, we have asynchronous JavaScript. At the heart of asynchronous JavaScript are callbacks, which are functions that are executed once some action, usually a network request, is processed. So if, for example, your script performs an HTTP request, asynchronous JavaScript initiates the request, but immediately returns to the next line of code in the page template. As the request progresses, the callbacks are executed as soon as there’s a spot open in the event queue. This way the code doesn’t block the page load, as it’s run “in the background”, only executing the callbacks once they are invoked by the original function.
Another place where you’ll see asynchronous requests is when loading external JS libraries. Google Analytics and Google Tag Manager are both loaded asynchronously. This means that the request for loading the JavaScript file is sent asynchronously, and when the file is loaded and available, only then is the code within executed (and when there’s a spot in the event queue). This way you can add these external library loads to the top of the page, ensuring that their load process begins as early as possible into the page load, but without risking them blocking your other code from running.
The downside of asynchronous JavaScript is that we can’t really predict when a given script will finish executing. We’ll know when it finishes thanks to the callbacks, but we can’t pinpoint this moment in the page load sequence beforehand.
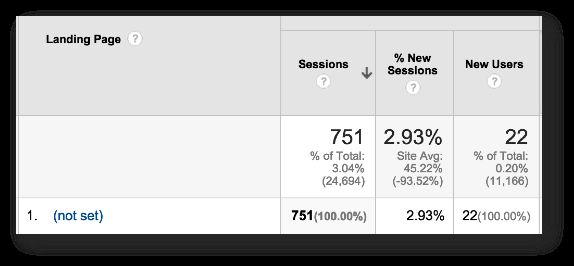
This behavior leads to something called race conditions. Race conditions occur when two scripts are loaded asynchronously, and the latter requires that the former complete first. An example would be event tracking in GA. You don’t want to send an event hit before the pageview hit completes, because otherwise you’ll end up with warped sessions, where landing page is (not set):
If race conditions are at play, it doesn’t matter that the event hit began its execution after the pageview. What matters is that the event can finish first, because we can’t control asynchronous execution once it begins.
For GA and GTM, it’s important that you recognize potential race conditions on your page. If you want to increase the odds of the pageview being sent before any subsequent hits, for example, you could set all other hits to wait at least until the DOM of the page has been loaded. This safety measure usually adds a tiny overhead to the execution of the tag that waits for DOMComplete, and it more often than not means that the pageview has had ample time to complete before any further hits are sent.
If it’s not business critical data, you can even use the window load event as the hook for your other hits. The window has loaded when the page and all associated scripts have finished loading. If your code pushes data to GA after window load, it’s almost 100 % certain that the pageview has finished executing. However, if you have a heavy page full of big, uncached images (boo!), and heaps of external JS files to load (boo boo!), it might be too long a wait for some impatient visitors. Thus any hits that wait for window load might not get sent, as the user has already navigated to another page.
The best way to make sure that asynchronous scripts load in sequence, and thus to avoid race conditions, is to use the callback of a successful hit as the trigger for the subsequent hits. So in your pageview, you can use the hitCallback parameter to specify what happens once the tag has successfully fired. In this callback function, you can tell your other tags that it’s ok to fire. With Google Tag Manager, using hitCallback together with dataLayer makes it really easy to introduce some order into things.
Understanding race conditions is really important with eCommerce as well, especially if you use client-side HTTP requests to get the transaction data. It’s all too common to see a transaction tag executing before the transaction data is available.
The takeaway of The Race is:
Map out the dependencies between your tags, eradicate race conditions by using callbacks, and leverage asynchronous loading as much as possible.

Well all this page load stuff is marginally interesting, but it might not play a role in your idea of what web analytics is for, even though it should. But what you’re definitely interested in is how to track interactions on the site.
Interaction is a loaded term, because it’s often difficult to pinpoint just what we mean by a user interaction. A click is surely an interaction, but is scroll an interaction? What about mouse movement, is that interaction? How about the shifting of the user’s gaze to a different part of the site, surely that’s not interaction? Well, it might be.
The thing is that depending on what you want to track, you might be facing a lot of problems in implementing the system that collects the data. Something as simple as a click handler can be difficult to implement if you’re not aware of what possible conflicts there are with your other JavaScript handlers.
This conflict resolution covers around 75 % of the most frequently asked questions about Google Tag Manager. I’ve written about this extensively before, so if you want in-depth details around the event propagation problem, take a look at this article:
Why Don’t My GTM Listeners Work?
The key here is to understand how the document object model works, especially in terms of event delegation. Often it’s most economical to add just a single listener on a page, and then just pick up events using event delegation. However, if you have conflicting script on the page, this might not work, and you have to come up with a workaround. Here’s a simplified version of the problem:
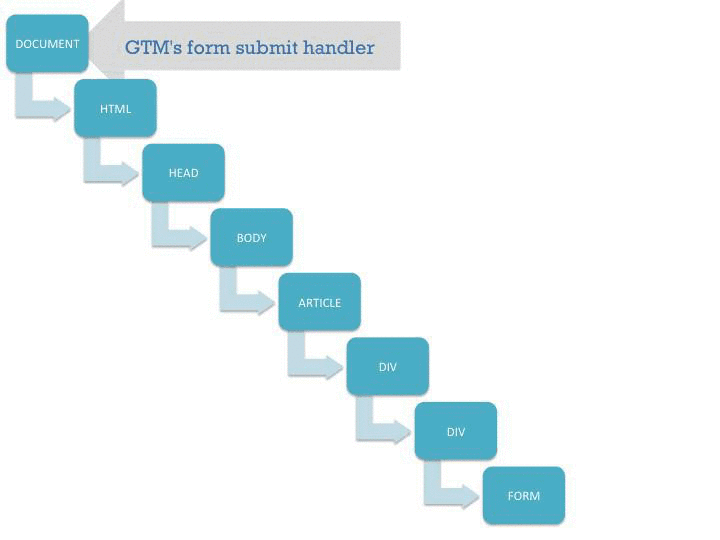
This visualization shows how the submit() event starts propagating up the document tree, and once it reaches GTM’s listeners on the document node the auto-event tracking kicks in. It also shows you what happens if there’s an intruding call to stopPropagation() on the event object.
But that’s GTM. When you’re tracking with traditional GA, you can again use jQuery for easy, cross-browser event handling. The thing is that the more you leverage different frameworks, the more possibilities there are that things go awry.
With interaction tracking, it’s so important to establish a discussion with your front-end developers. If you start injecting stuff onto the site that doesn’t play well with existing script infrastructure, you’ll have far bigger problems than data pollution. Your forms might not work any more, tabs which were supposed to change the content dynamically start redirecting you to completely different pages, elements flicker in and out annoyingly, and so forth.
So the key takeaway for interaction tracking is this:
Only track what you think is useful to track, and always test thoroughly for conflicts
The Summary
I hate just scratching the surface in articles, but we’re already past 3,000 words and if you made it this far you deserve a huge thank you.
Analytics is all-encompassing. It can permeate every single platform you use, aggregating information from a wide variety of data sources in one, centralized location. However, to get your web analytics working to the max, I strongly believe that an understanding of the page load process, even on a high level, is crucial. This article only scratched the surface, so you might want to take a look at the following resources to expand your mind:
-
The Request: How Browsers Work
-
The Request: Google Analytics And 301/302 Redirects
-
The Render: Optimizing Content For Different Browsers
-
The Render: QuirksMode: Compatibility overview
-
The Race: Asynchronous JavaScript Programming
-
The Race: #GTMTips: hitCallback And eventCallback
-
The Interaction: Custom Event Listener for GTM
-
The Interaction: Google Tag Manager Events Using HTML5 Data Attributes