Debug Google Analytics On Your Mobile Browser
I’m currently at SMX München, which is still one of my favorite conferences in Europe. The quality of the talks is superb, and the organization is just perfect. So today, after my talk (joint session with the awesome Dave Sottimano), I was listening to the inimitable Mike King give an excellent presentation together with Ari Nahmani on technical skill prerequisites for all digital marketers today. Needless to say, I strongly agree with their view that digital marketing has always been a technical discipline, and the web is getting more and more complex each day that passes. The only way to address this flux is to hone your technical skills as much as you can.
One thing that Mike quickly visited was remote debugging for mobile devices. Now, debugging your website’s mobile experience is a pain, since the mobile browsers themselves give you only few tools to work with. For Google Analytics, for instance, it would be really interesting to know what requests your mobile browser is sending to GA, especially if you’re tracking stuff that’s idiosyncratic to the mobile experience. But you can’t just open a mobile browser and expect it to have the same awesome developer tools as your desktop browser.
Enter remote debugging! You can simply plug in your iOS or Android device, and then open the web browser (Safari or Chrome, respectively) on your desktop, and in a few simple, easy-to-follow steps, you’ll be right there inspecting the DOM and analyzing the network requests! How awesome is that?
This isn’t a guide, just a “EUREKA” moment for myself, since it really makes it quite simple to debug your mobile browser. The steps I outline below are for the iPhone (since that’s what I use), but you can follow the steps in this guide to make it work on your Android device / Chrome combination as well.
XThe Simmer Newsletter
Subscribe to the Simmer newsletter to get the latest news and content from Simo Ahava into your email inbox!
iPhone instructions
So, first of all, plug your iPhone into the USB port of your computer.
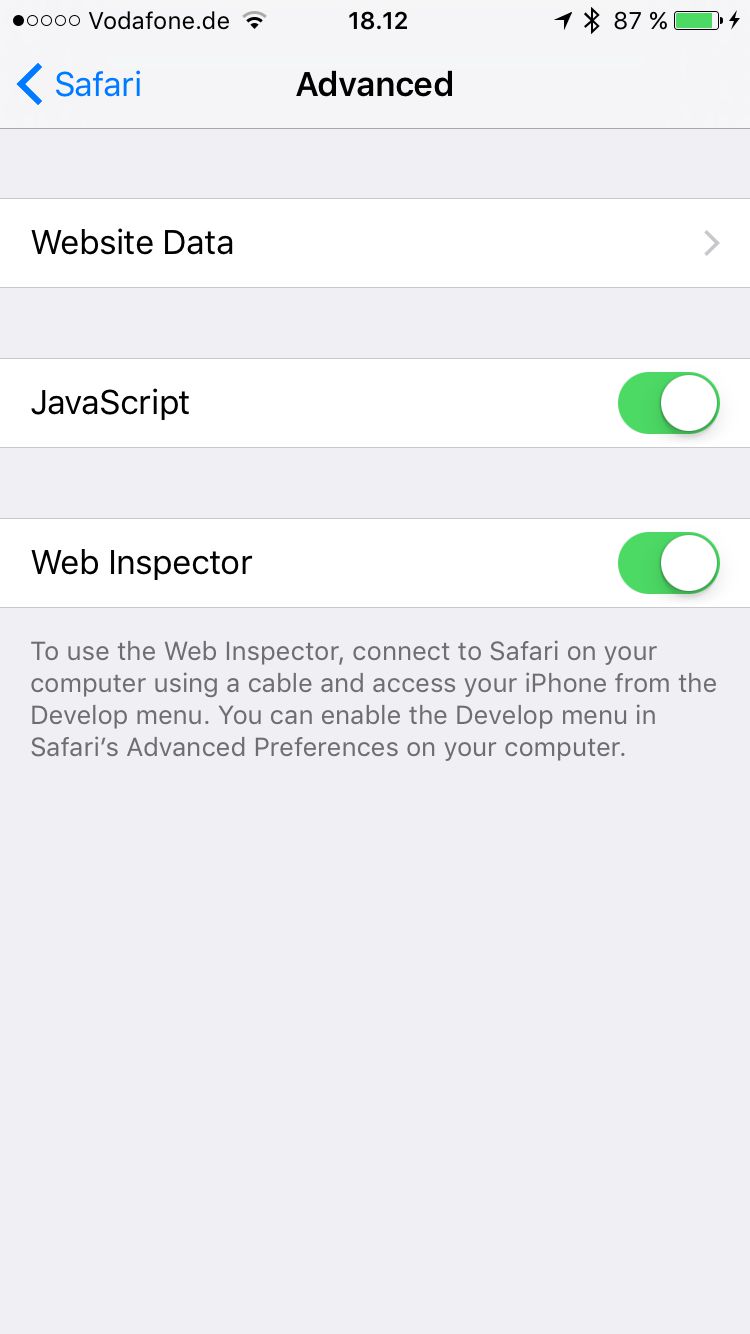
Next, still in the iPhone, go to Settings -> Safari -> Advanced, and in the screen that opens, make sure Web Inspector is ON.
Open the Safari browser on the iPhone, and go to the website where you want to debug your mobile device on.
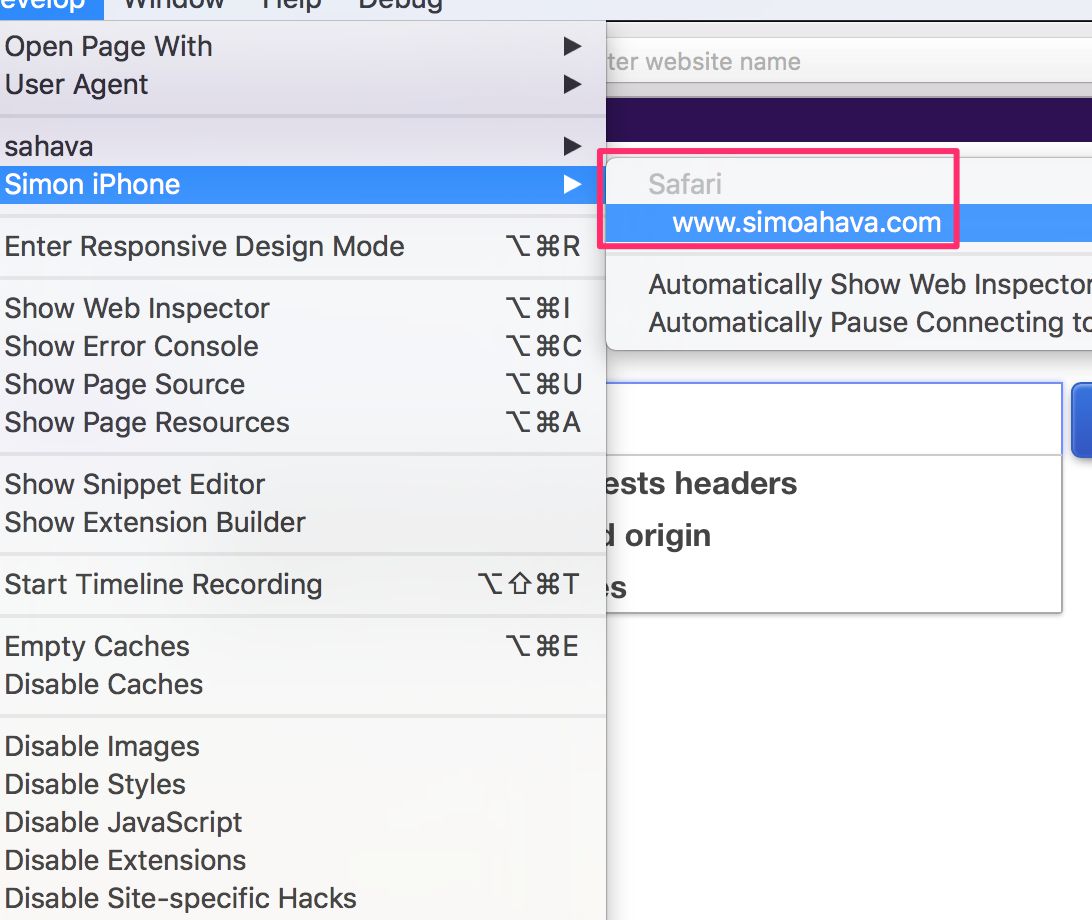
Next thing to do is open your desktop Safari browser. In the Develop menu, you should now see your device, and when you open the device menu, you should see an entry for Safari, together with the URL of the site you’re viewing on the phone. Click that menu item.
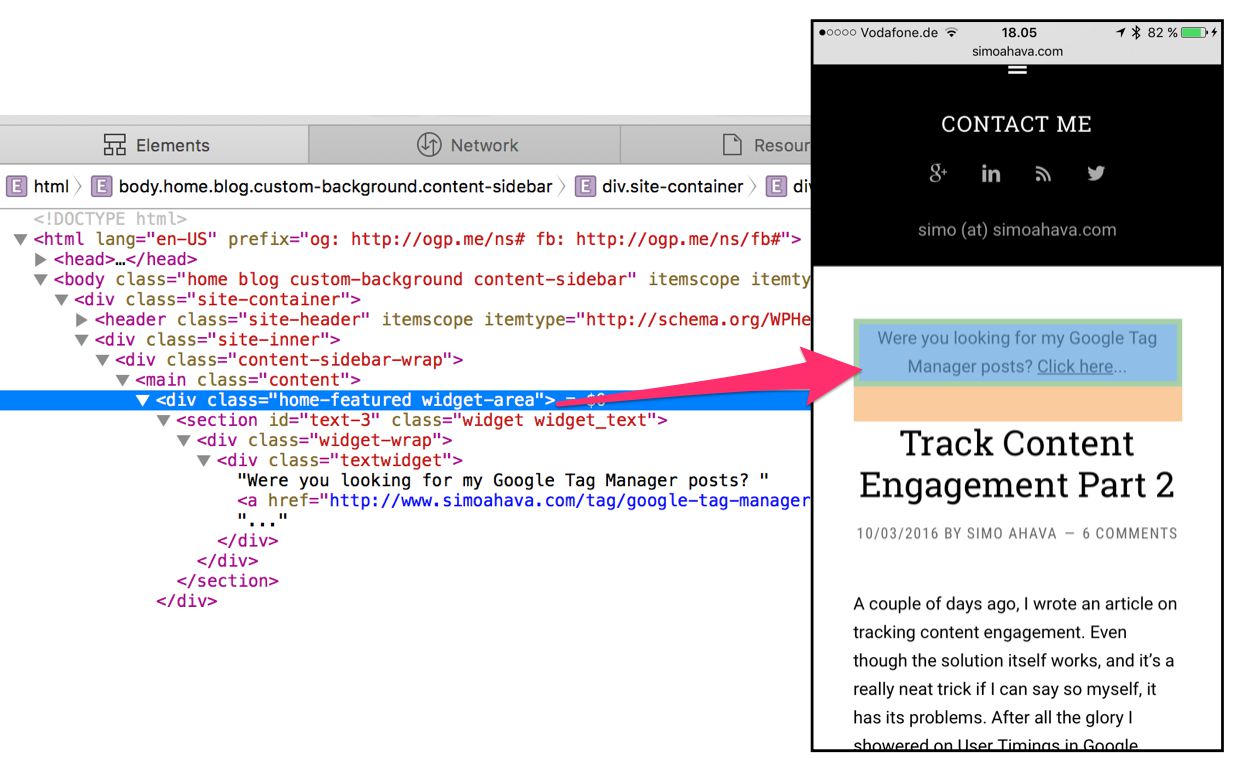
TA-DA! You’re remotely debugging your iPhone, while it’s browsing the website! You can move your mouse button over the DOM elements in the Elements view to see how the Document Object Model is built on the phone.
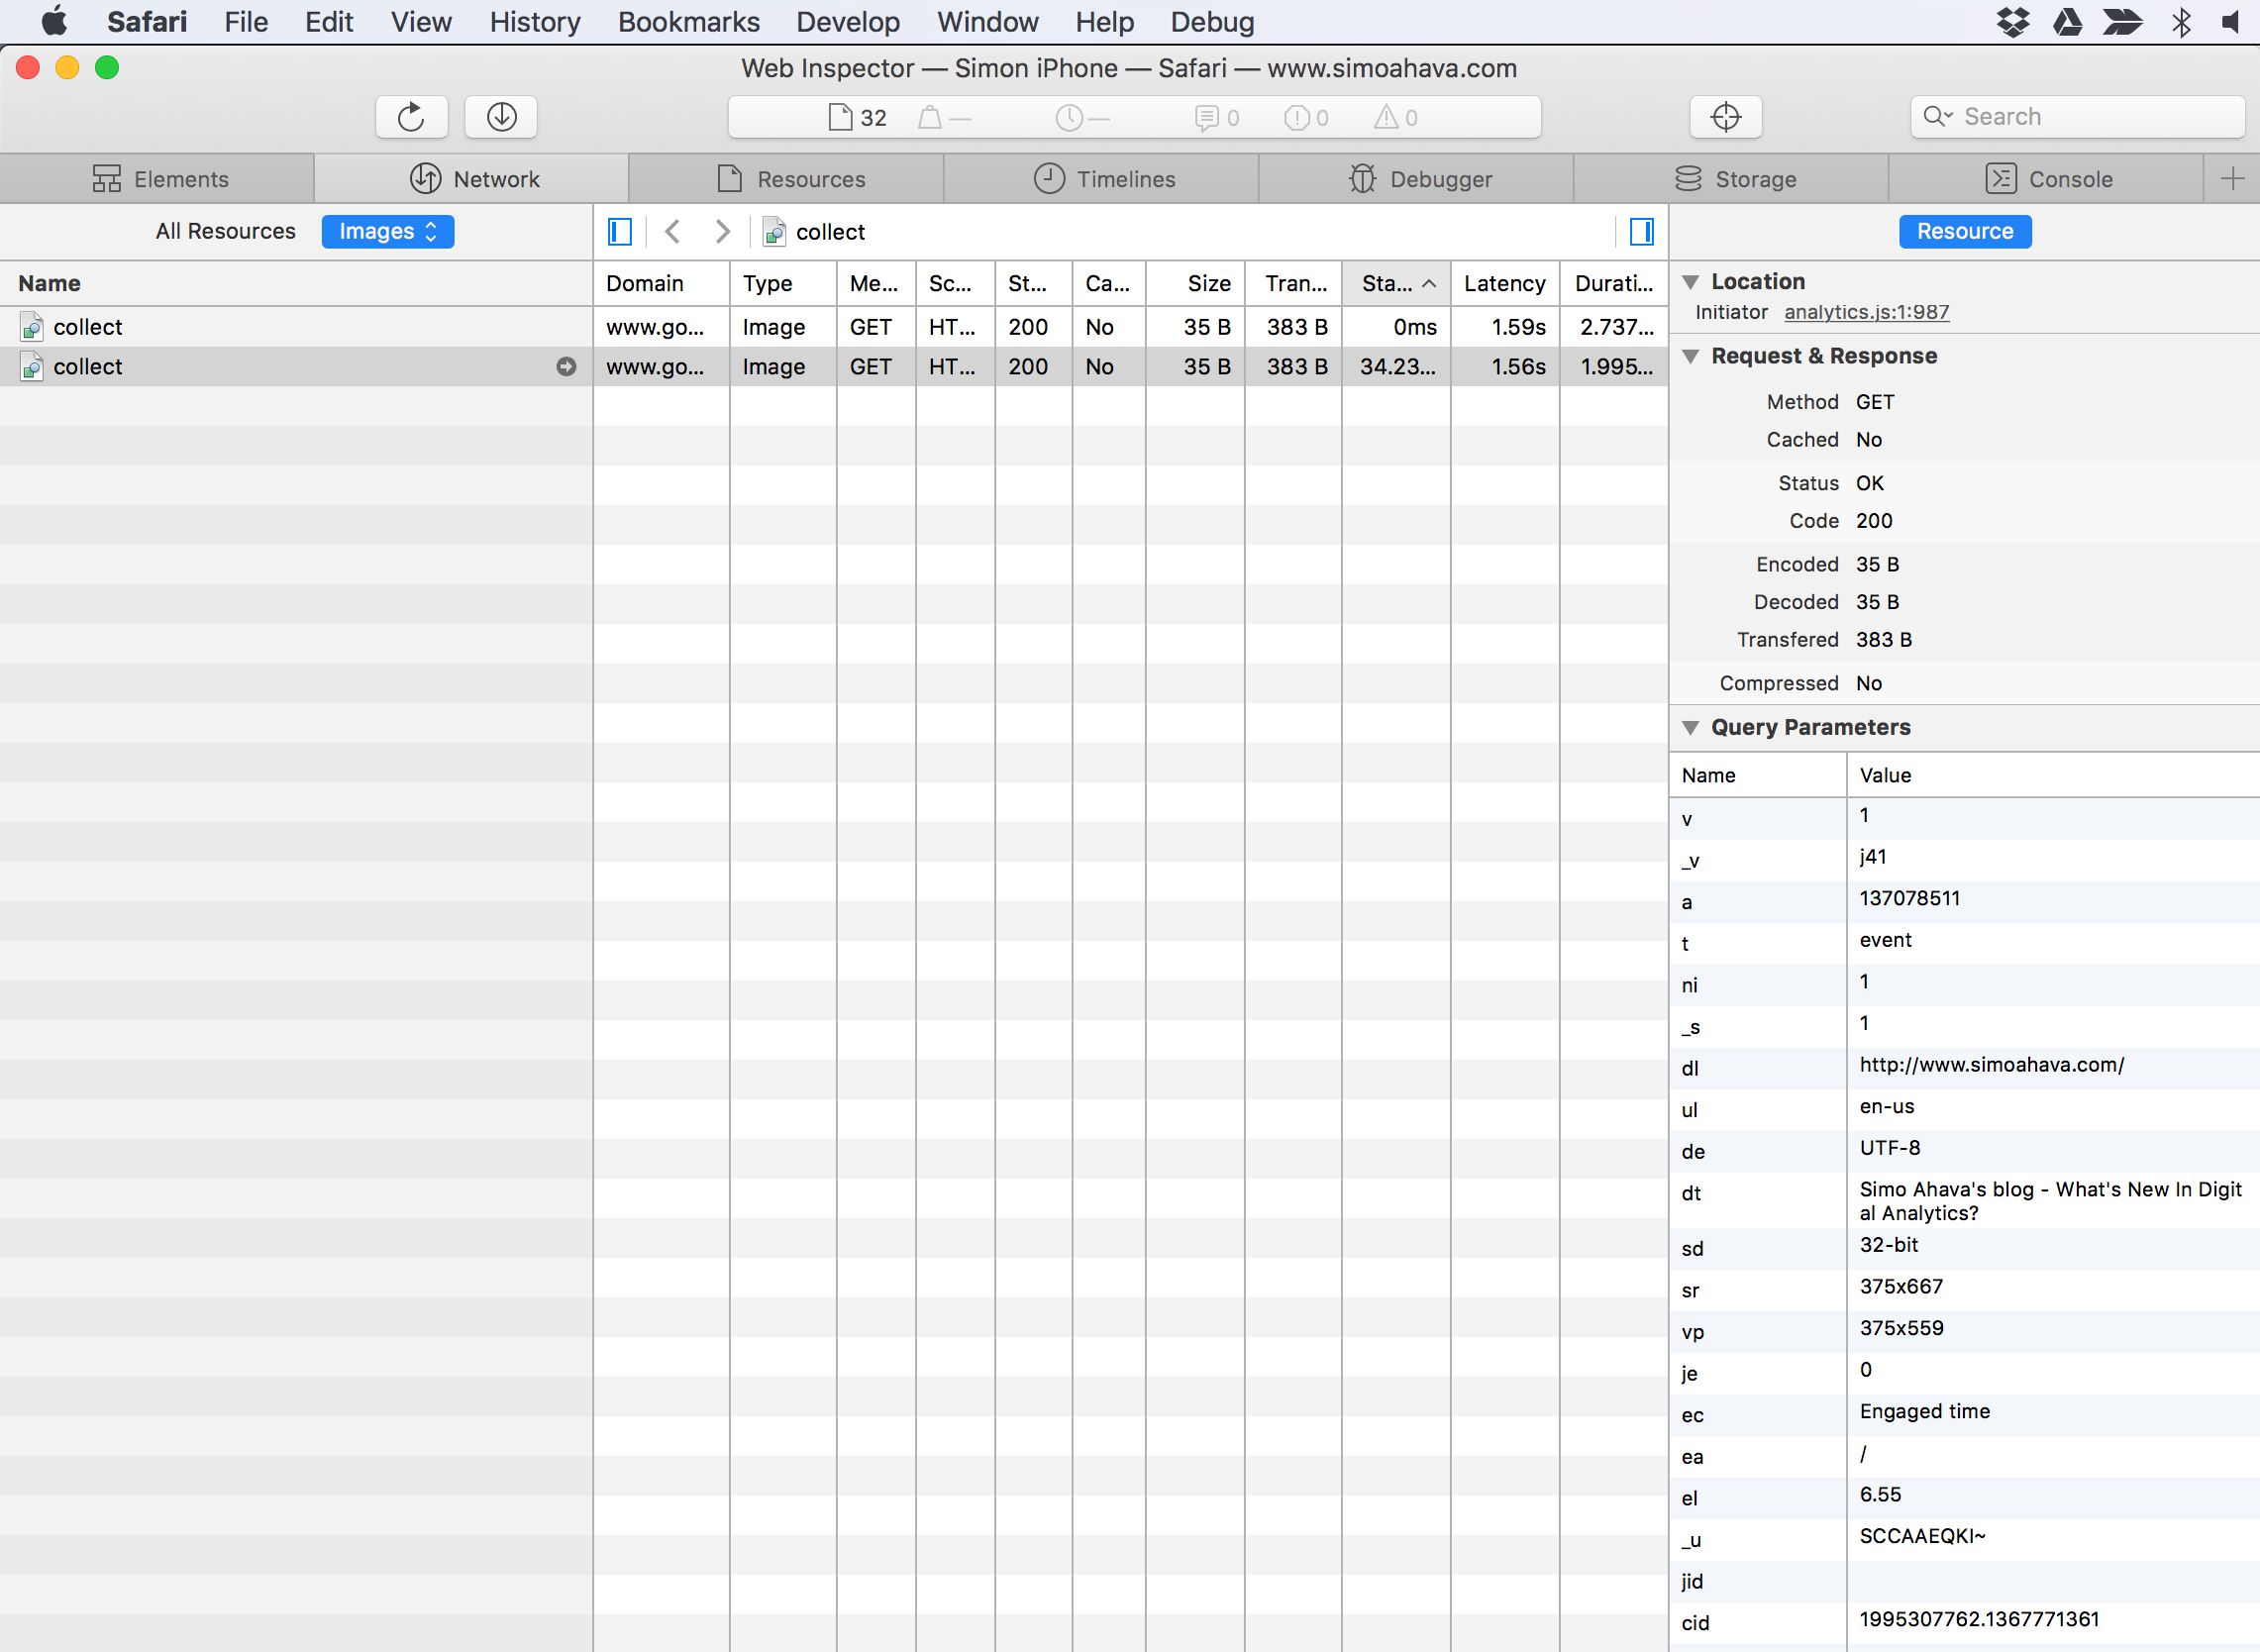
You can open the Network Tab, find a request to collect (the Google Analytics endpoint), and then expand the Resource panel to view the parameters of the request and the HTTP headers and all that stuff!
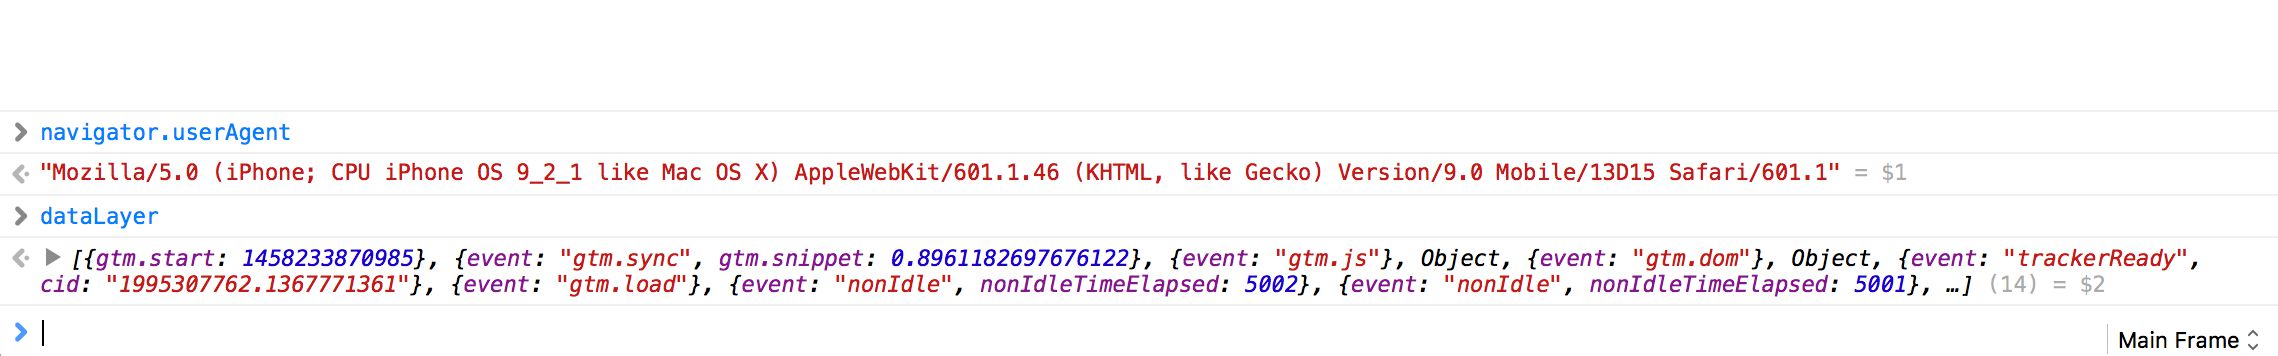
Hell, you can even execute JavaScript in the mobile context! Want to check the state of dataLayer on your mobile browser? Easy! What about the User Agent string? Child’s play!
Honestly. Remote debugging. Where have you been all my life?