Data is difficult
Data is difficult. Growing a business is difficult. Measuring success is difficult. And you know what? They should be difficult. Otherwise we’d all be equally stupid, whereas now those of us ambitious enough to exert themselves are winning the race.

And it’s not just working with data that’s difficult. The whole Web is a mess! Search engine optimization consultants, for example, are trigger-happy in doling out advice about server-side redirects without stopping to consider the implications of what they’re recommending.
But it still seems to me that those working in web analytics give up first. The passive, phlegmatic, lazy approach to implementing a data collection platform and to the subsequent analysis can be seen in many, many organizations out there.
It’s because data is difficult.
Never mind the analysis. We all know how much experience, expertise, and industry knowledge it requires to derive value-adding insight from a data set. But implementing a platform so that data quality is constantly re-evaluated and tweaked is an intimidating task for many.
This seems to stem from the fundamental misunderstanding that data collection is plug-and-play. No, implementing Google Analytics is not very difficult, as it’s simply a copy-paste operation out-of-the-box. With Google Tag Manager it can be even easier. But this is just the start. When first installed, all Google Analytics is good for is tracking Pageviews and little else. All the things that really fascinate us, like call-to-action interactions, eCommerce transactions, and content engagement, require additional work to implement.
Yes, data requires work. Data quality isn’t acquired, it’s earned. Tools like Google Tag Manager and Google Analytics shouldn’t be designed to make data and analysis thereof easier. No, their function is to make data more manageable, so that maximum data quality can be achieved with minimum effort. This way, any data organization can pursue the famous 90/10 rule, where 90% of resources (time/money/effort) should be focused on people and only 10% on tools.
“Easy data” is one of the misconceptions making waves through the industry and saturating the digital space with practitioners who just refuse to give a damn. I’ve spent a lot of time talking and thinking about these misconceptions, and I’ve managed to group them under three observations, formulated here into rules.
XThe Simmer Newsletter
Subscribe to the Simmer newsletter to get the latest news and content from Simo Ahava into your email inbox!
Rule of Data Passivity
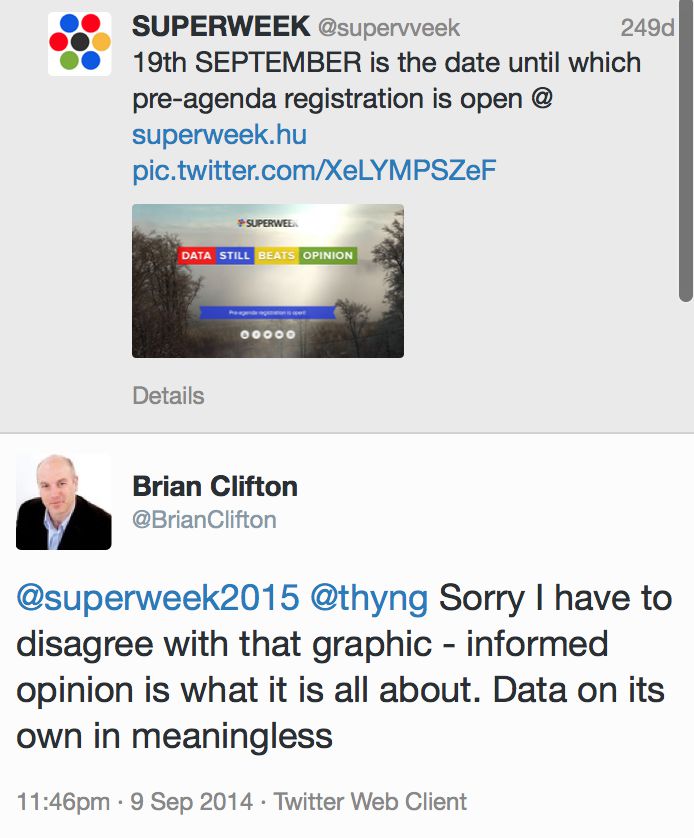
The rule of data passivity can be best summed up as a rebuttal of the classic “Data Beats Opinion” quote, attributed to Jim Lecinski from Google.
With the Rule of Data Passivity, I maintain that data itself does nothing. It beats nothing. It tells nothing. It shows nothing. Data is not an active agent: it’s a passive medium.
Pure opinion can, and will, “beat” data, if data is of bad quality or if the interpretations are flawed. Naturally, success based on instinct alone is difficult to find, but so is success founded upon polluted data. Indeed, the most consistent, data-driven triumphs are derived at the convergence of informed decision-making and optimized data collection.
Data passivity also leads to dashboard blindness. When looking at a dashboard, we expect to derive insight at a glance. As if the pie charts, the tables, and the scatter plots were telling us how our business is doing and what we should do next. But they don’t!
The “green for good, red for bad” labels and interpretations in the dashboard have to be calculated by someone. And they need to align perfectly for each business and each objective. If we expect that a universal platform like Google Analytics will be able to tell us everything we need to know at a glance with no customization required, we’re sorely mistaken.
It’s because data is passive that smart analysts should, and hopefully will, be always in demand. They are the ones who take the metrics in the reports and churn them into meaningful visualizations in the dashboards. They are the ones that make sure real-time data flow is as informative as possible. But this, again, requires work. Data is difficult, remember?
Data is easy to hide behind, both in triumph and in failure. For this reason, it’s of paramount importance to ensure the quality of data at data collection, and to hire analysts who can interpret the data in a way that’s most beneficial for the business.
Plug-and-play analytics might work for a while, if you’re lucky. But if you want to actually use data to make a difference in your business, customization is no longer optional.
Rule of Data Subjectivity
The rule of data subjectivity is important to consider when talking about data quality. I have often said, in one form or another, that:
Data quality is directly proportional to how well the data collection mechanism is understood.
Take Google Analytics, for example. For many, Bounce Rate represents a key metric in evaluating content engagement. But this is because of some weird marketing ploy or super-conspiracy, where Bounce Rate has been turned into a true data demon, an undeniably evil metric with the power to destroy like no other. Consider the following, however, before condemning Bounce Rate:
-
A Bounce is not a session with just a single Pageview. It’s a session with a single interaction.
-
Google Analytics does not know how much time a session lasts if the session is a Bounce.
-
A high Bounce Rate on a page with your phone number and address can be a good thing.
All these three things question the “evilness” of Bounce Rate. If you don’t measure call-to-action engagement on a page, you should not read anything into the Bounce Rate of sessions that only visited this page. Why? Because if you did measure the call-to-action, you would see a lower Bounce Rate, since an event hit from interacting with the call-to-action would negate the bounce.
Similarly, even if you don’t have anything else except the Pageview to measure on the page, you do not know by default how much time the visitor actually spends on the page during a bounced session. This is because Google Analytics calculates Time On Page as the distance in time between two Pageview hits. Session Duration, instead, is calculated as the distance in time between any two interactions. Both are unavailable for bounced sessions. The visitor might spend 18 hours on the page, drinking in every bit of information, for all you know.
Also, if the phone number or the address of your store is literally all someone might want to know, it makes sense that your contact page has a high Bounce Rate. That means it’s been optimized to appear in search results, and after landing on the page, the visitor finds what they were looking for immediately. In fact, it would be a negative user experience to force the visitor to browse other pages (and thus record a lower Bounce Rate).
These are just some examples of how the quality of Bounce Rate as a metric is directly proportional to how well its collection and processing mechanism is understood. And web analytics platforms are teeming with similar examples.
Another way to consider the rule of data subjectivity is to consider how data quality can shift from bad to good, depending on the vantage point and the question asked.
A data set with nothing but Pageviews is bad data for tracking visitor engagement, since it’s missing key things like content interaction, but it is good data for measuring the relative read counts of your articles.
LinkedIn endorsements are bad data when figuring out if someone is truly skilled at something, but they are good data when trying to identify what the general perception of someone’s abilities is.
Twitter retweets are bad data for identifying meaningful content, but good data for measuring the viral effect of a powerful headline.
Rule of Data Scarcity
The rule of data scarcity is almost philosophical in nature. Web analytics measurement is limited by technology. There are only so many things that we can track with JavaScript and HTTP requests, and there is only so much processing power that server-side algorithms can exhaust when inferring meaning out of the incoming hit stream. This is why it’s a good practice to start pulling this web analytics data out of the system at some point, so that it can be combined with other data sources.
However, no matter how much you collect and combine, you will never have all the data. The rule of data scarcity thus dictates that data will always be incomplete, and an arbitrary line has to be drawn somewhere in the data collection mechanism.
When can you say you have “enough data”?
For example, if you want to measure content engagement with Google Analytics, it’s commonplace to measure scroll tracking. This way you’ll know how many people scroll down your articles, and you can use this as a rudimentary indicator of read-through rates.
But what is the increment of scrolling that constitutes an event? 1%? 5%? 25%? Should you also measure the time spent on the article? What about if someone just scrolls furiously fast to the bottom of the content, perhaps looking for comments? Should you also measure mouse movement? Perhaps someone is scrolling, but actually they’re just looking for sidebar content or your contact details?
The questions you can ask are infinite, because the data that you can collect is (almost) infinite. You will need to draw a line somewhere, and this requires deliberation. It’s important that you ask questions, check if the data responds to these questions (positively or negatively), and then adjust the questions and reformulate your hypotheses.
Meaningful data
Ultimately, data collection boils down to a simple thing: gathering meaningful data. What meaningful means is something that must be negotiated uniquely for each business case, each project, each product, each organization, and each platform.
A data organization, i.e. an organization that is serious about using data to power their work, is never just a data collection or a data processing or a data reporting body. No, turning metrics into meaningful actions that drive your business requires that all aspects of this process should be observed almost religiously.
The reason I’m highlighting data collection is because there seems to be a disconnect between how data is collected, how it is accessed, and how it is reported on. The three rules I write about above are not just about data collection, as they are very much aligned with processing and reporting as well.
However, if you screw up data collection, you screw up all subsequent stages. You need to get it right from the get-go, otherwise you’ll berate yourself for the decisions you made or neglected to make along the way.
In the end, all I’m saying is that data is difficult. There are no such things as “power users” of a platform like Google Analytics. There are just “users” and then people who have given up or have never bothered to try.
Tools and platforms should not try to make analysis easier by dumbing things down. No, they should facilitate data collection and processing, so that 90% of resources could actually be spent on doing the analysis.
Experience, education, and a data-driven mindset are the ingredients to successful analytics. Going beyond the default feature set of a platform; integrating, combining, and visualizing data; and tweaking the data collection mechanism to better reflect your business objectives are things you will need to pick up along the way as well.