Container Visualizer for Google Tag Manager
[UPDATE:] Quite a lot of people had trouble accessing the tool after I published this post. This should now be fixed.
So, AWESOME stuff. The new Google Tag Manager UI and API have just rolled out, and I can finally start revealing the stuff I’ve been working on :)
I’m not going to go into the new UI in this post. I just want to give a huge thanks to the GTM team for working on the UX with such dedication. The big problem with GTM so far has been that newcomers and non-developers (and why not developers as well) don’t get the flow of the tool. There’s no indication of “what to do next”, or “what’s taking place right now”. These are some of the things that have been remedied in this release.
But the API. Oh man, the API. I love it. It lets me do such cool things with it. I’ve got a bunch of tools in the prototype-stage, including:
-
Container Cloner (copy container(s) from account to account)
-
Tag Cloner (copy tag(s) from container to container)
-
Macro Cloner (copy macro(s) from container to container)
-
Rule Cloner (copy rule(s) from container to container)
-
Container Visualizer (read more below)
I’m not ready to go public with them for two reasons: 1) I’m still using the free App Engine plan, meaning quotas will burst if dozens of people start cloning GTM assets at the same time (yes, I’m that confident about the tools’ popularity), and 2) I’m not a visual developer, so the tools look like crap.
(UPDATE: I caved and made the other tools public as well. See this post for more info.)
But there is one tool I want to make public now, because I’m so furiously proud of it. So here we go.
XThe Simmer Newsletter
Subscribe to the Simmer newsletter to get the latest news and content from Simo Ahava into your email inbox!
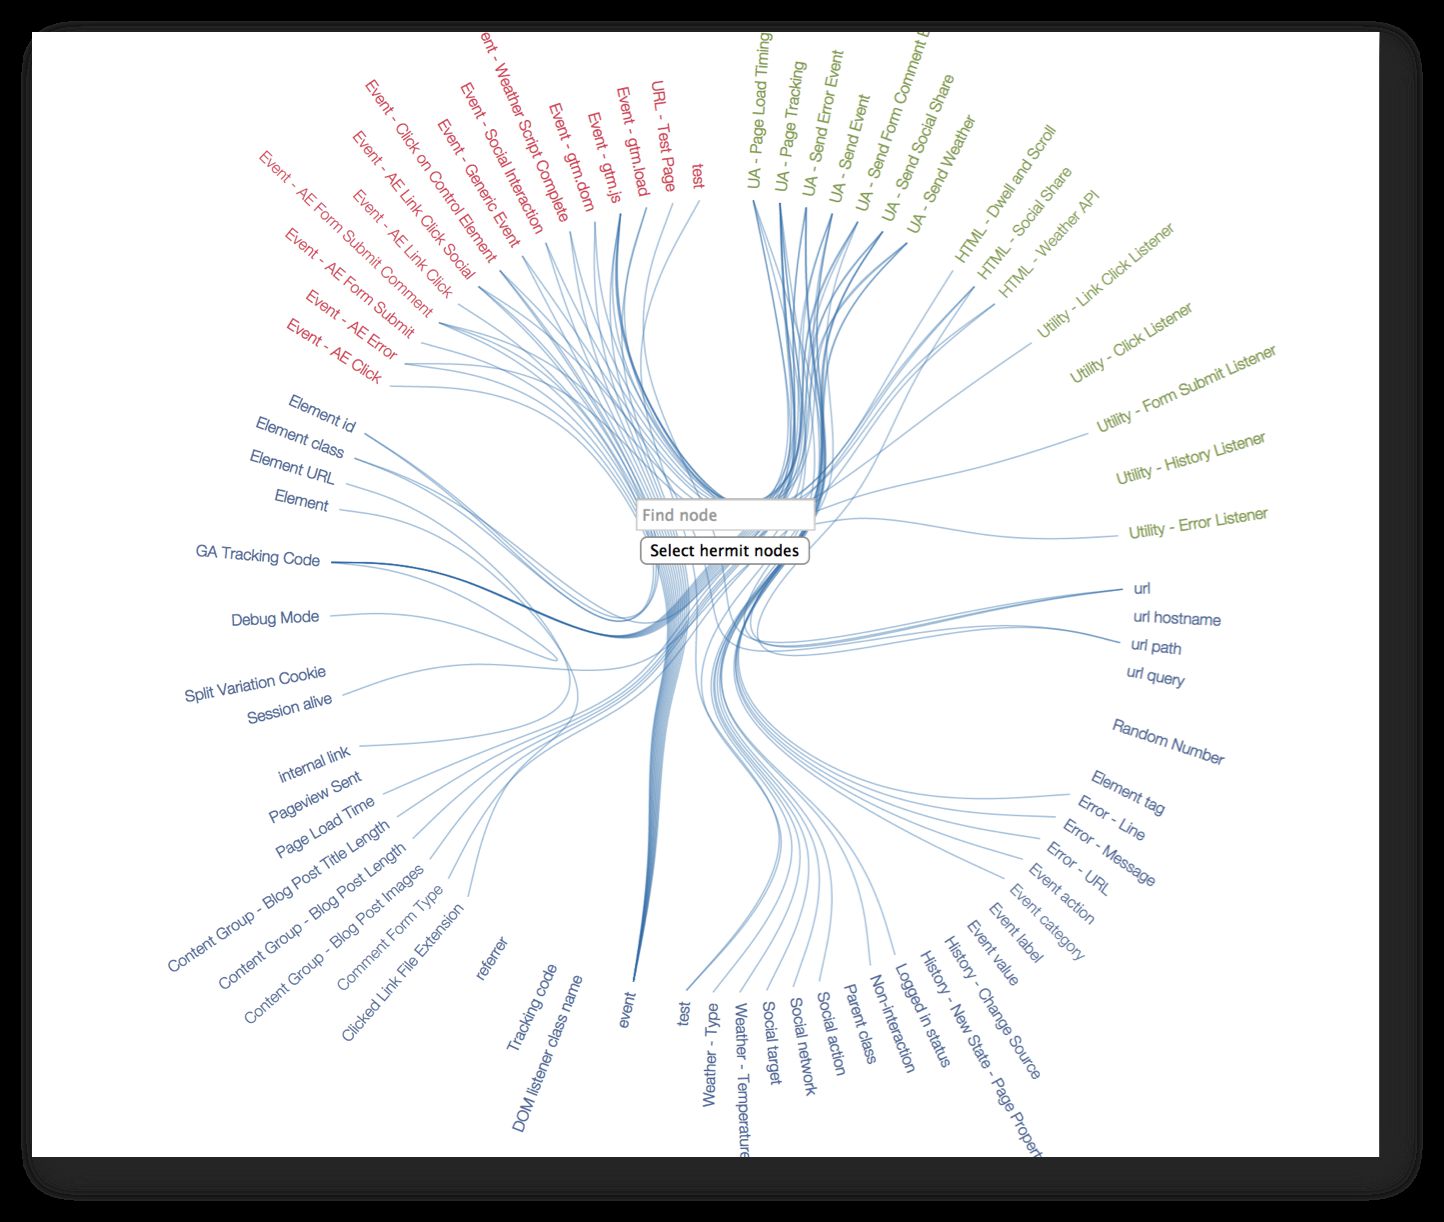
Container Visualizer
It’s a little tool that lets you visualize all links and relationships between the tags, macros, and rules of a container.
You can find the tool here: Container Visualizer (GTM Tools @SimoAhava). I haven’t tested extensively across browsers, so it might look a bit different depending on which browser you use.
Here’s how it works:
-
First you need to authenticate your Google ID to use the API
-
Next, choose an account whose container you want to inspect
-
Then choose a container in that account
-
Now you should see the diagram with all your nodes
-
Hover over a node to see its connections
-
Click a node to freeze its state (click again anywhere to release)
-
Click “Select hermit nodes” to select nodes with no links
-
Start typing to find a specific tag, macro, or rule
-
Click “Full screen” to view a larger version of the visualization
I think this is a pretty darn sweet tool to see how vibrant your container is. If you have the average container, you should see a lot of links to the {{event}} macro and the {{url}} macro, but if you want a healthy container, you should see very few hermit nodes or assets with just single links.
For the visualization, I did some heavy modifications to the Hierarchical Edge Bundling visualization built with the amazing d3.js library.
Technology-wise it’s all Python, JavaScript, and HTML templates.
I’ll try to muster up the courage to publish the other apps in my GTM Tools @SimoAhava collection soon.
Let me know what you think about the whole idea of visualizing your data assets!