Google recently released a new version of Google Analytics called App + Web. Clumsy name aside, this really is for all intents and purposes Google Analytics V2 or Firebase Analytics for the Web. We’re not talking about a charming way to do roll-up reporting between Google Analytics for Firebase and Universal Analytics, nor are we talking about an enhancement to Universal Analytics.
No, we’re talking about a new measurement model for web traffic, which has the convenience of being compatible with Google Analytics for Firebase, which you might already have running in your apps.
It’s still, ahem, slightly unpolished, and the documentation is still, ahem, slightly lacking, so I thought I’d give you a head start by showing how to set up data collection using Google Tag Manager. I fully intend to release a proper, comprehensive guide once the feature rolls out of beta, but this article should serve those of you who are dying to get your hands on the new property and all the goodness within.
The name Google Analytics: App + Web is a bit awkward. I suppose it’s just a matter of time before we’ll call it Firebase for the Web or something similar, since that’s what it essentially is. In this article, I’ll refer to it as GAv2 in places where I just can’t be bothered to spell it out (yes, I’m lazy).
Before I start, open Krista Seiden’s amazing blog in a new tab, and focus especially on the three articles she’s published on the reporting capabilities of Google Analytics: App + Web.
UPDATE: Just after I published this article, Krista released yet another excellent guide, and the best thing is that it’s complementary to this one, as it covers the steps of creating the Firebase project in much more detail. So check it out: Step by Step: Setting up an App + Web Property.
I’ll start off with some introductory words, so if you want, you can just skip right to the implementation steps.
The Simmer Newsletter
Follow this link to subscribe to the Simmer Newsletter! Stay up-to-date with the latest content from Simo Ahava and the Simmer online course platform.
Caveats
First of all, Google Analytics: App + Web is in beta. That means that it’s not ready yet. Seriously, it’s not ready yet. Many of the things I’m scratching my head about will no doubt enter the platform at some point, and many of the questions you have will certainly be answered by upcoming feature releases.
Some of the things I found to be missing from the reporting UI and the Google Tag Manager setup include:
No specialized reports, e.g. “Site Search report”, or “Ecommerce” reports.
No way to distinguish between automatically collected, recommended, and custom events in the reporting UI.
No way to set user properties in the GTM tags.UPDATE: You can set User Properties, see below.No way to send the
itemsarray (or any other multi-dimensional object) as an event parameter to Google Analytics when using GTM.Setting persistent values in the configuration tag in GTM did not seem to work.
No way to upgrade an existing Firebase Analytics property to an App + Web property.UPDATE: You can upgrade existing Firebase Analytics properties per this support doc. When you open the property in Google Analytics (assuming you’ve linked the property in Google Analytics), you’ll see a blue banner in the top of the screen prompting you to upgrade.
Be sure to follow the official blog as well as Krista, as they will be your go-to channels for more information including releases that address the concerns listed in this chapter.
Then there’s the obvious thing. This is not Universal Analytics. Many of the things you’re used to seeing in Universal Analytics are not present in Firebase. Personally, I hope that feature parity is not in the horizon, as now Google have the chance to create something new and better. But naturally, we’d want the platform to replace Universal Analytics at some point, so at the very least it should cater to the same use cases.
Here are, in my view, the main differences between Universal Analytics and the new platform.
| Universal Analytics | Google Analytics V2 |
|---|---|
| Sessions in the foreground. | Users and events in the foreground. |
| Hit-, session-, and user-scoped custom definitions. | User properties and custom event parameters. |
| Superficial Real Time reports. | StreamView and DebugView permit more comprehensive drill-down. |
| Segments. | Audiences. |
| No semantic structuring. | Automatically collected and recommended events. |
| Fairly forgiving quotas and limits (apart from sampling). | Strict quotas and limits (no sampling). |
The limits are especially painful if you compare them with what you had in Universal Analytics.
Anyway, I’m sure these concerns will be addressed before the Google Analytics: App + Web rolls out of beta, but one thing is for certain: this is not Universal Analytics. Try to look at the new measurement model as an opportunity to go beyond what Universal Analytics ever could, rather than just another way to populate GA’s ancient data model.
Due to these caveats, I strongly recommend against cutting off your Universal Analytics data collection and solely collecting data to the Google Analytics: App + Web property. If anything, this new measurement model should be run in parallel to whatever setup you already had on the site, so that you can compare parity between the two data sets.
Create a new Google Analytics: App + Web property
To create a new Google Analytics: App + Web property, you will need to follow these steps.
Note! Based on released documentation, it’s probable these steps will be greatly simplified in the future.
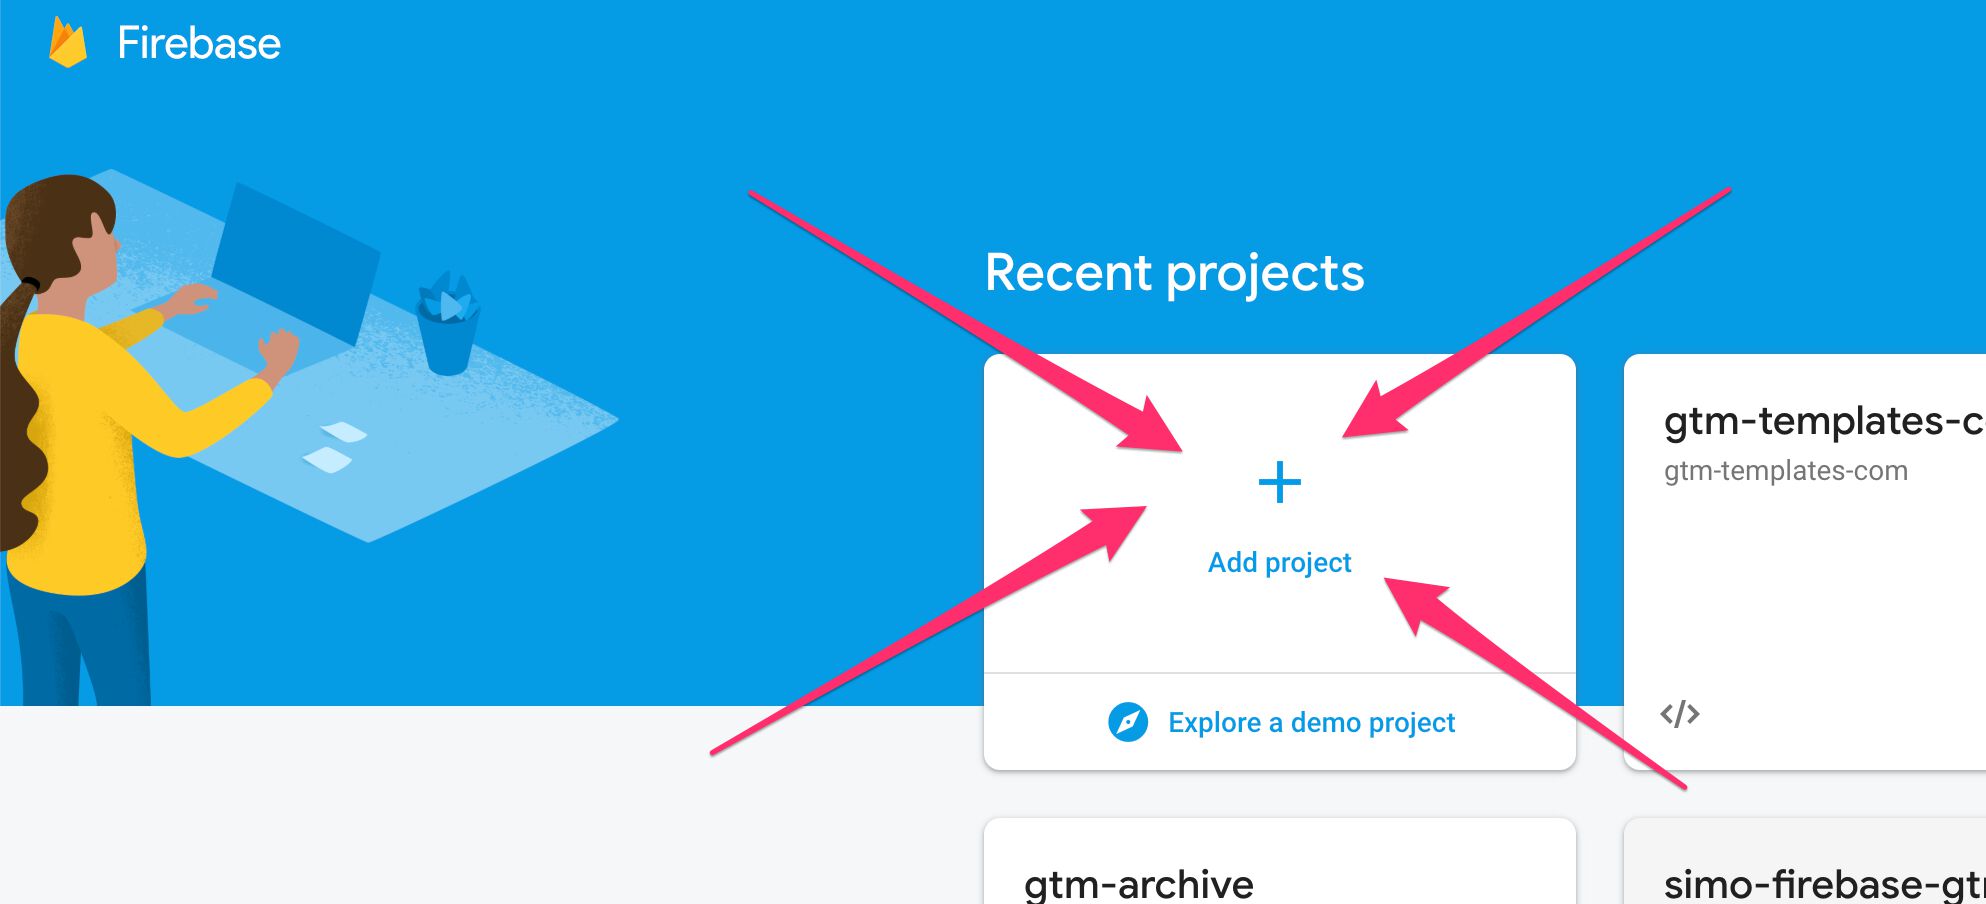
Step 1: Create a new Firebase project
Head on over to the Firebase console, and create a new project. This will be the underlying Firebase project for your new property.
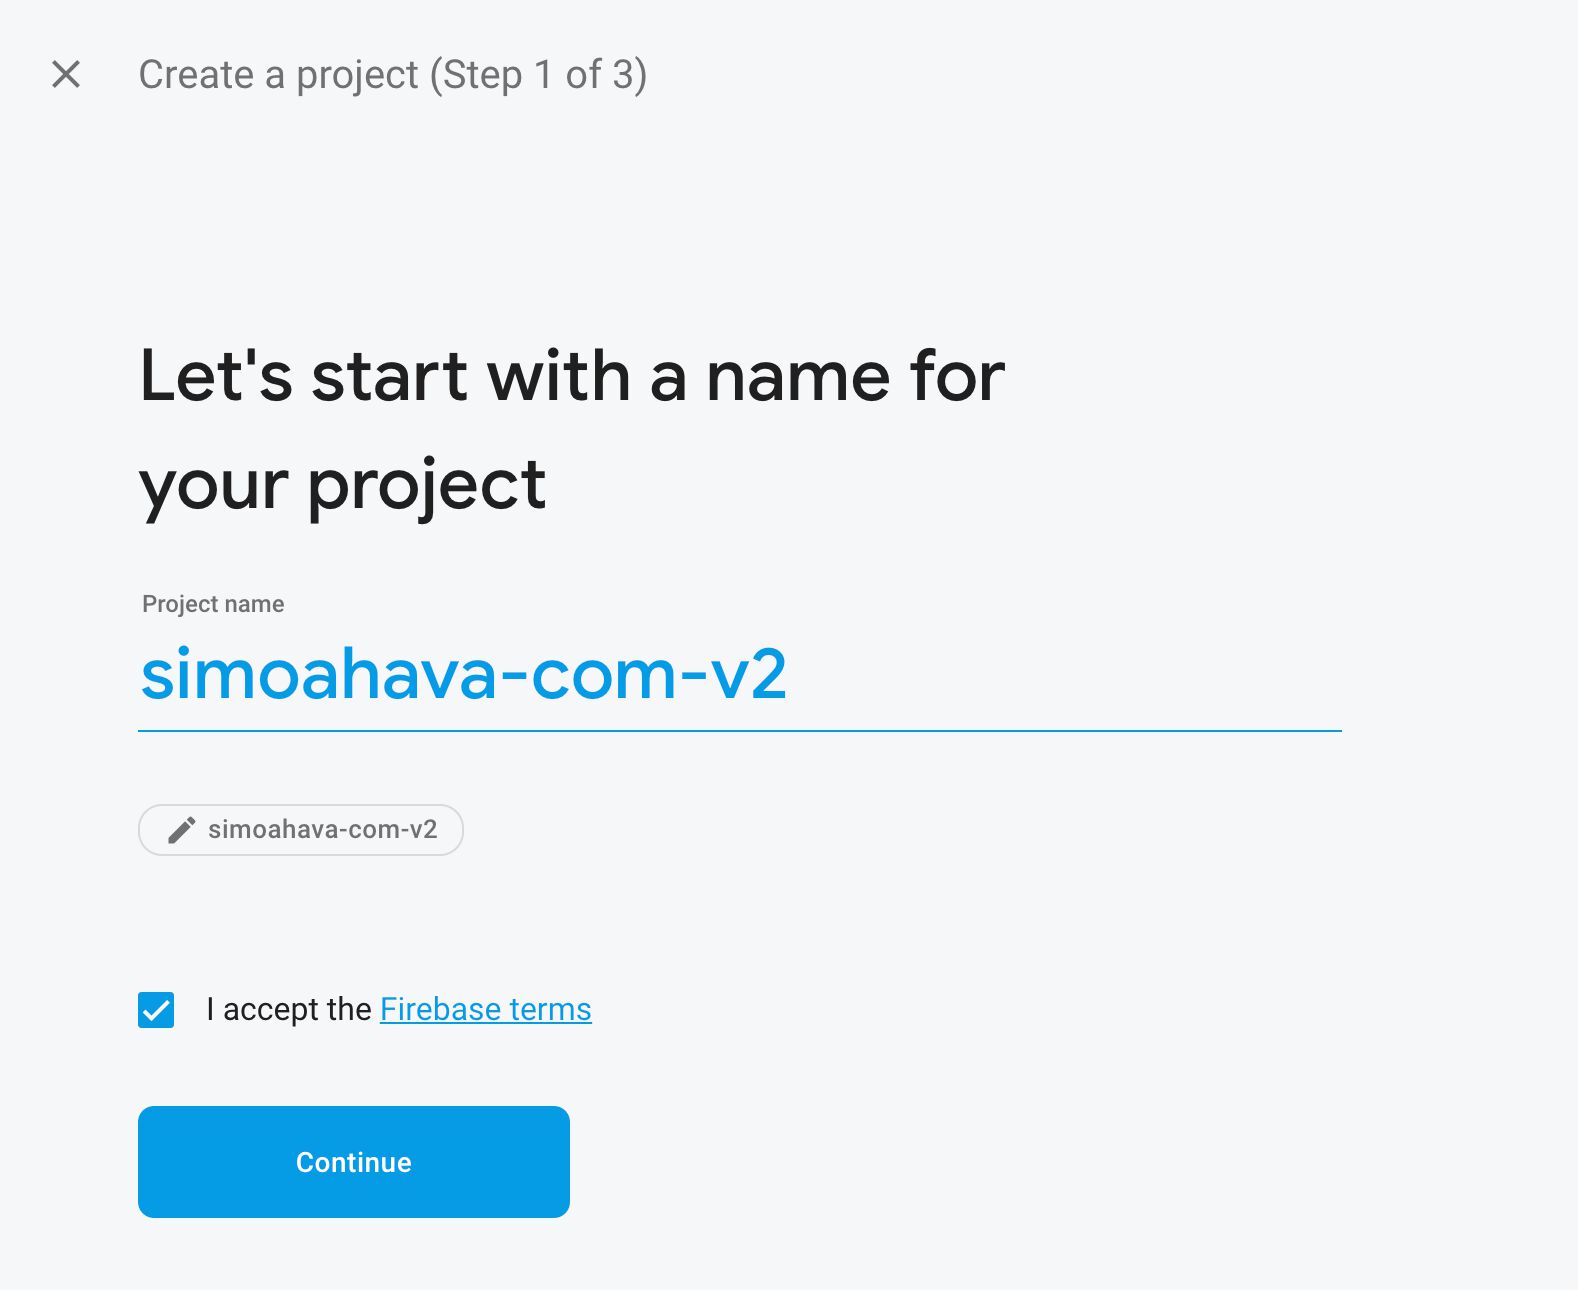
Then, give the project a name and an ID (the ID must be unique, and one is generated for you from the project name).
Read and accept the Firebase terms, and click Continue.
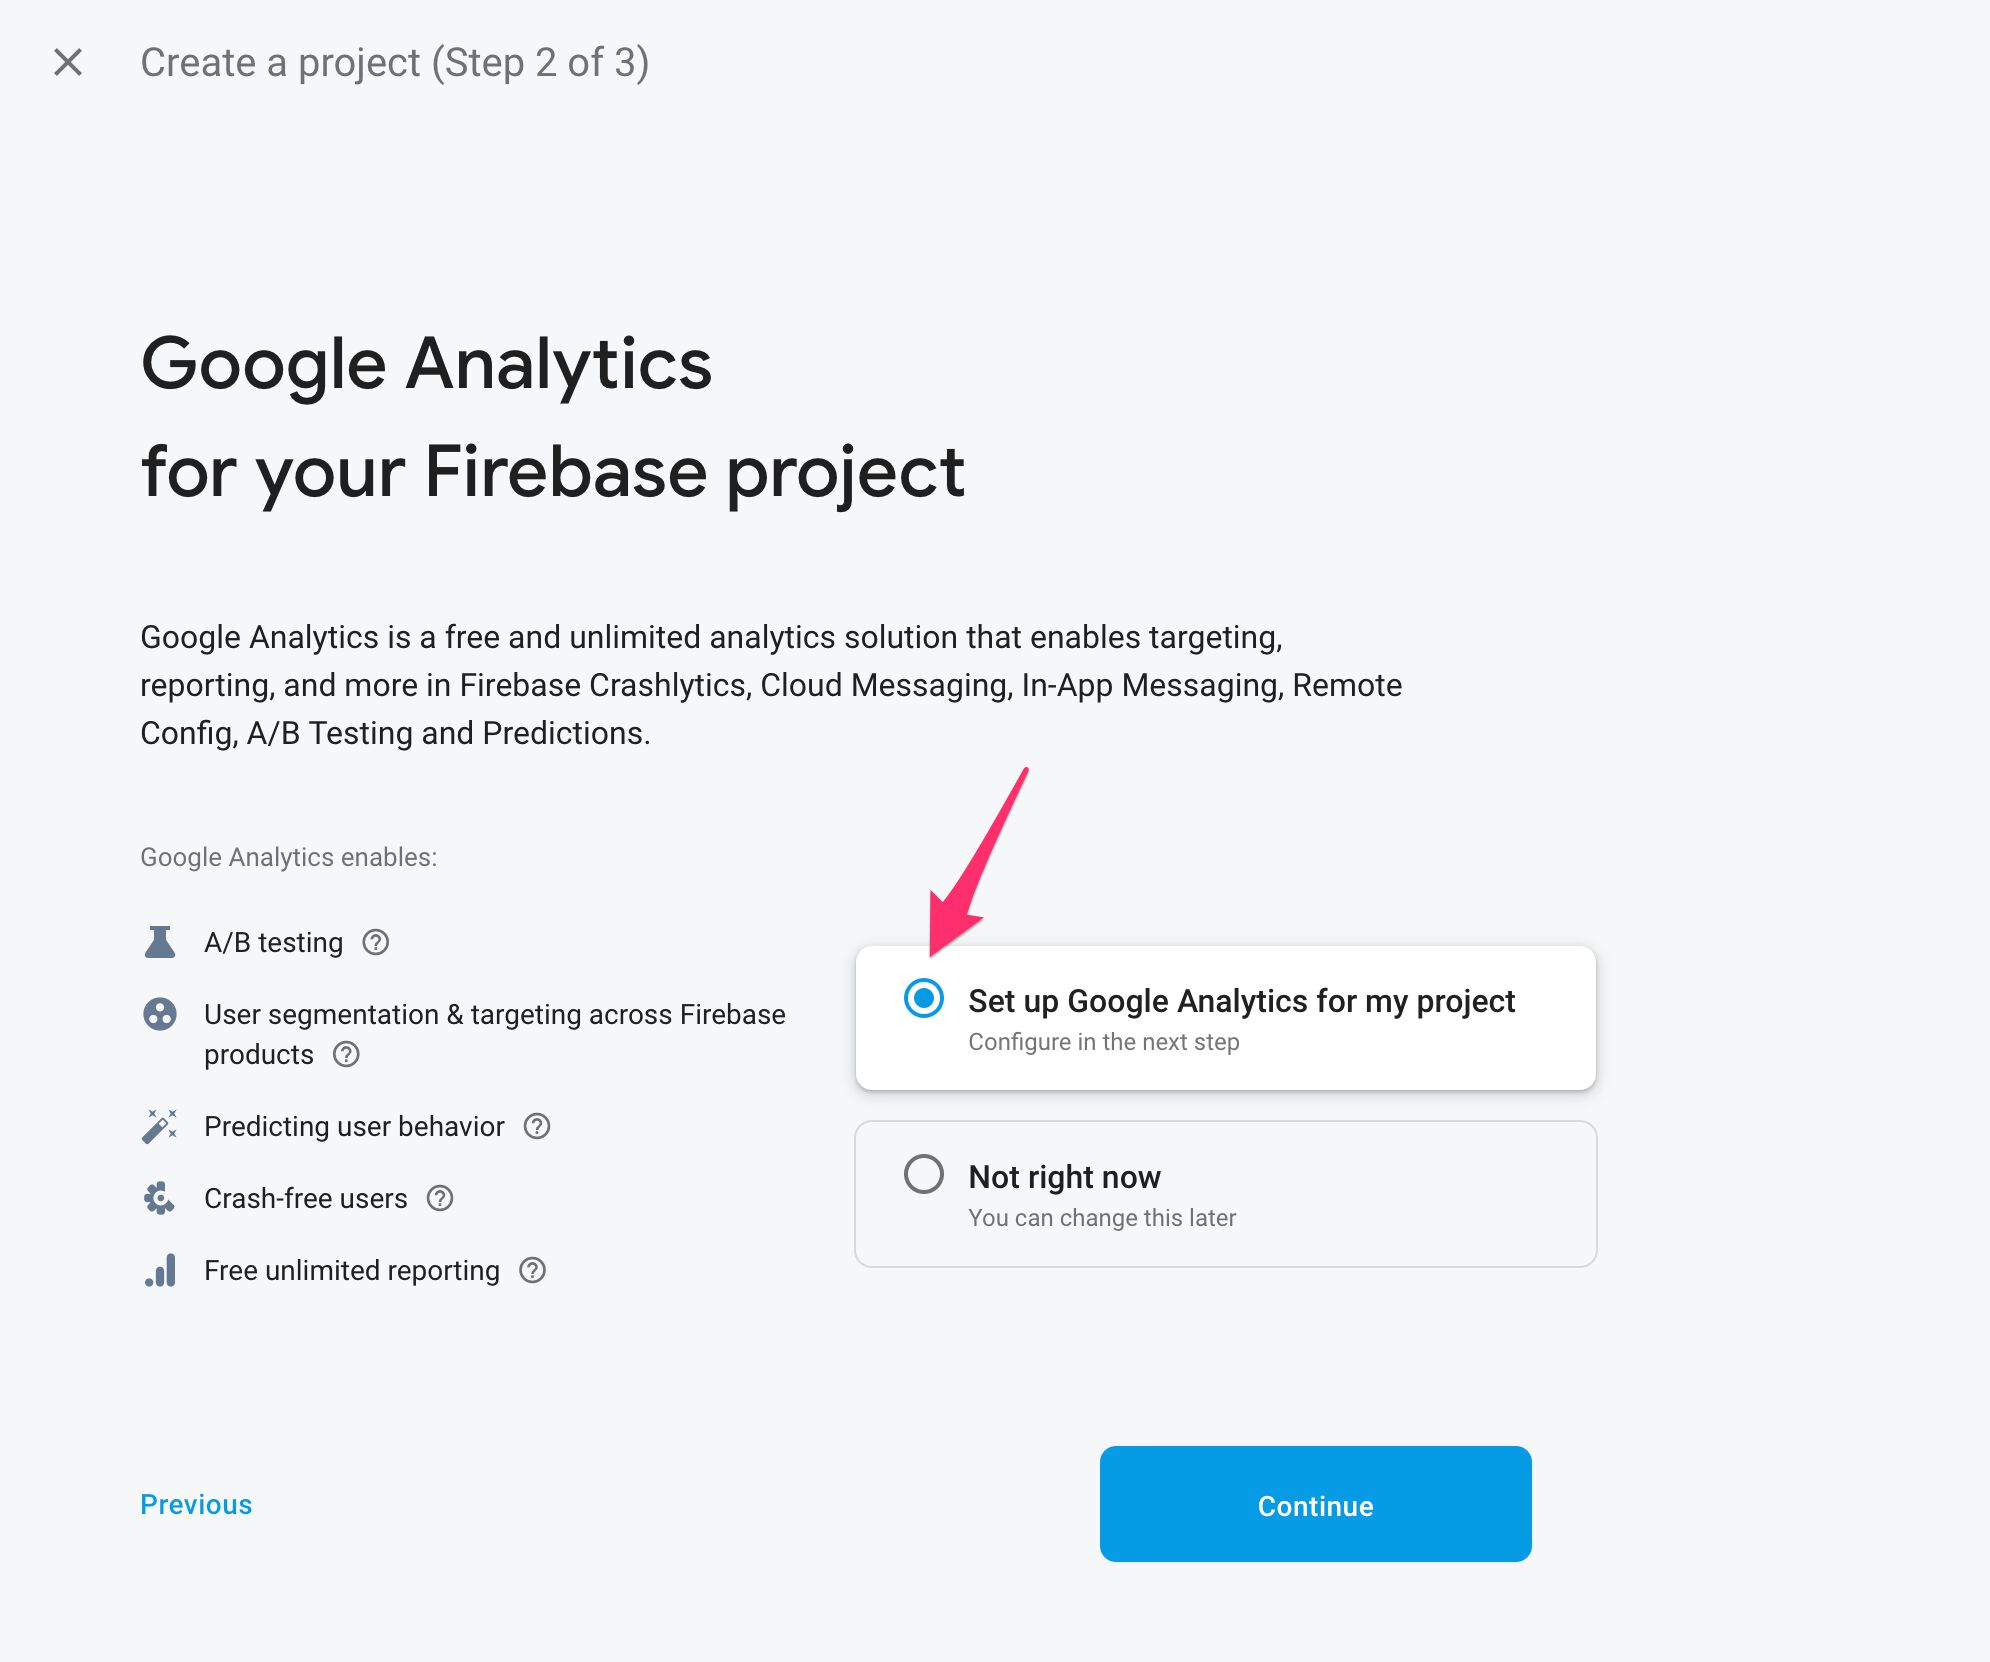
In the next step, make sure the “Set up Google Analytics for my project” is checked, and click Continue.
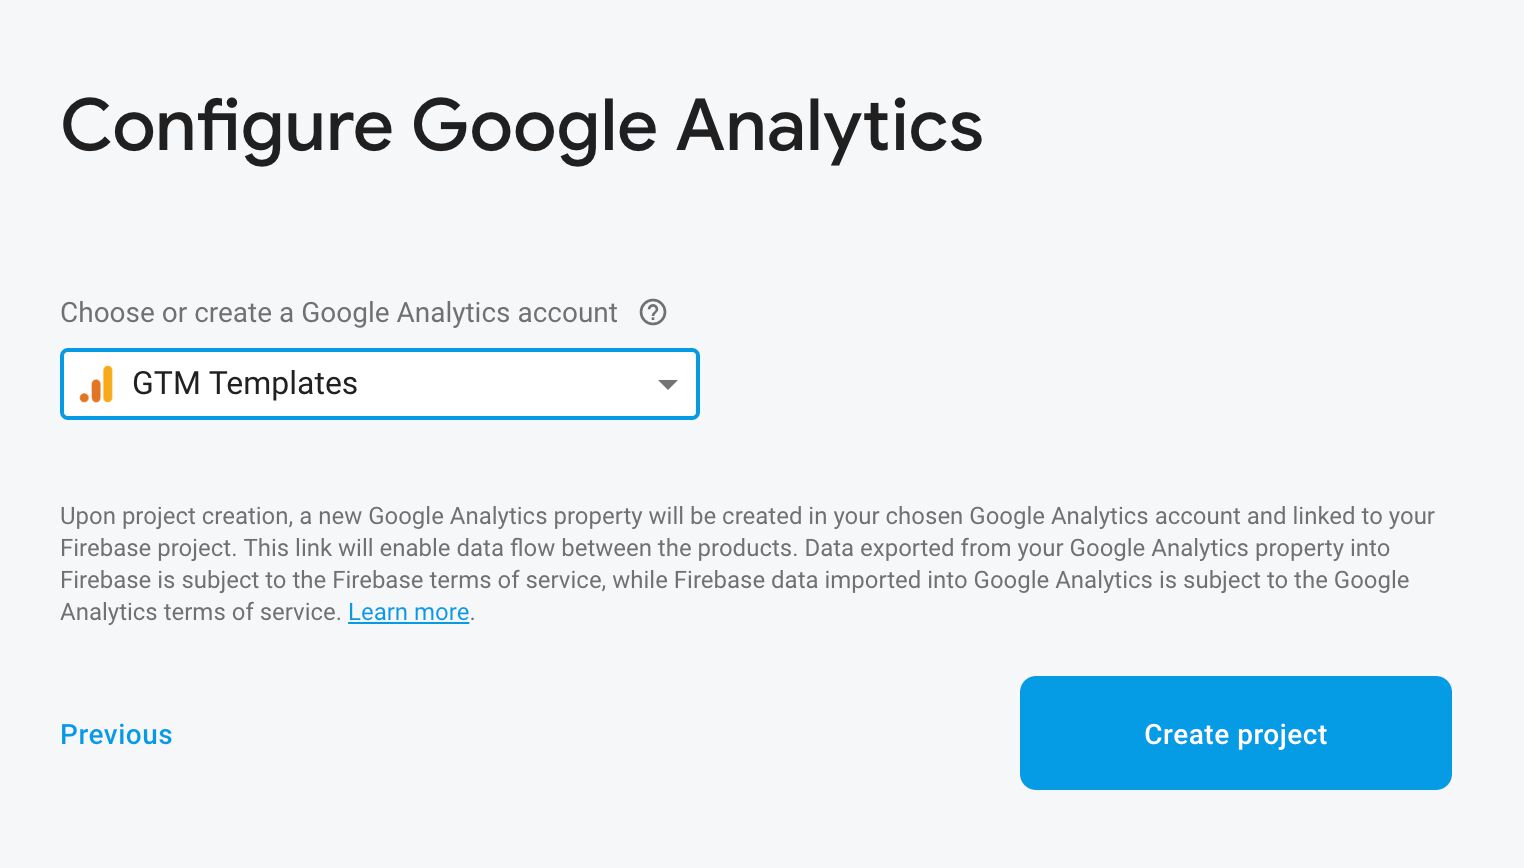
Depending on if you already have a Google Accounts or not, you can now select in which account to create the property in or you can create a new account altogether. If you don’t have any Google Analytics accounts associated with your login, you will need to accept GA’s terms of service and a new account and property will be created for you.
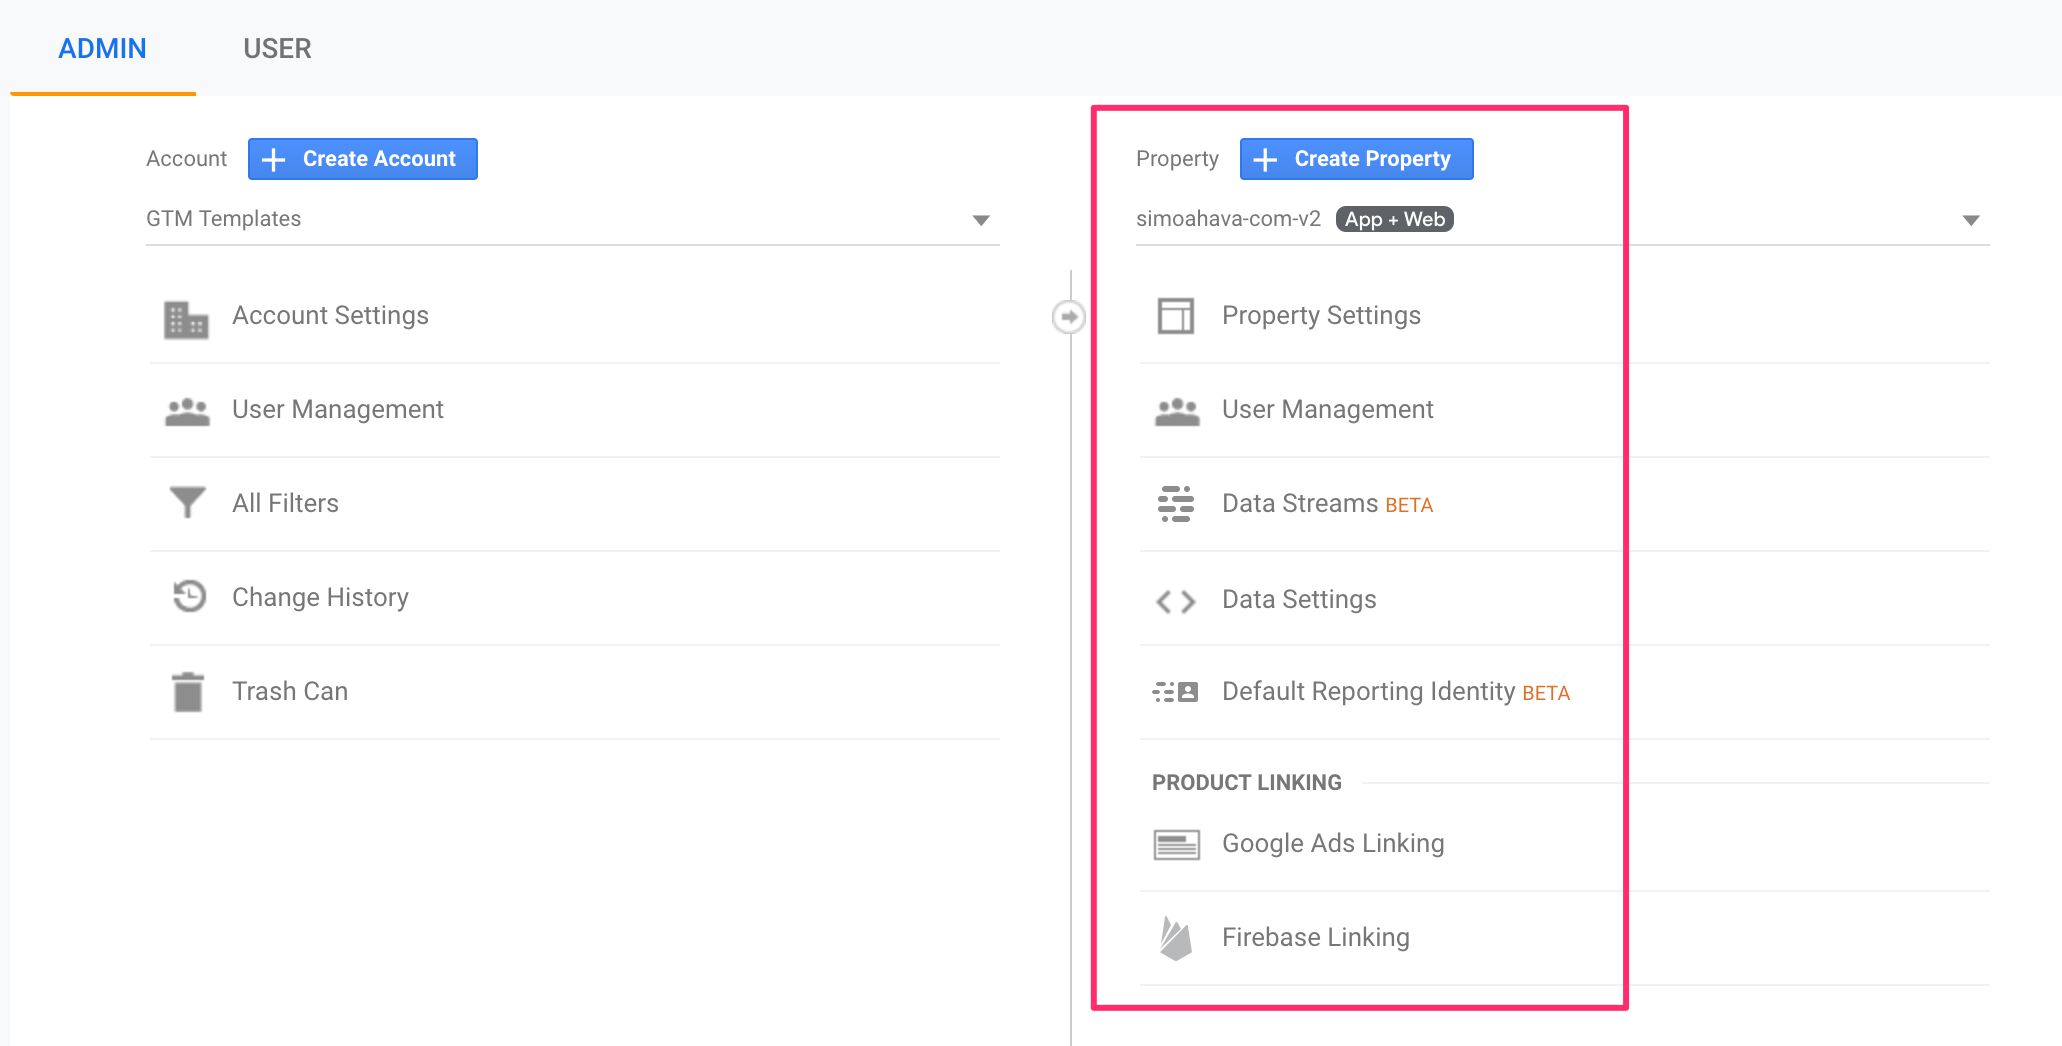
Once you hit Create project and it finishes processing, you can head on over to Google Analytics to find your new App + Web property in the account you selected.
Step 2: Create a new web stream
The new measurement model revolves around streams. Streams can be incoming from your apps (iOS and Android), or from the web. I hope we’ll see new streams in the future, such as a “Measurement Protocol” stream that would accept HTTP requests from any device connected to the internet.
Anyway, click the Data Streams option in the property column and choose Web.
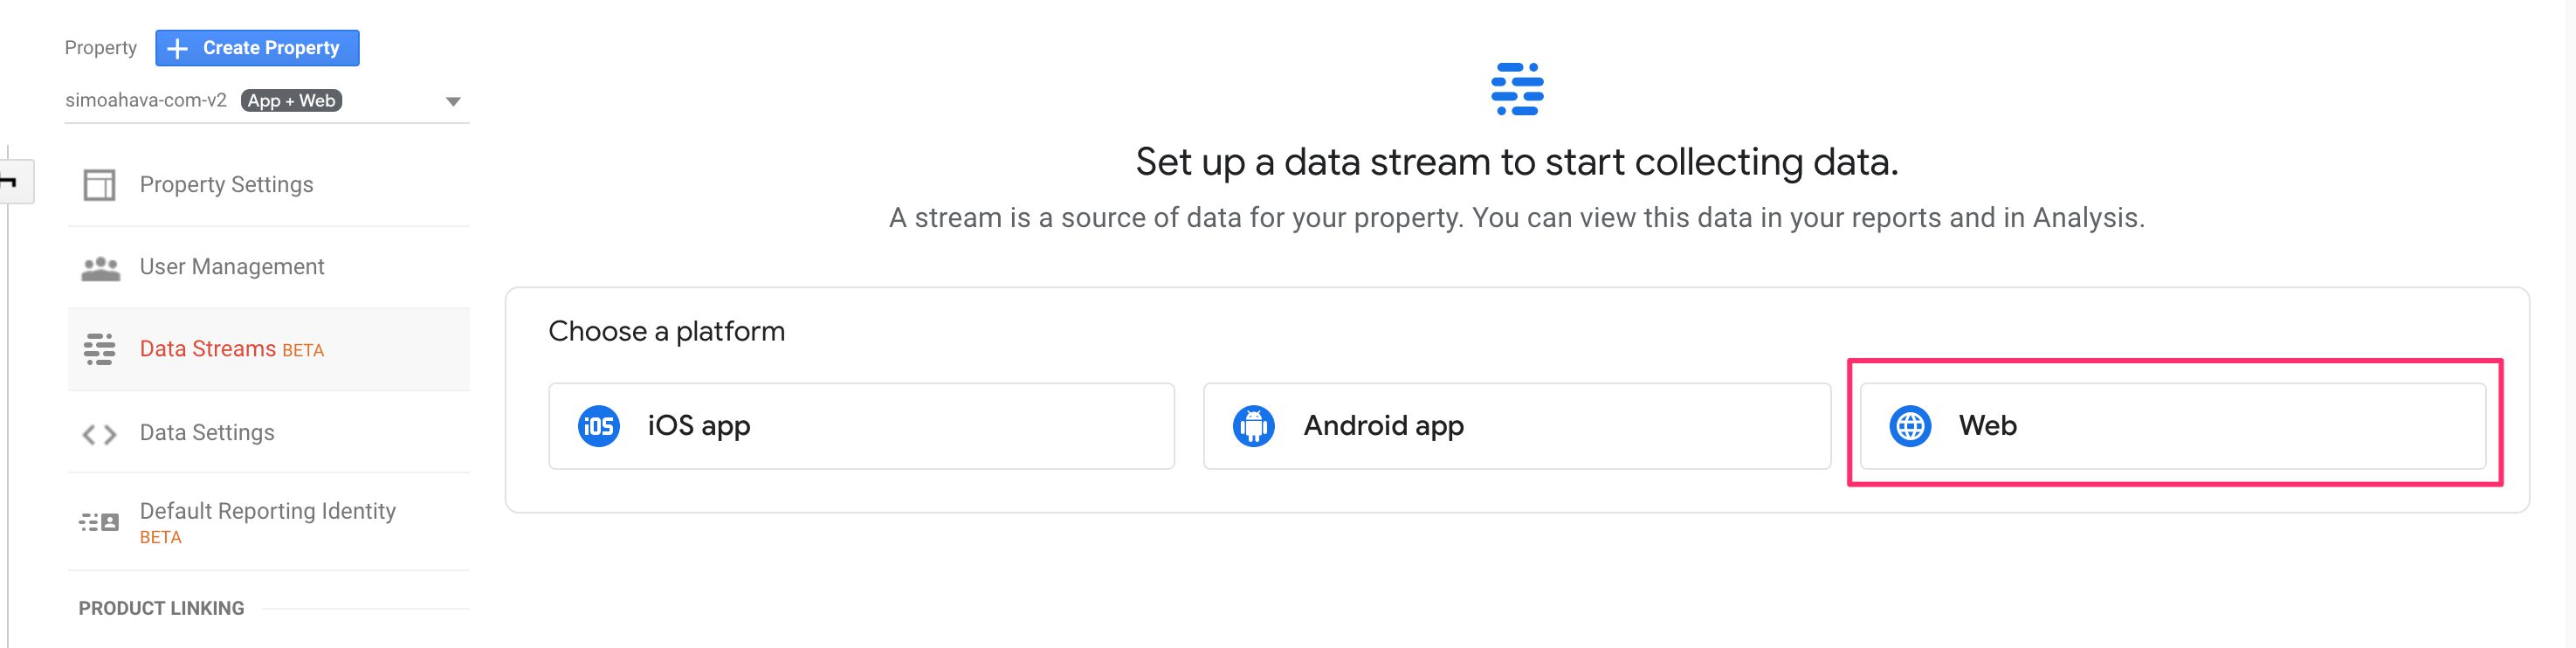
To configure the stream, enter your site URL and give the stream a descriptive name. Next, click the little cogwheel to configure the Enhanced Measurement settings.
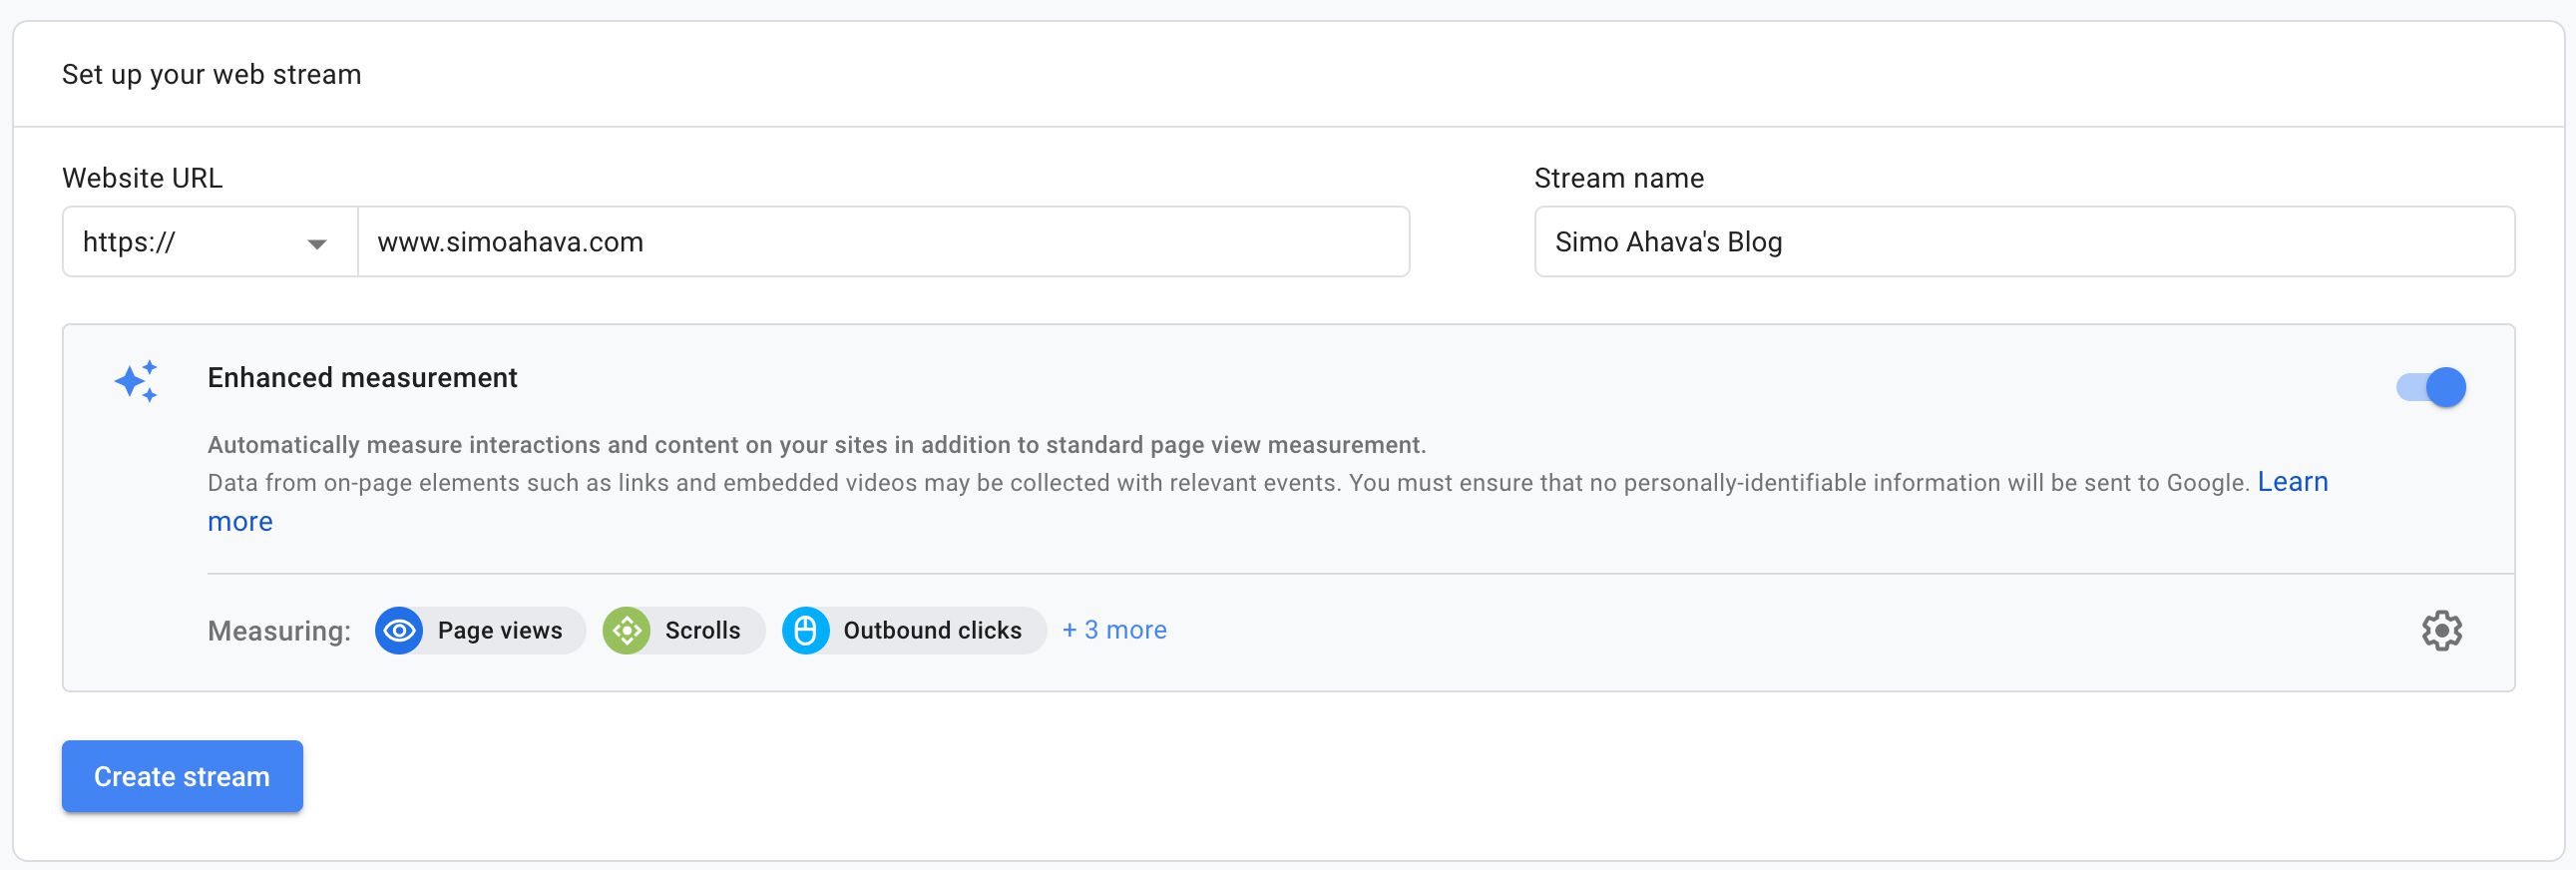
Enhanced Measurement basically adds some automatic tracking capabilities to the site, activated when you create a base configuration tag.
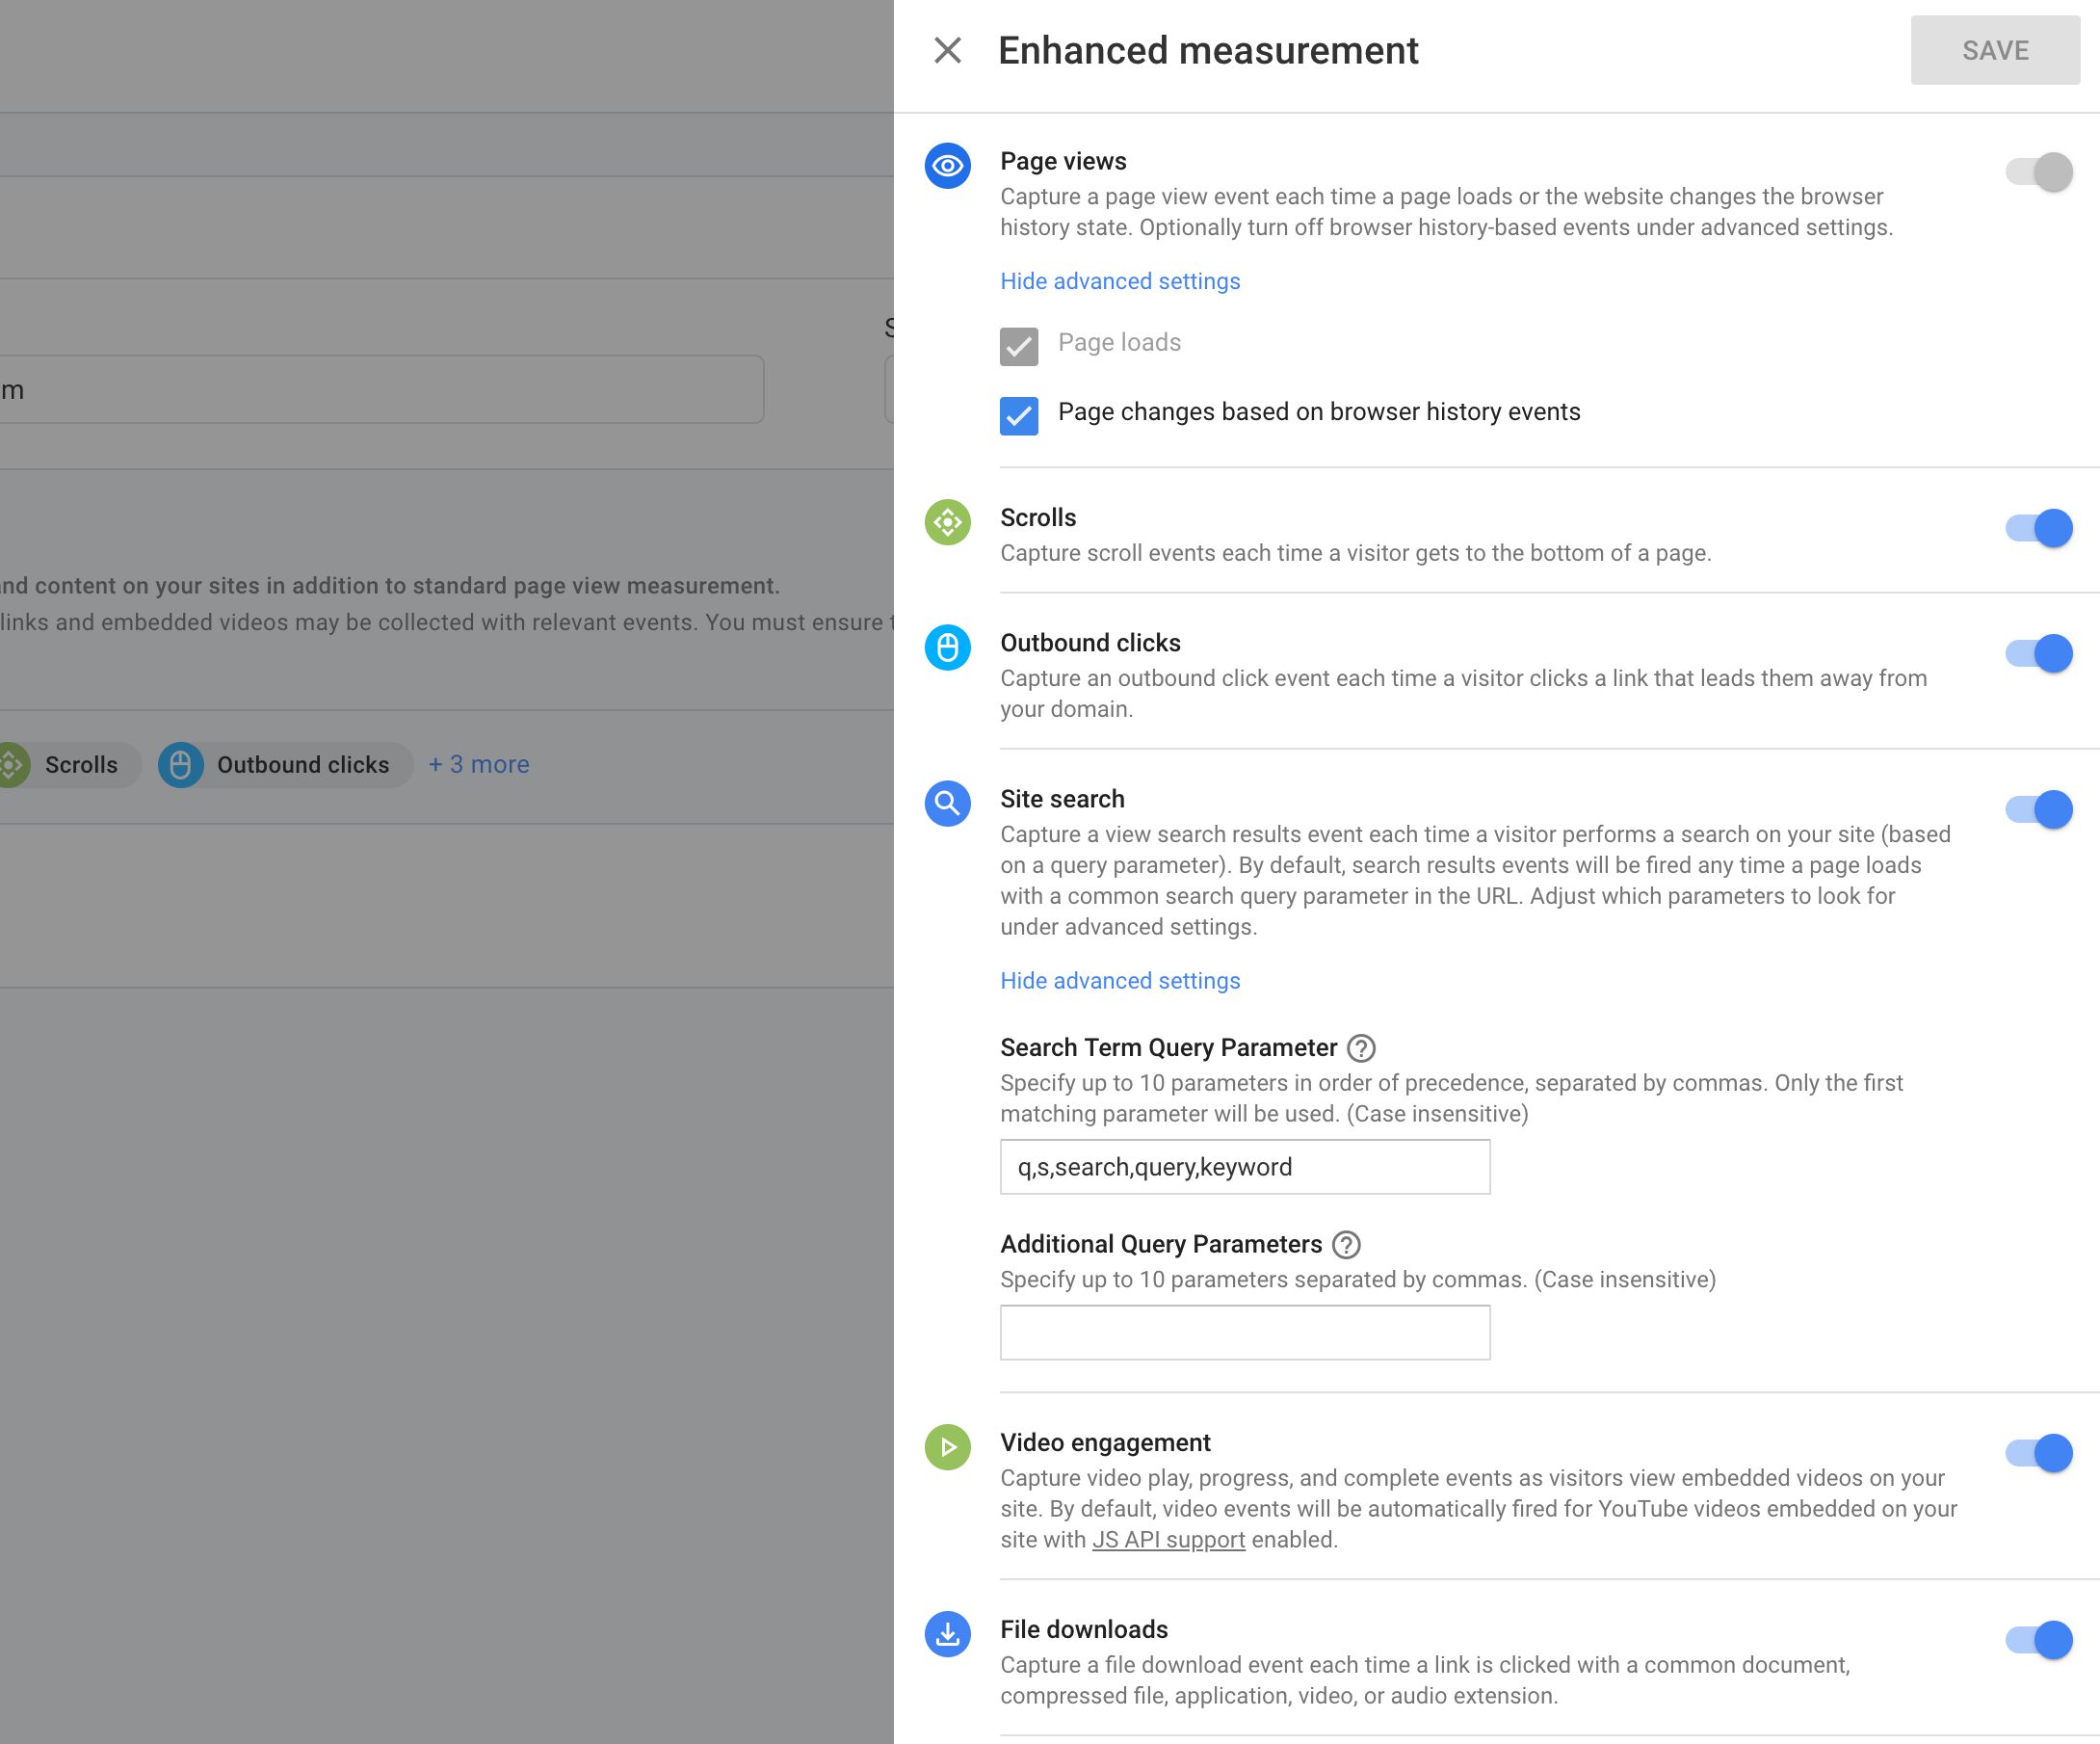
The list of things that can be automatically tracked are fairly clear and explained well in the Enhanced Measurement configuration (see screenshot above).
Once you’re ready, create the data stream and you should see a bunch of Tagging instructions and other stuff in the screen. The most important thing to note is the Measurement ID. Keep this tab open so that you can copy the Measurement ID into your Google Tag Manager tags when required.
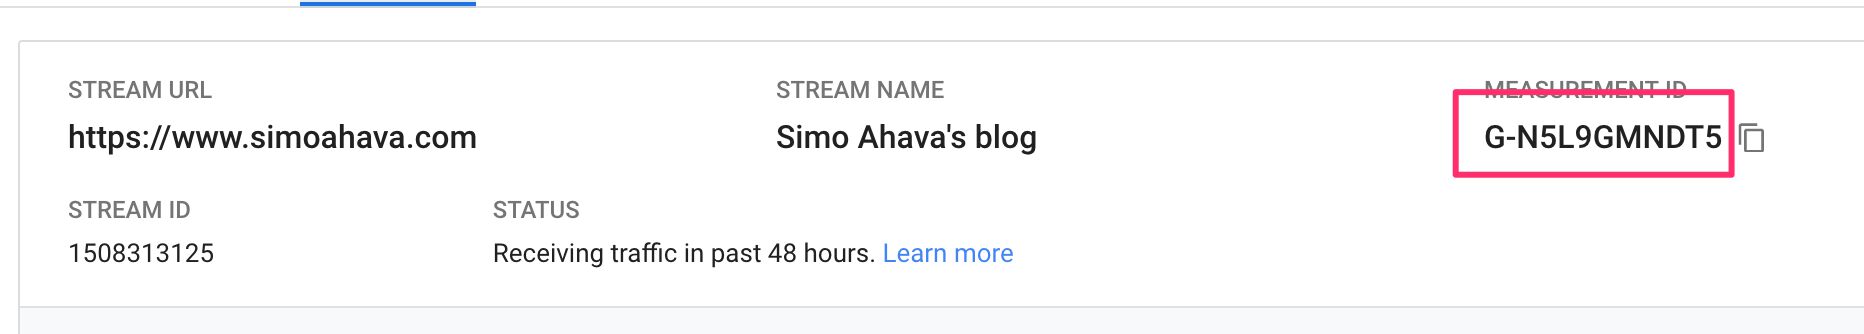
Done? OK, let’s move to Google Tag Manager.
Create a base configuration tag
In Google Tag Manager, when creating a new tag, you’ll see two new tag templates in the selector.
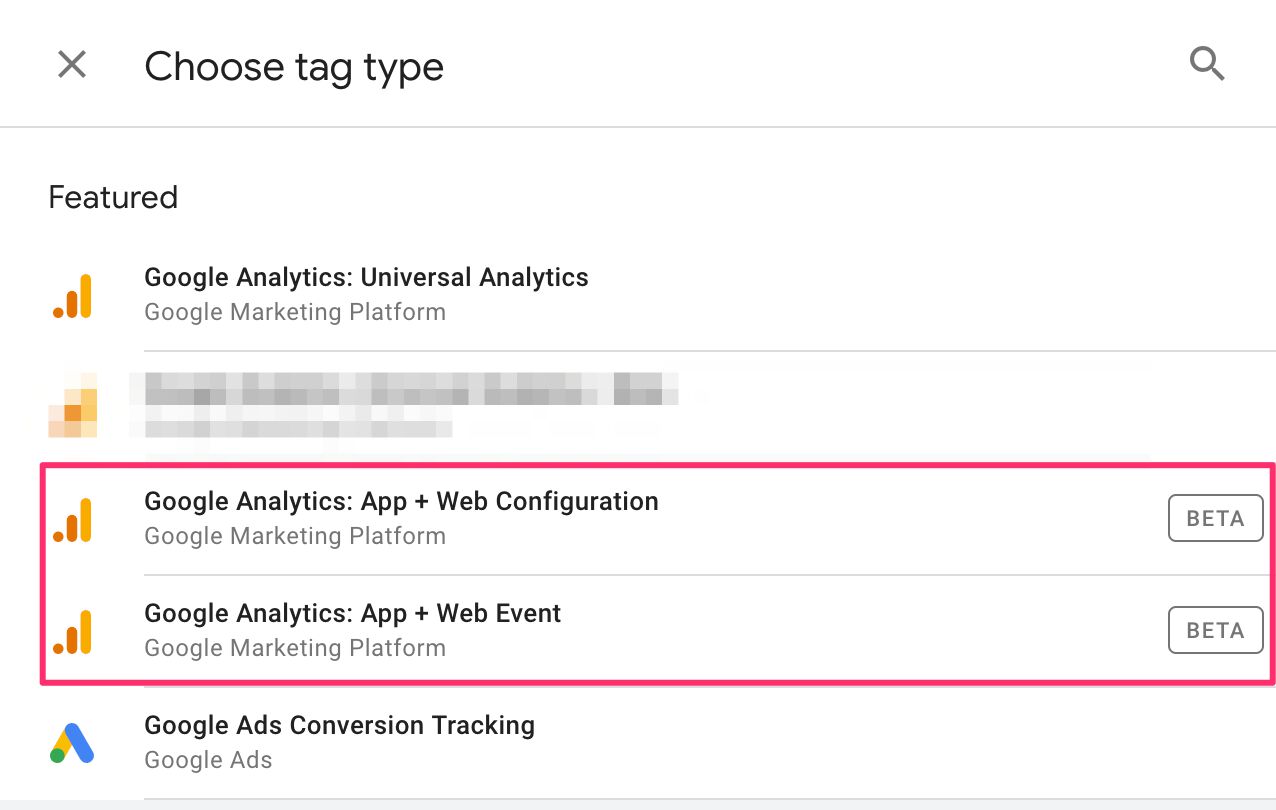
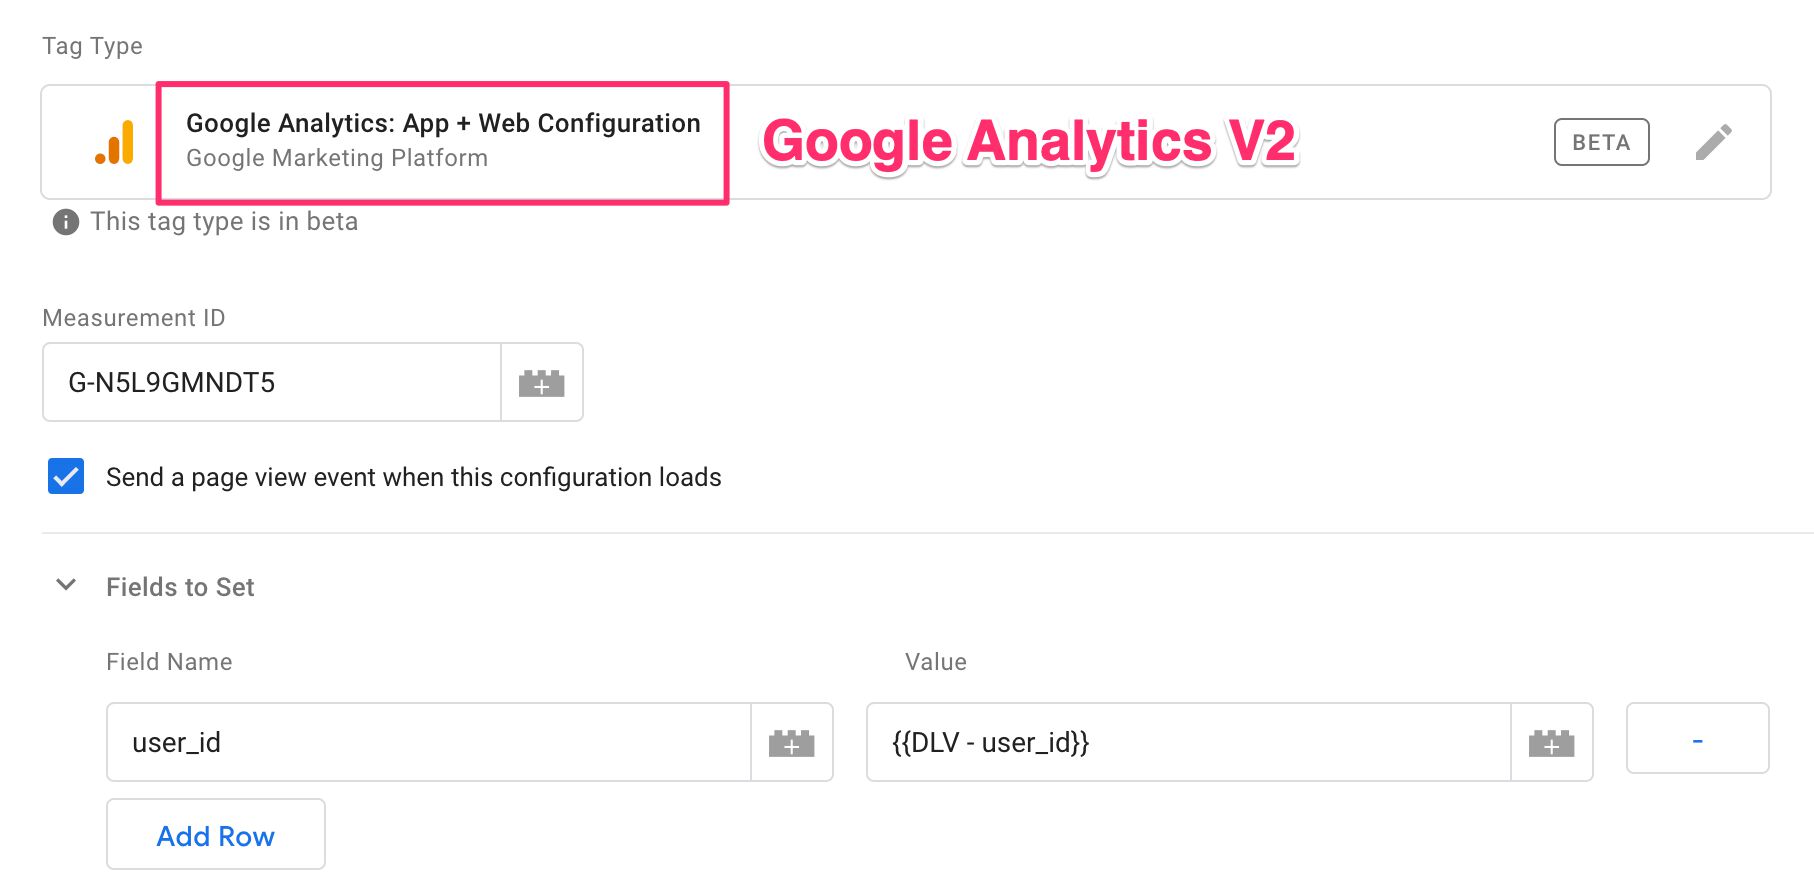
Google Analytics: App + Web Configuration is analogous to the config command used in a gtag.js implementation. You use it to configure the tracker, send the initial Page View, and configure persistent values for all your events.
When you open the template, you’re not exactly greeted with an abundance of options. Basically, you have a field to set the Measurement ID in, a toggle to choose whether to send the initial Page View or not, and configuration fields you can set in the tag.
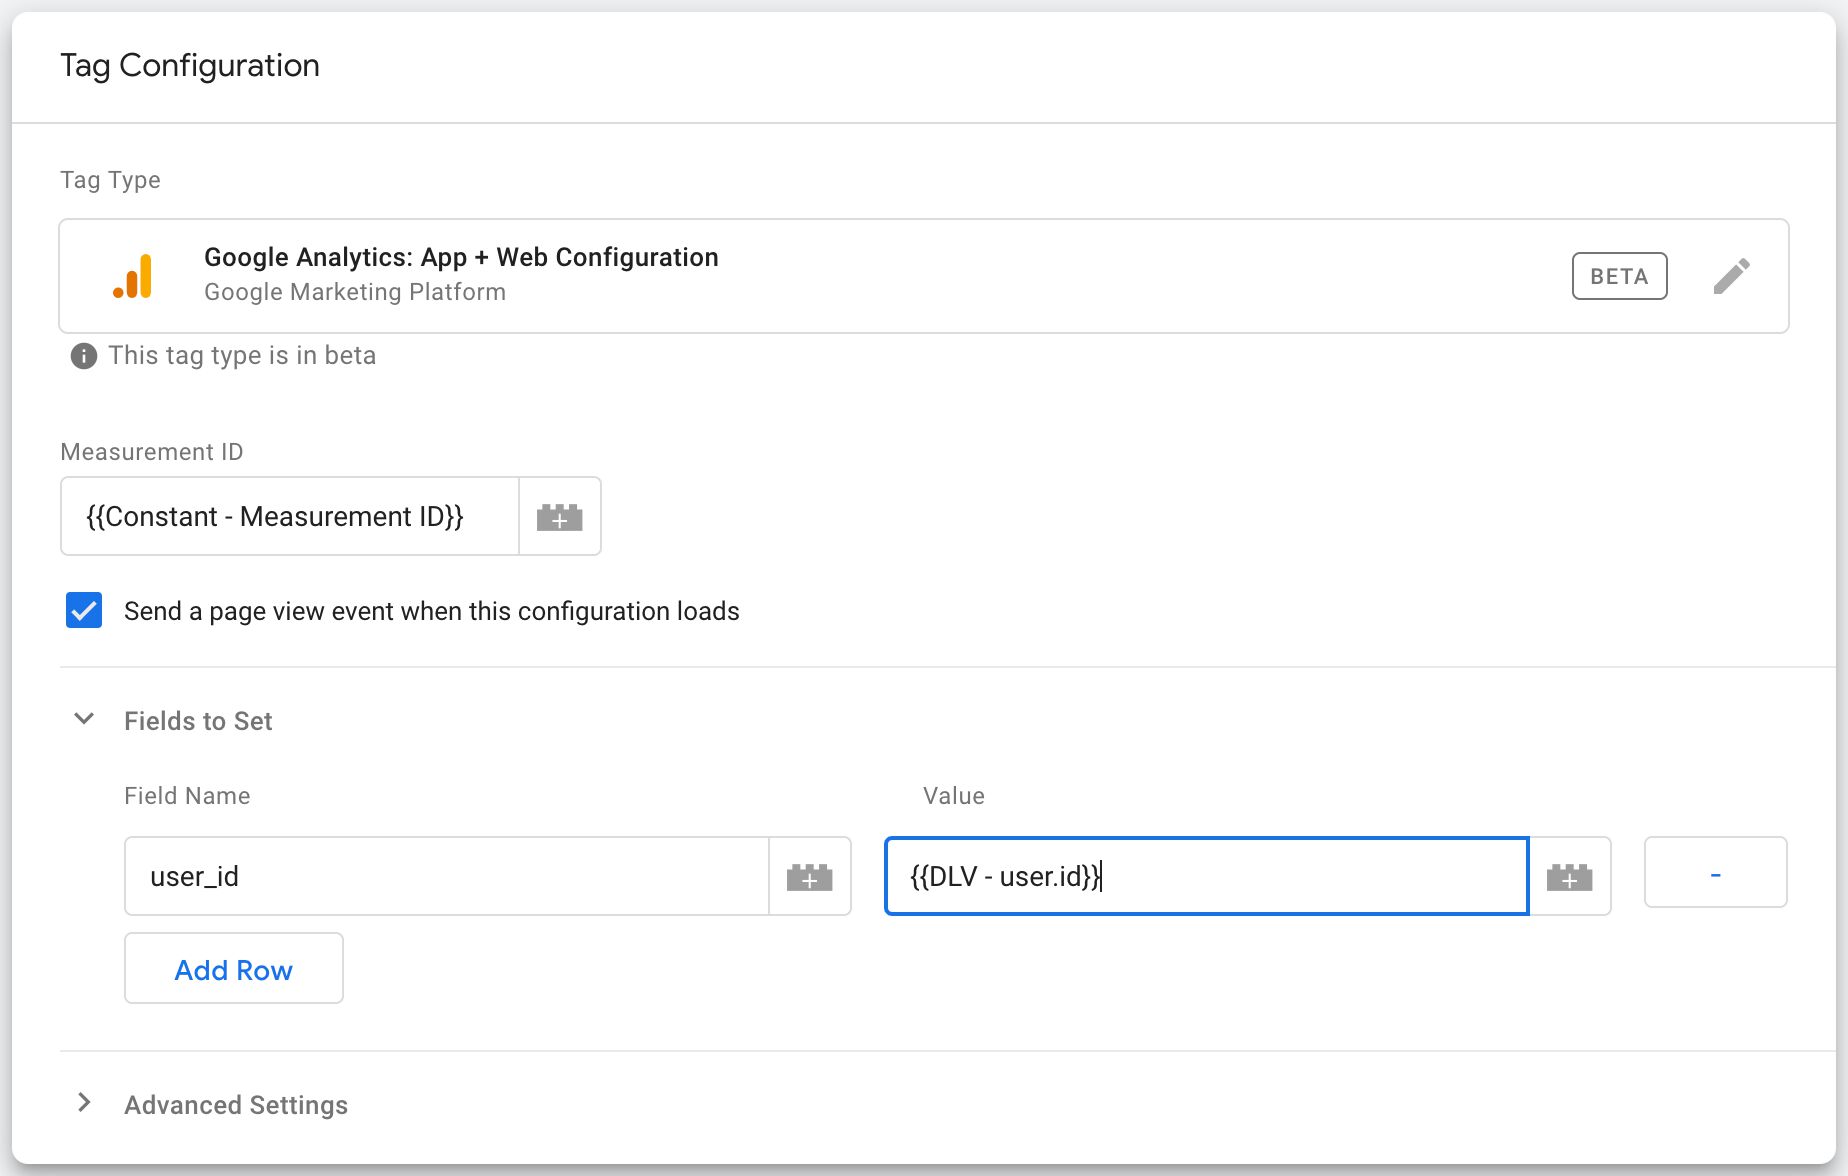
To configure the base tag, set the Measurement ID from the web stream you created in the previous chapter in its field. You can set the user_id field to some value that is linked to the user’s authentication ID, in case you want to pave the path for cross-device and cross-application measurement.
According to the documentation, you should be able to define any event parameters in the Fields to set of the configuration tag, if you want those event parameters to be sent with every subsequent hit that uses the same Measurement ID. Unfortunately, at the time of writing this does not seem to work.
Neither does there seem to be an option to send user properties, so it looks like we’re waiting for updates to the template for those, too.
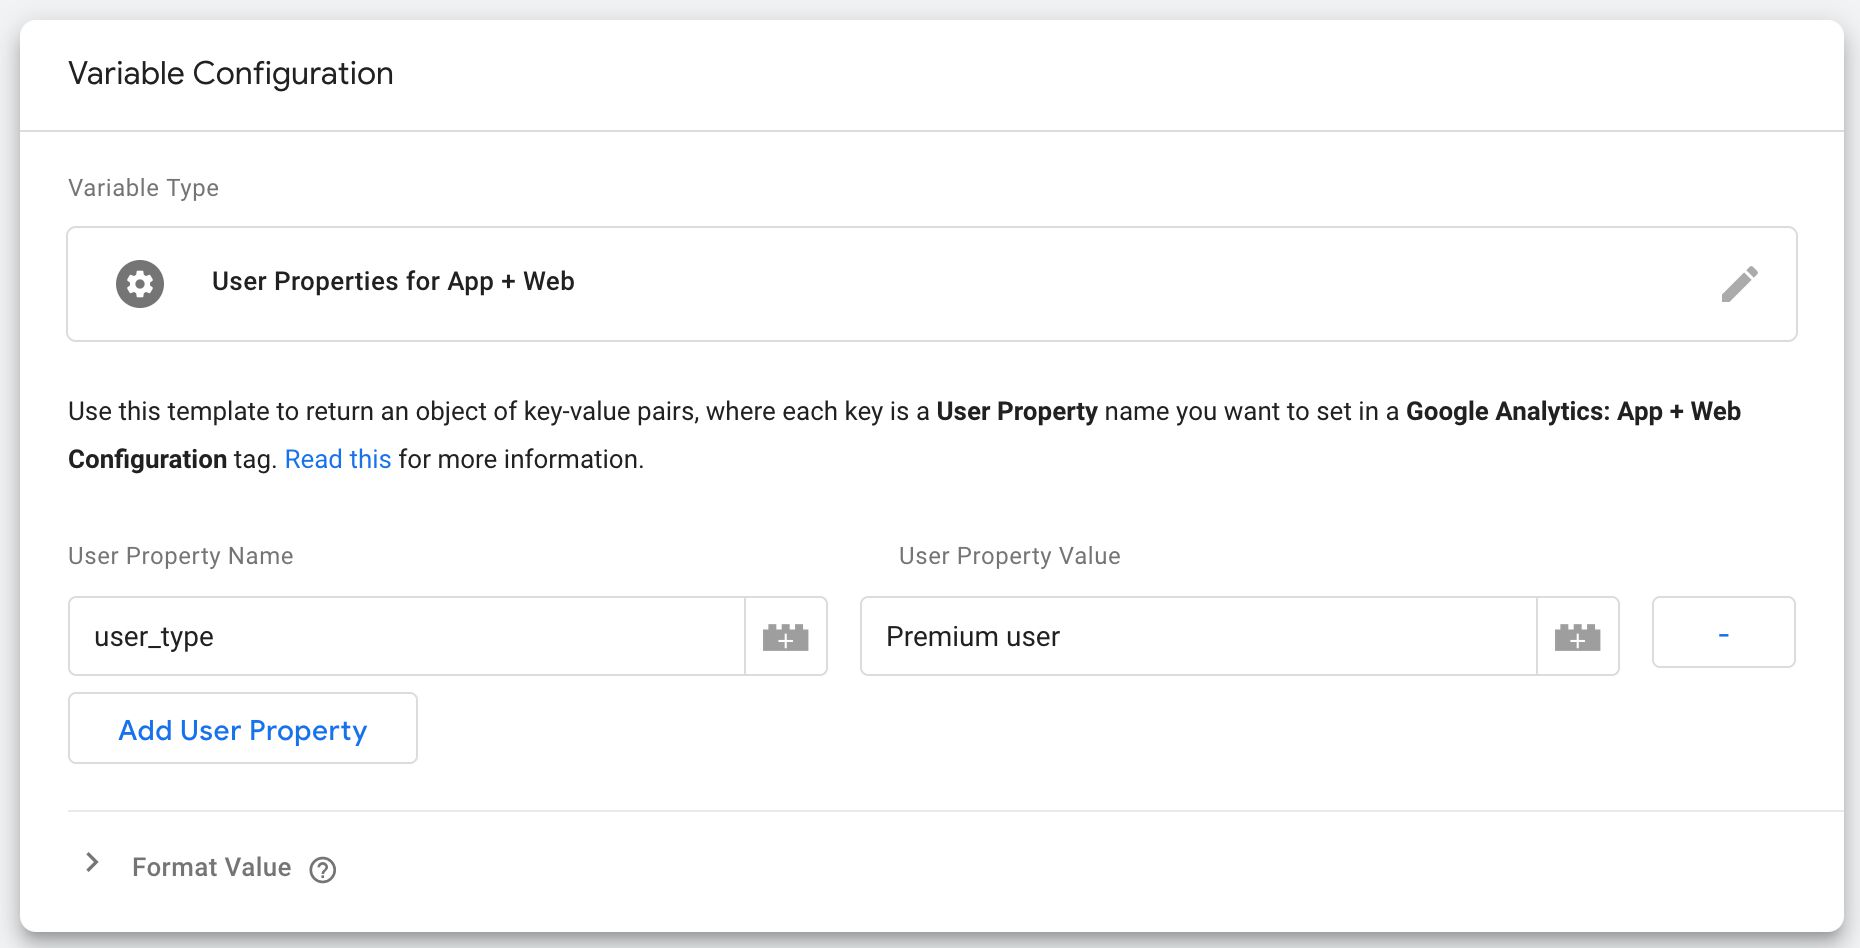
Set user properties
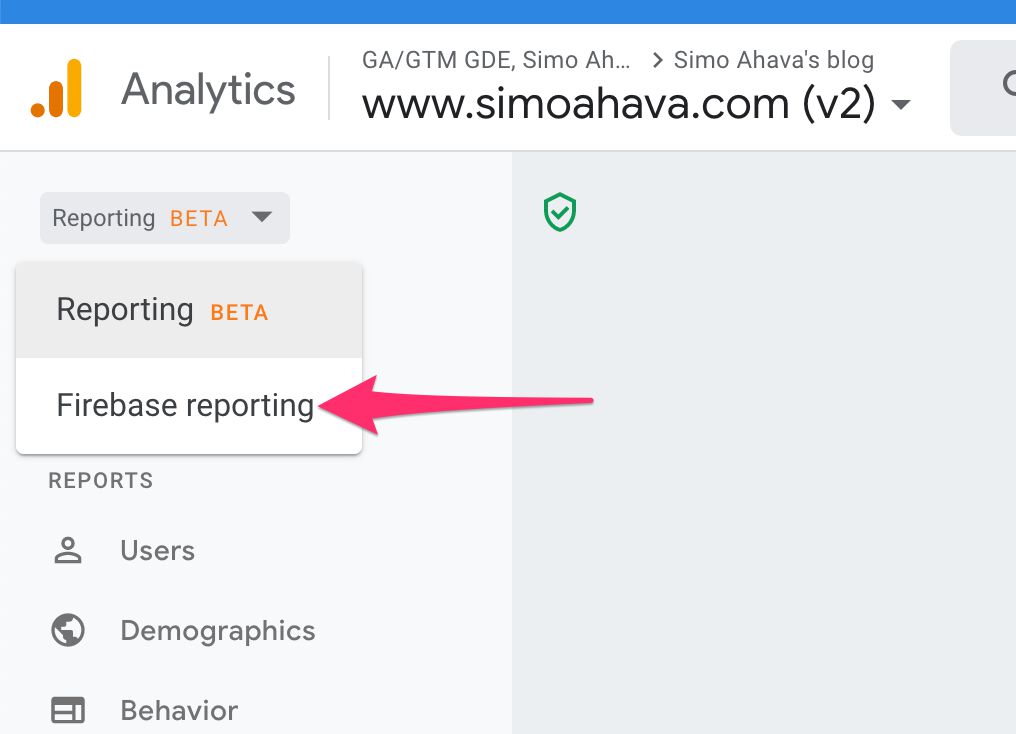
To set user properties, you first need to create them in the reporting UI.
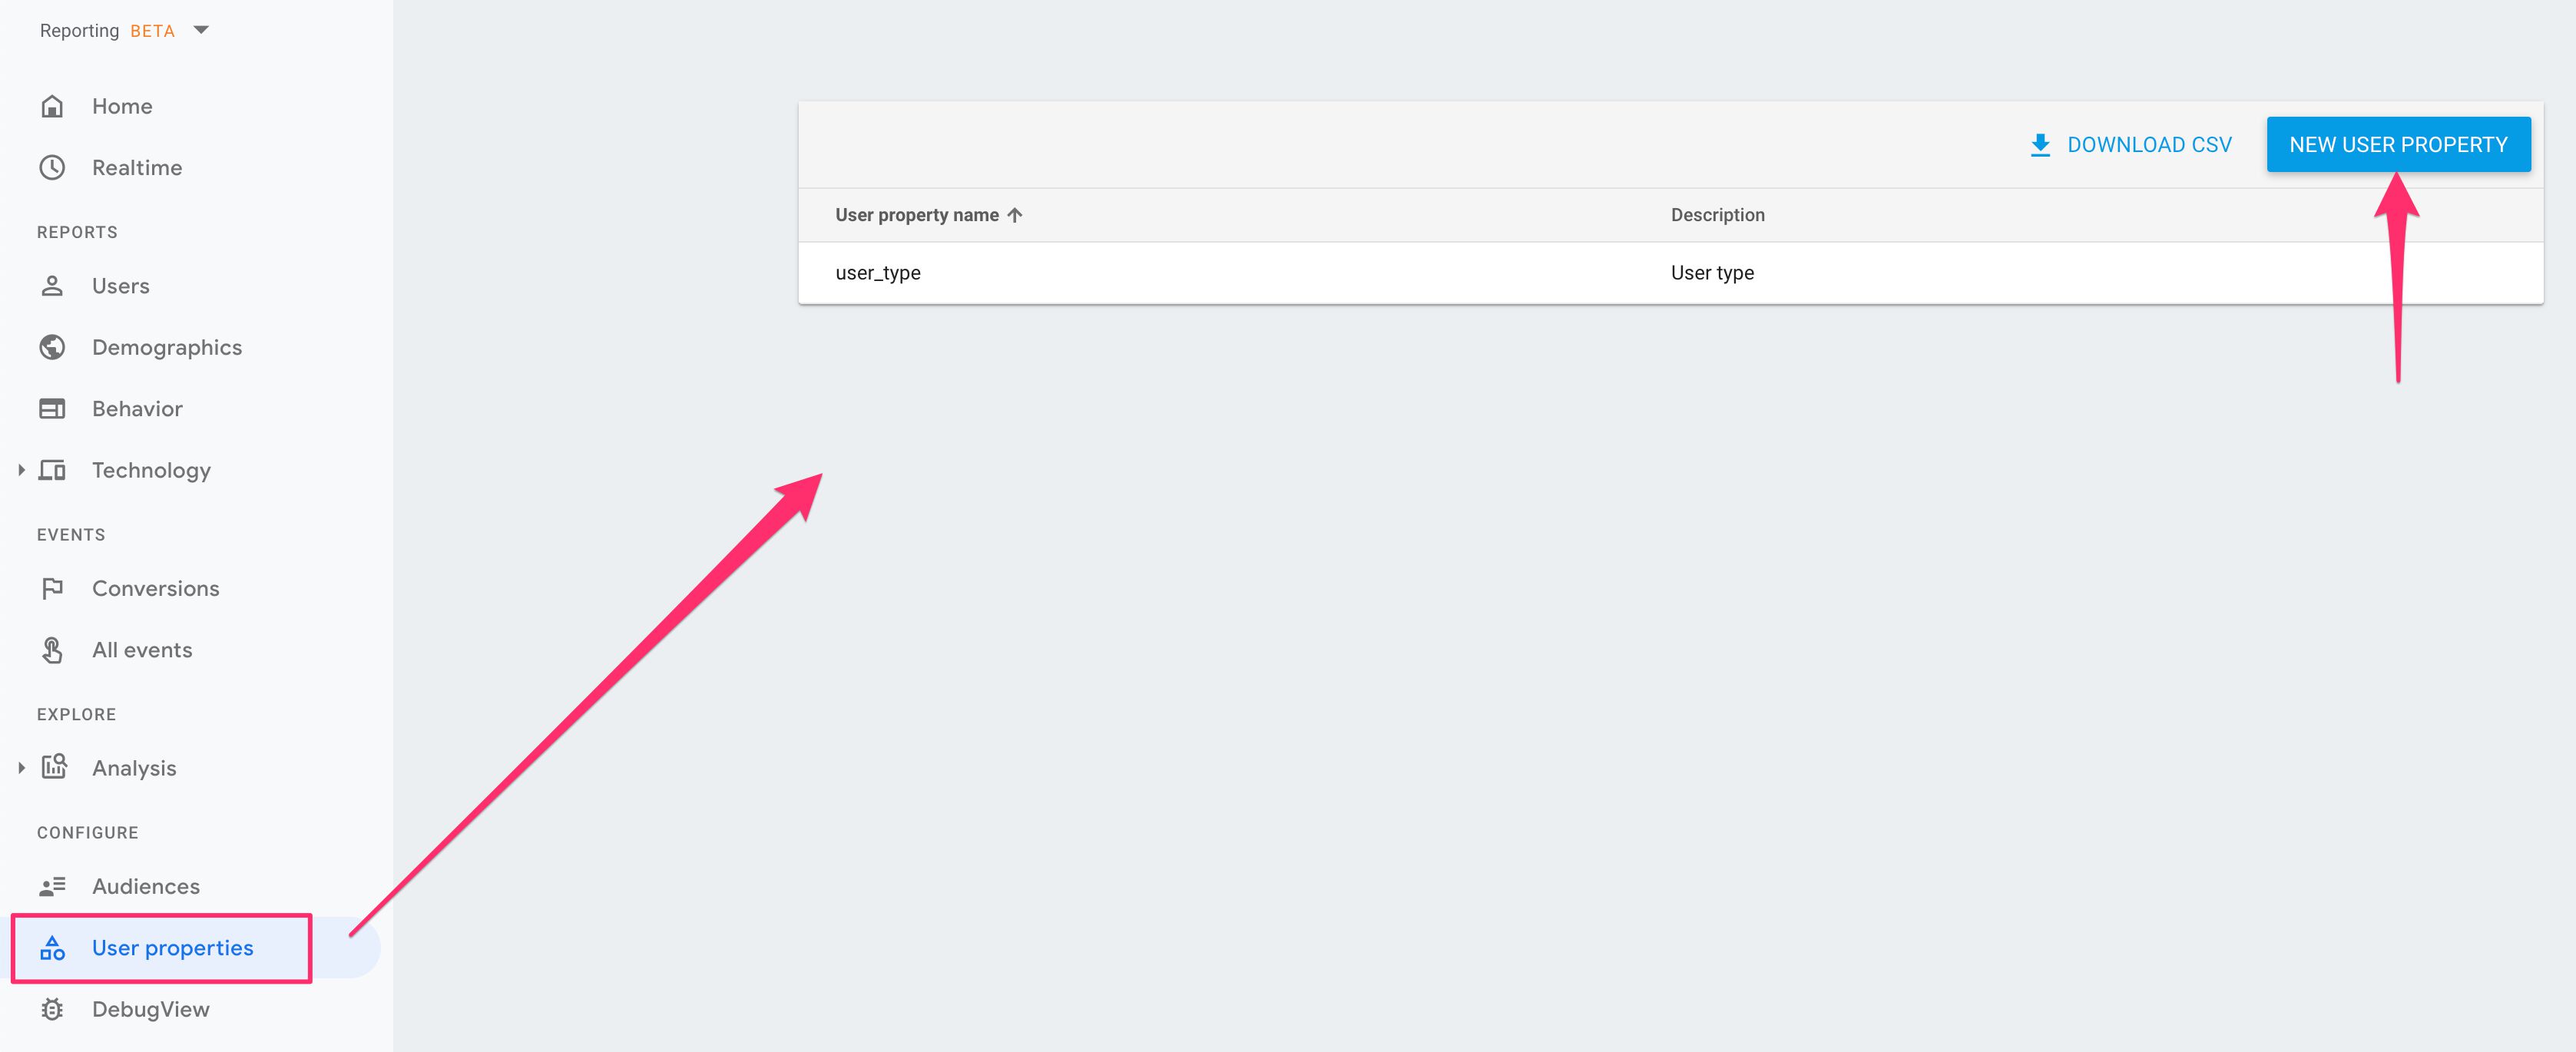
Next, in your configuration, go to Fields to Set, and add a new field. The name of the field needs to be user_properties.
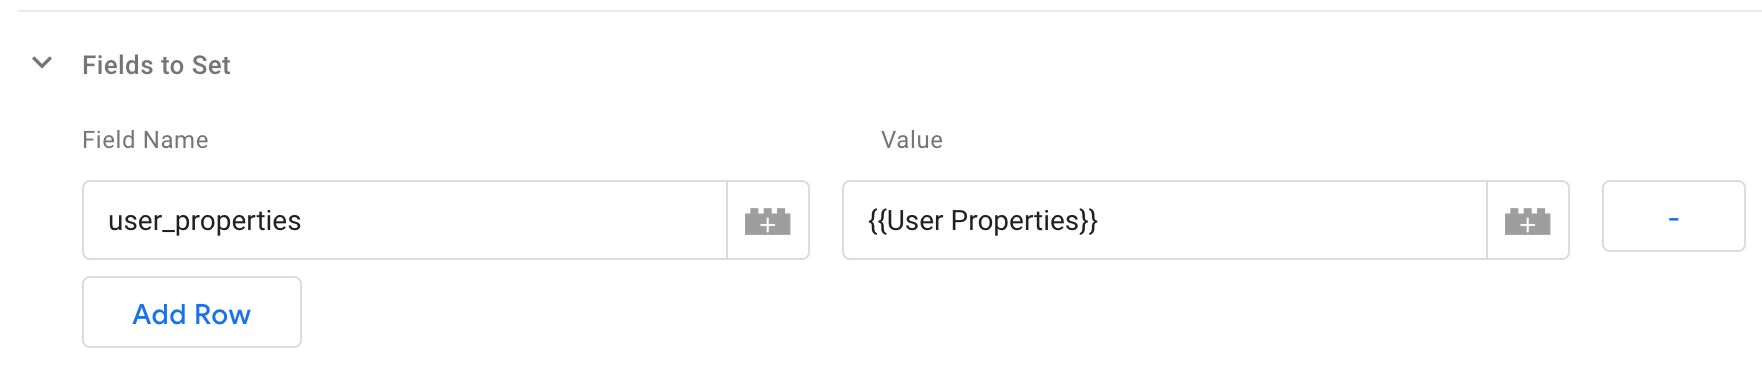
As the value of the field, you need to use a Custom JavaScript variable (or a custom variable template) that returns an object, where each key of the object corresponds to a User Property name you created in the reporting UI, and the value is what you want to send as the user property in question.
For example, to set the user_type property (see the screenshot above), I can create a Custom JavaScript variable that looks like this:
function() {
  return {
    user_type: 'Premium user'
  };
}
Then you need to add this variable as the value of the user_properties field in the configuration tag.
An alternate method is to use a custom variable template (see my guide if you are unsure what custom templates are). Here’s a template I created for returning a user properties object. You can use it to create a variable where you set the individual user property keys and values, and then set that variable as the value of the user_properties key in the configuration tag.
Once you’ve created a configuration tag, set it to fire on the All Pages trigger and enter preview mode. Let’s take a look at how this new measurement model works on the website!
Test it!
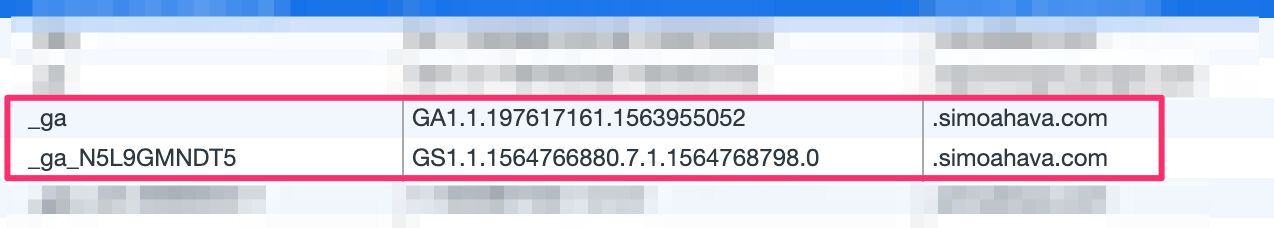
When you enter the site and load the preview container, open your browser’s developer tools, and take a look at the cookies used by GAv2.
The _ga cookie is almost the same as with Universal Analytics, with one minor difference. The _ga cookie encodes the number of domain parts in the cookie value as the number after GA1.. For example, if the cookie is written on simoahava.com, the domain comprises two parts, and the cookie value prefix would be GA1.2.. However, with GAv2, this does not seem to be the case when using the default cookie_domain value (automatic configuration).
I think this might be an oversight, as if you set the domain manually to e.g. www.simoahava.com, the cookie has the regular GA1.3. prefix.
The other cookie, _ga_MEASUREMENT-ID**, seems to maintain a session state. The first long number is a timestamp (in seconds) of when the cookie was created, and the second long number is a timestamp of when a hit was last sent to GA. In other words, it looks like GAv2 is at the very least keeping score of whether or not a session is currently active. It remains to be seen if it makes more use of client-side persistence for session information, and whether this cookie could be used to infer session state in the web browser.
The cookies are set with JavaScript, so they are impacted by measures to reduce the effectiveness of client-side cookies, such as Safari’s Intelligent Tracking Prevention.
Next, spy on the Network requests sent by the browser, or use the Google Analytics debugger extension to see how the library sends hits to Google Analytics.
First of all, you can see that the request is sent to a familiar endpoint, /collect, with the exception that it’s located in the /g/ path instead.
The request type is POST, and the endpoint is still an image pixel. In other words, it looks like the hit defaults to using the Beacon API, which is an excellent improvement to Universal Analytics, where you had to manually enable this feature.
The Beacon API protects asynchronous requests that are sent when the page is unloaded, allowing them to complete even if the browser is closed. This lets you avoid the nuisance of missing out on hits (such as link click events) because the user had navigated away from the page before the request had completed.
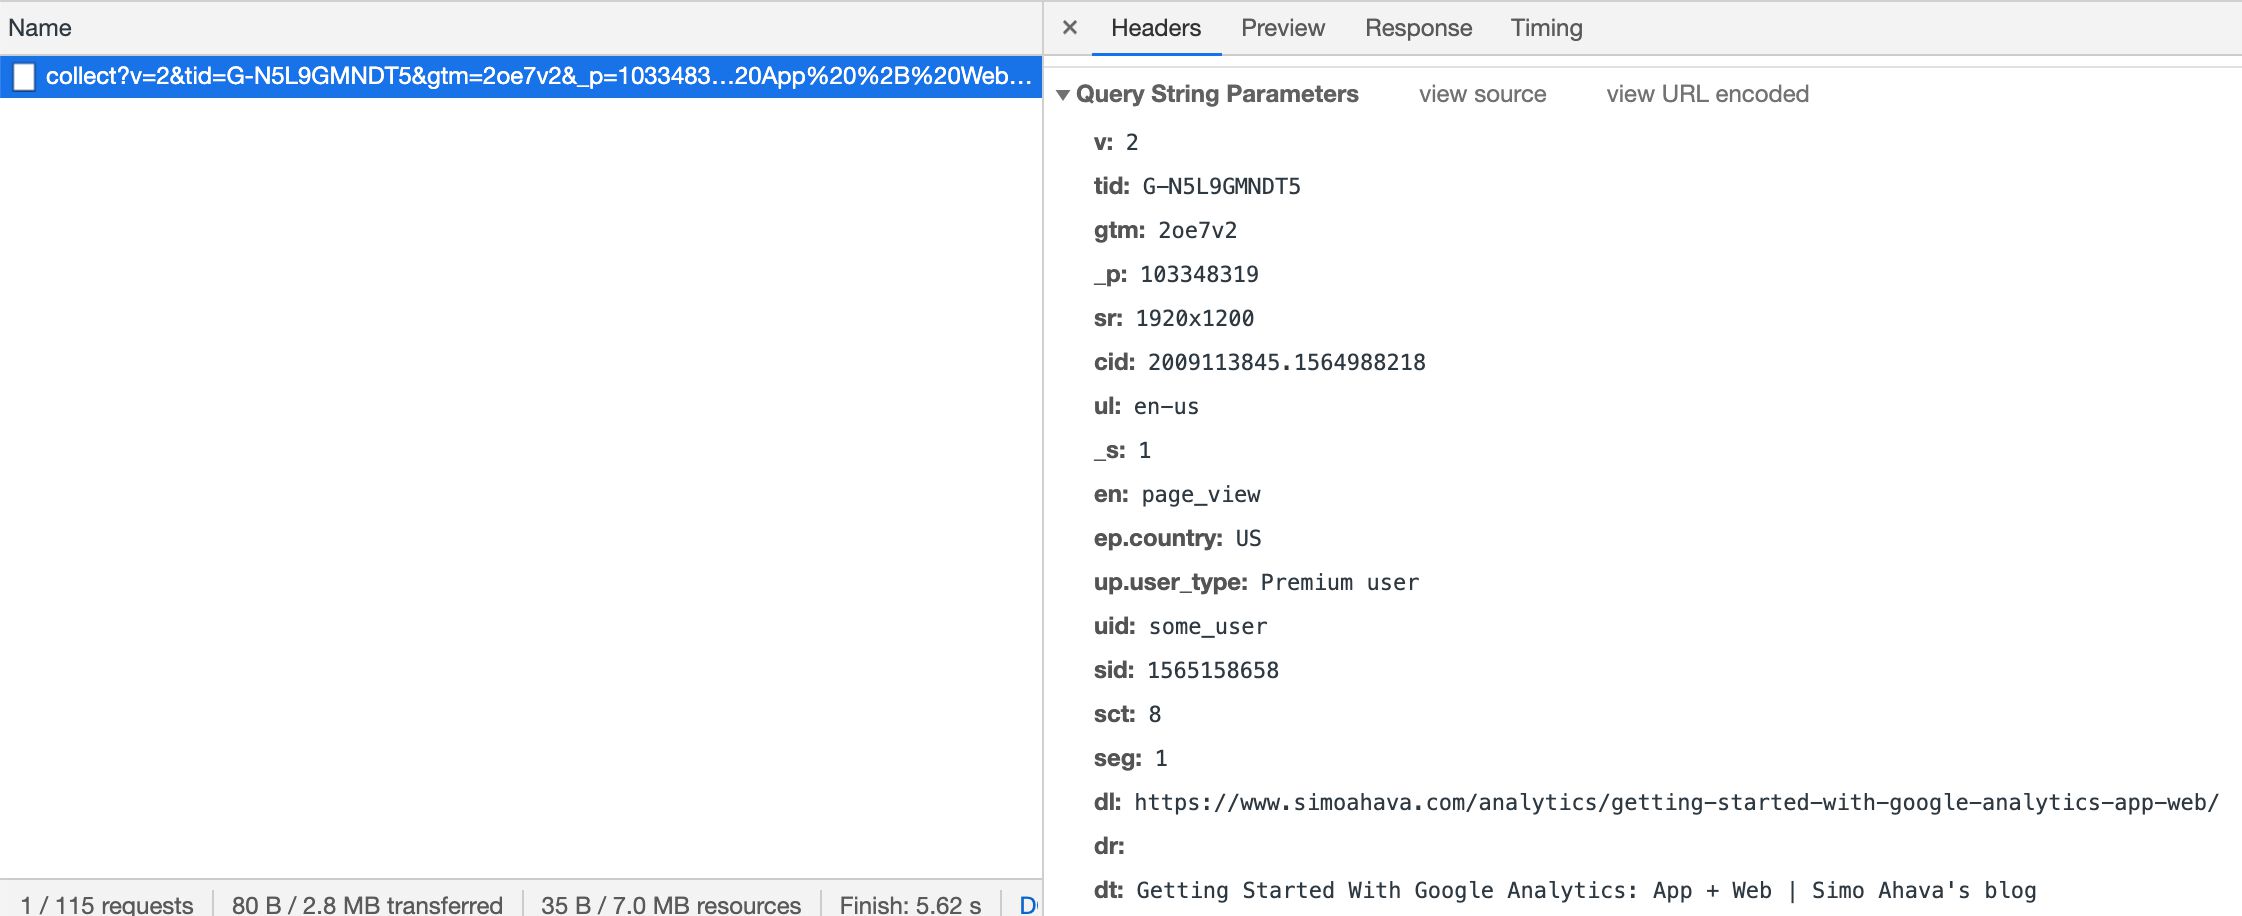
Taking a look at the actual parameters sent to GA, there’s a lot of familiar stuff here if you remember how Measurement Protocol requests are built.
The v parameter is set to
2, whereas with Universal Analytics it was1. This is the version of the protocol.The tid parameter is set to your Measurement ID.
The gtm parameter is hashed from your GTM container ID.
The cid parameter is the Client ID, stored in the _ga cookie.
Other parameters that have stayed practically the same include things like uid (user ID), dl / dr / dt (document metadata), and sr (screen resolution).
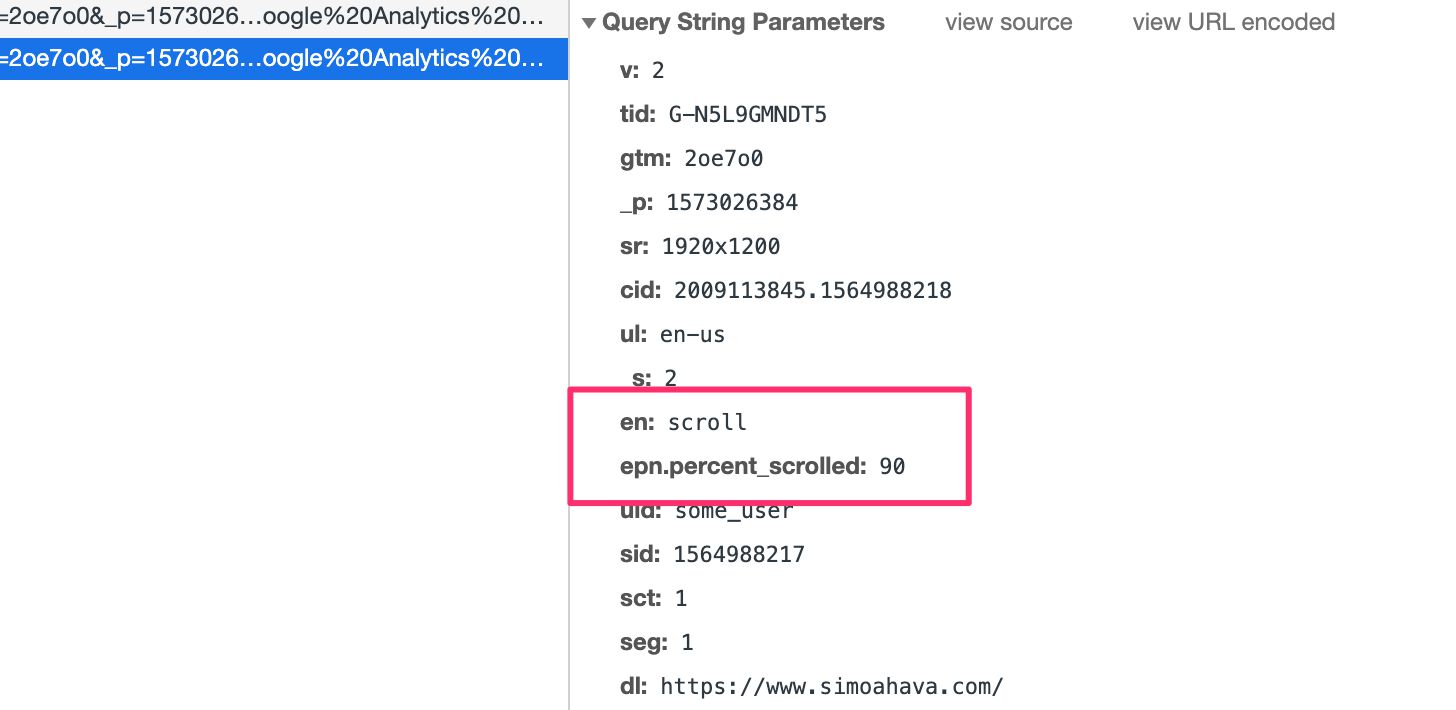
There is no longer a “Hit Type” dimension, but rather the en parameter (event name) is used to distinguish different types of hits from each other. This is a major difference to Universal Analytics, as in GAv2 you have one single event stream, where the event parameters you send with the event name determine how the data shows up in the reports.
Event parameters are prefixed with ep. or epn. for text parameters and number parameters, respectively. In the screenshot, I’ve created an event parameter named country and set its value to US.
User Properties are prefixed with up. or upn. for user properties in text or number format, respectively. The screenshot shows a single text user property named user_type set to value Premium user.
Finally, the sid parameter seems to contain the timestamp when the current session started (taken from the _ga_MEASUREMENT-ID cookie).
It’s still somewhat unclear what the other parameters do.
One thing you might have noticed is the delay it takes for the hit to be sent. When you load the page, you can see how the browser waits a few seconds before dispatching the hit to GA. This is because GAv2 batches requests automatically, which, again, is a great feature upgrade.
By batching multiple hits into a single request, browser resources are saved for other things. The delay is due to the browser waiting to see if other hits should be dispatched together with the Page View.
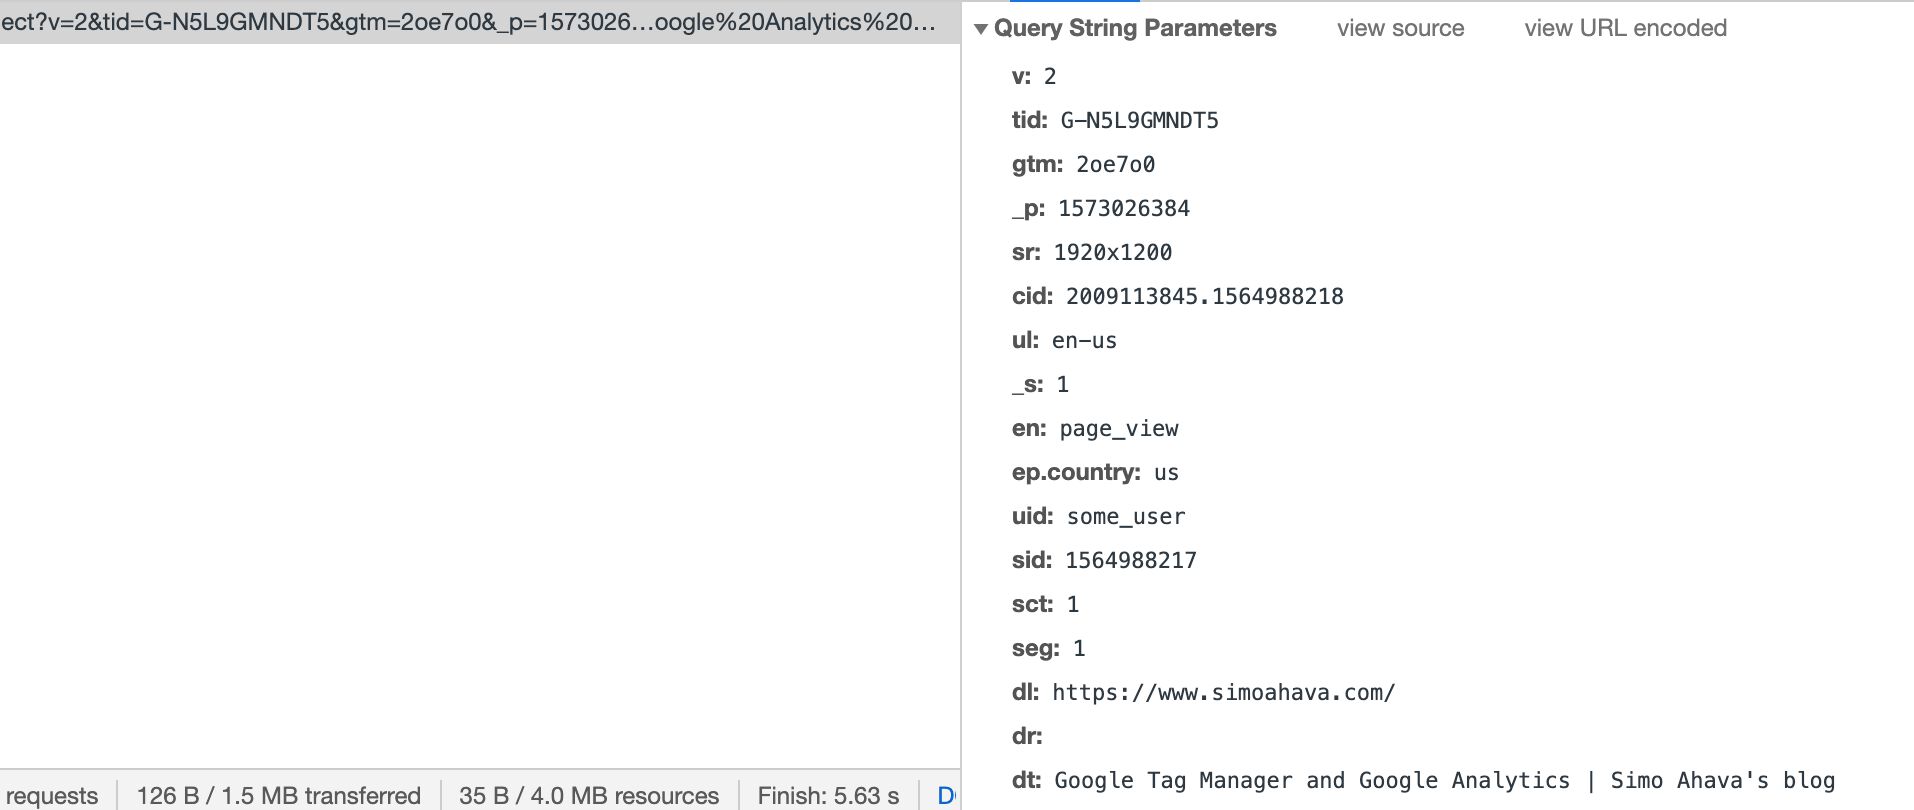
Before creating your first event tag, take a look at how the Enhanced Measurement stuff works. First, scroll down to the bottom of the current page and take a look at the event sent to Google Analytics.
Then, click a link that leads away from your site (use CTRL/CMD + Click to open it in a new tab). Take a look at the parameters.
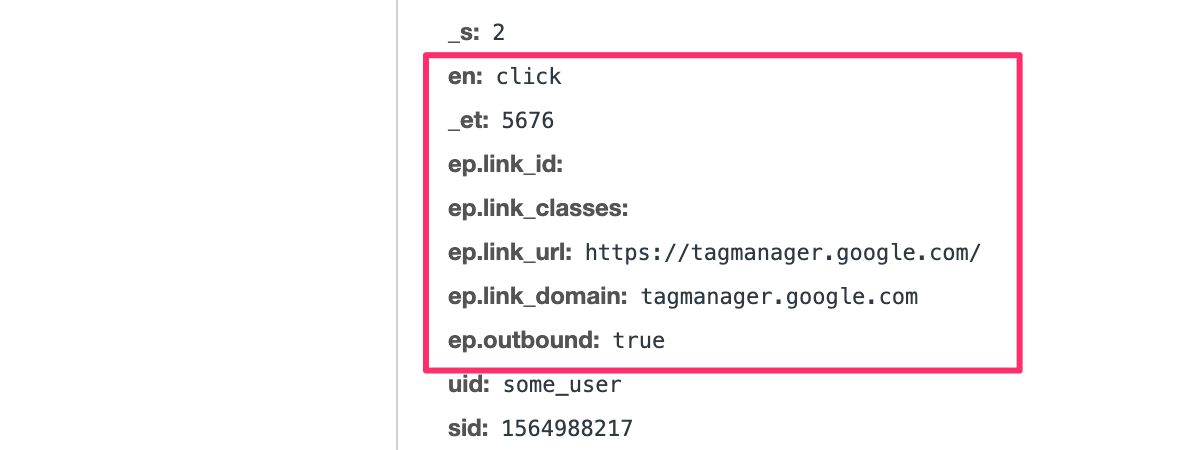
Finally, if you have a YouTube embed on your site which has the enablejsapi=1 parameter set, check out automatic video tracking!
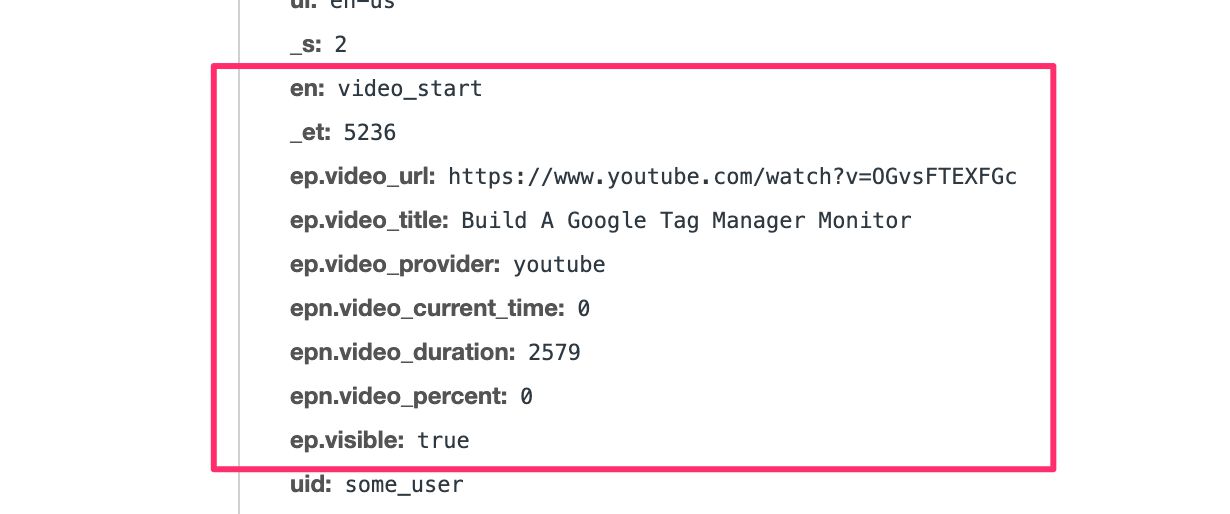
This stuff is ridiculously cool, but I do hope we get some controls to customize how Enhanced Measurement works.
Next, let’s create our own event tag!
Create an event tag
The thing about events in the new Google Analytics: App + Web property is that they function similarly to how gtag.js and Firebase use events. In other words, there’s a combination of automatically collected events, recommended events, and custom events.
When creating new events, first make sure that the event is not already collected automatically.
Next, check if there’s a recommended event structure you could use instead of a custom event. If you find a corresponding recommended event, make sure you use the suggested event name and parameters when configuring the event tag.
Finally, if you want, you can still send a completely customized event name with totally arbitrary event parameters. Just note that you’ll lose some flexibility in the reporting UI if doing so, as there are some strict limitations to how many custom properties you can define for reporting in the UI.
Let’s start with a simple custom event.
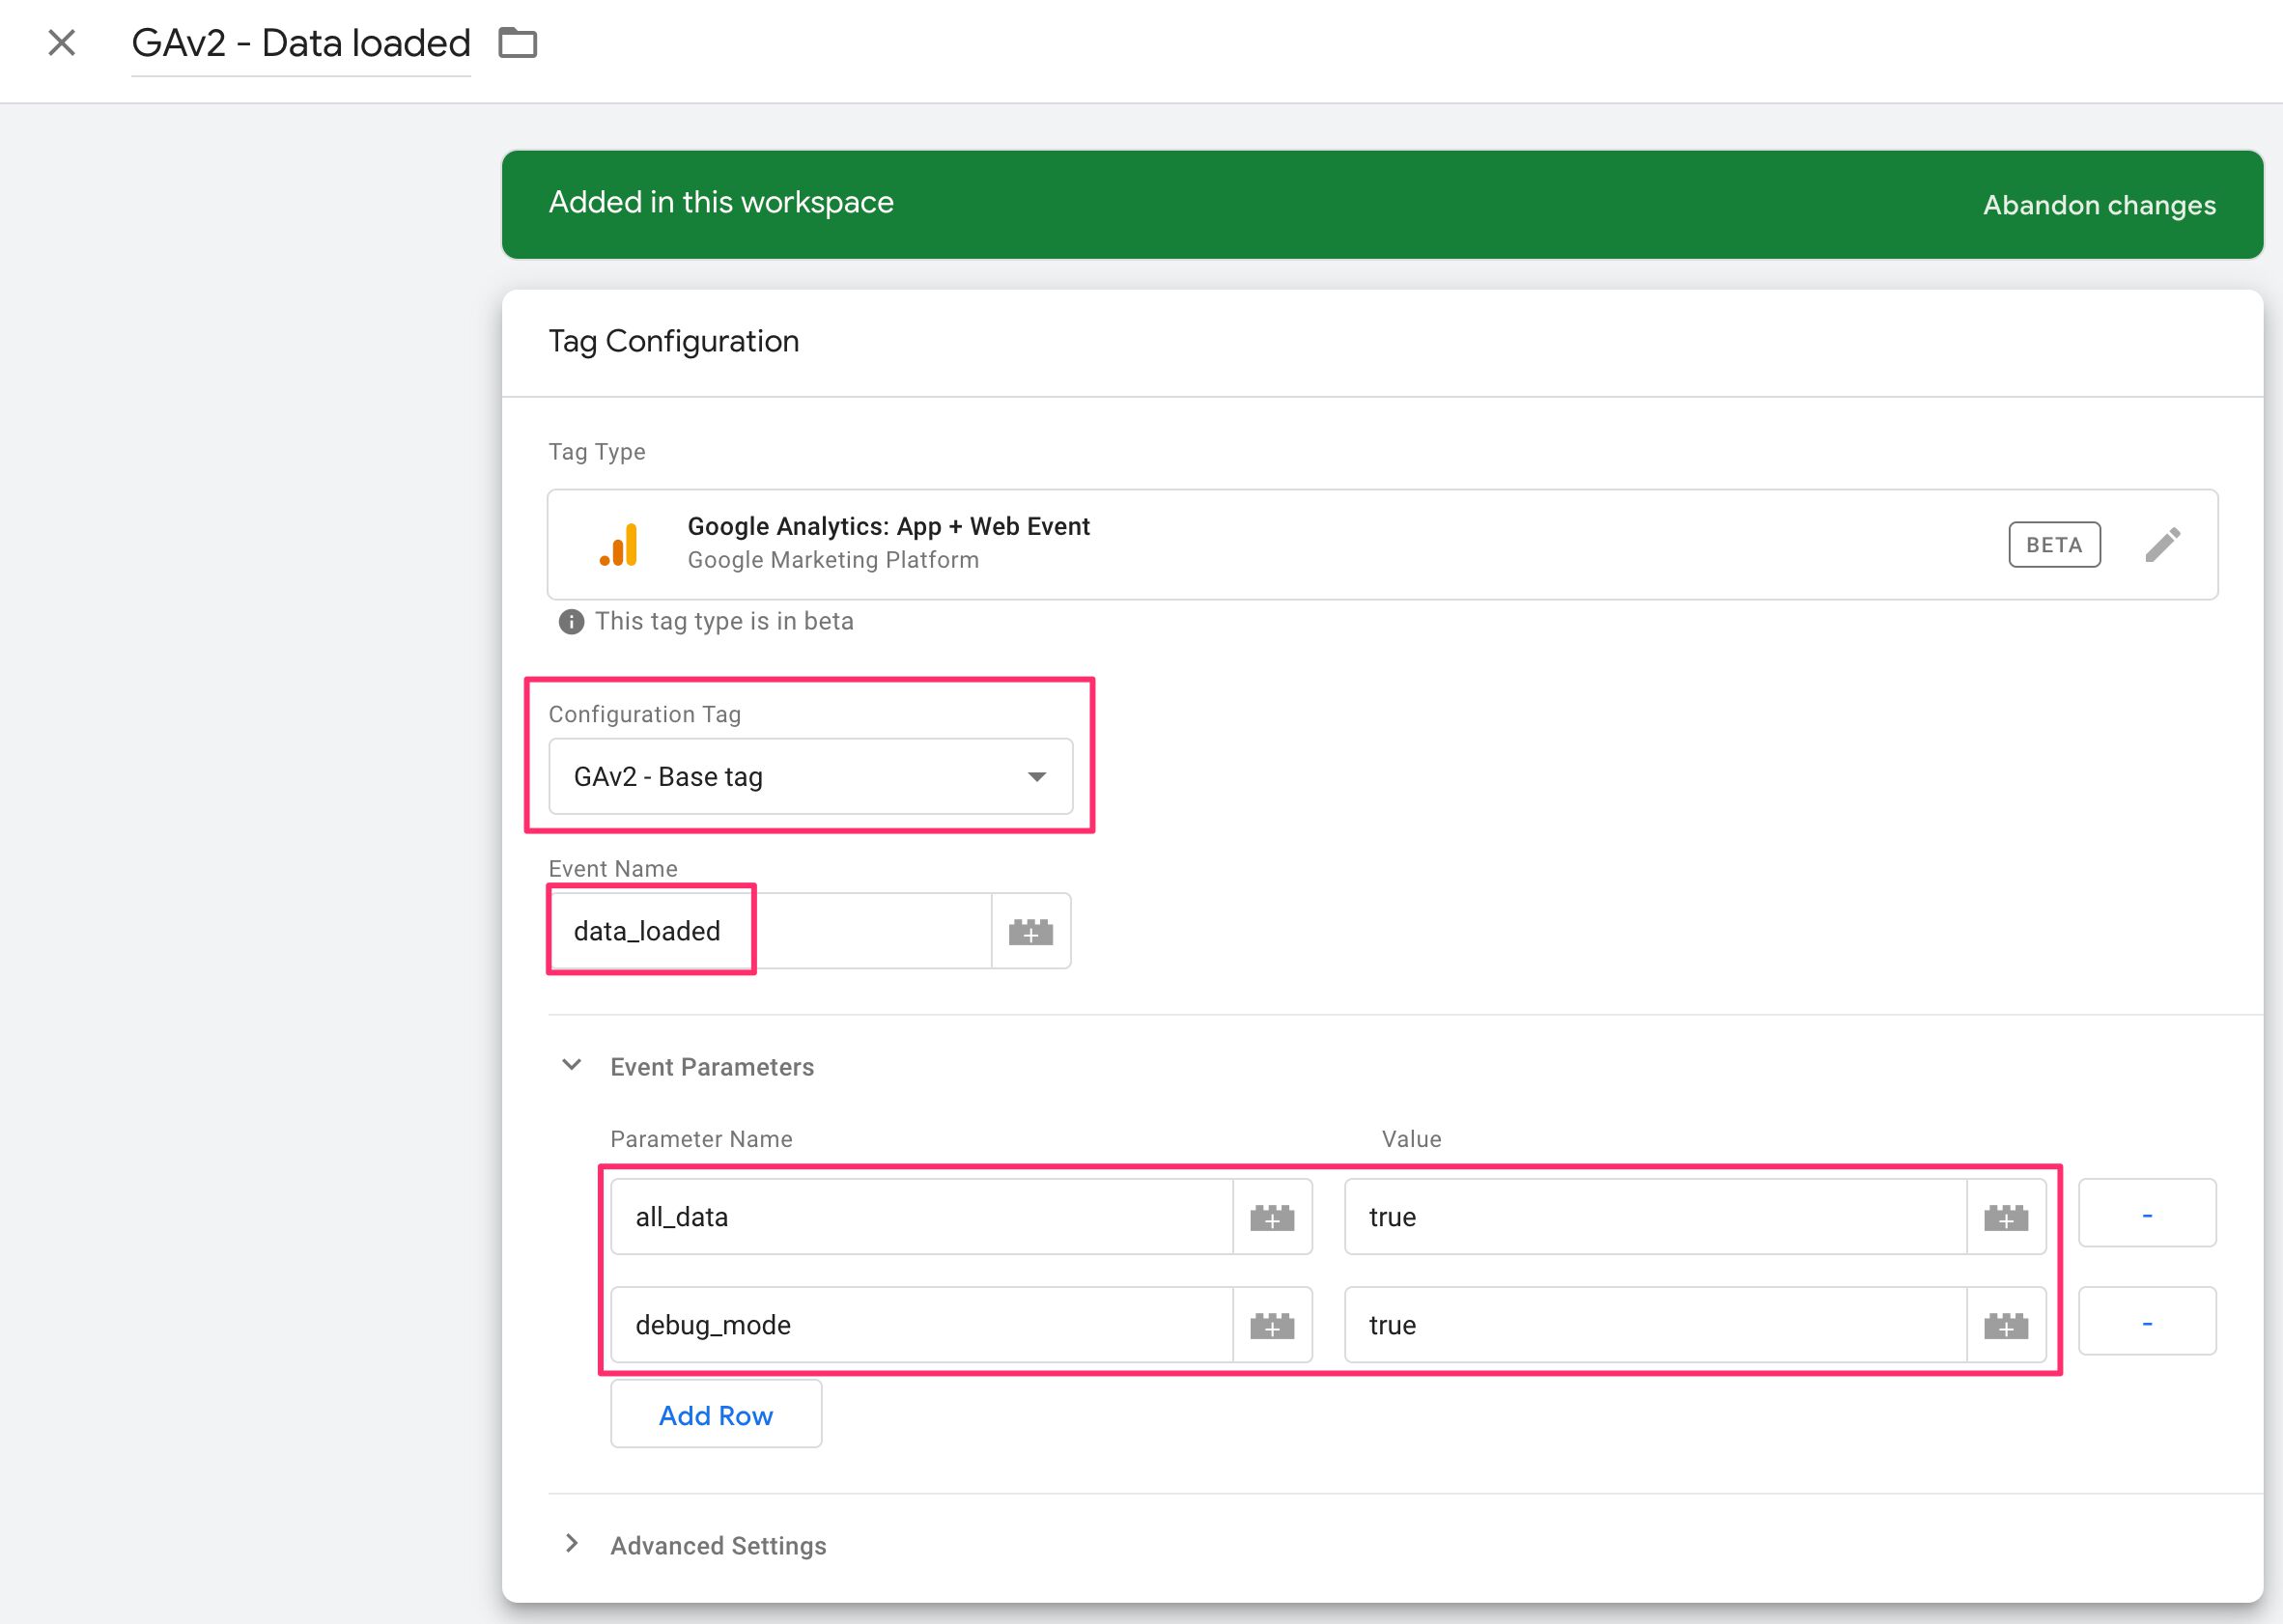
Create a new Google Analytics: App + Web Event tag, and populate it like this:
Set the Configuration Tag setting to the tag you created in the previous chapter. This works similarly to the Google Analytics Settings variable in that you only need to configure the tracker settings once, after which they’ll apply to all tags that use the configuration tag.
Give the event a custom name (i.e. not one of the automatically collected or recommended events). In this case, we’re using data_loaded as the event name.
Then, add some parameters.
all_datais a custom text parameter set to the valuetrue.debug_modeis a parameter which, when set in the tag, makes the hit appear in the DebugView stream of the reporting UI (more on this below).
Set the tag to fire on a Window Loaded trigger, refresh Preview mode, and load the container on the website. Take a look at the network requests to /collect.
Once the page has loaded, you should see a single request with two hits bundled into one (batching).
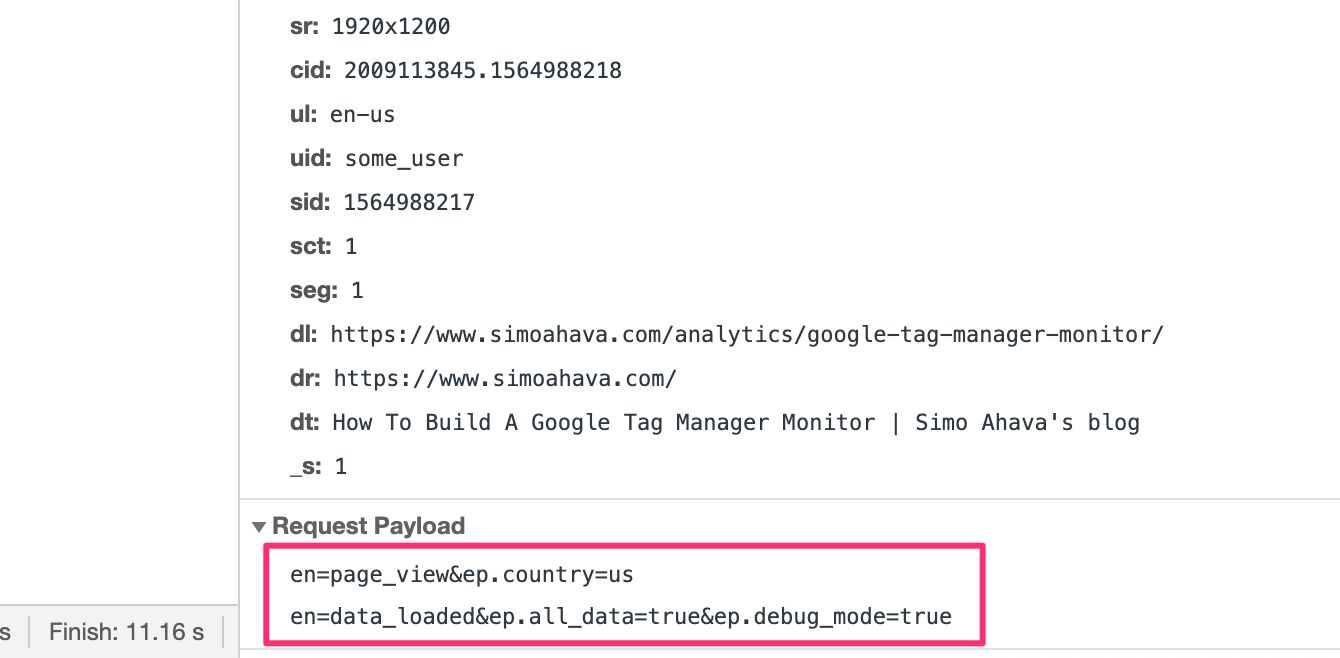
As you can see, there’s the page_view hit on the first row, and then your custom data_loaded event on the second row.
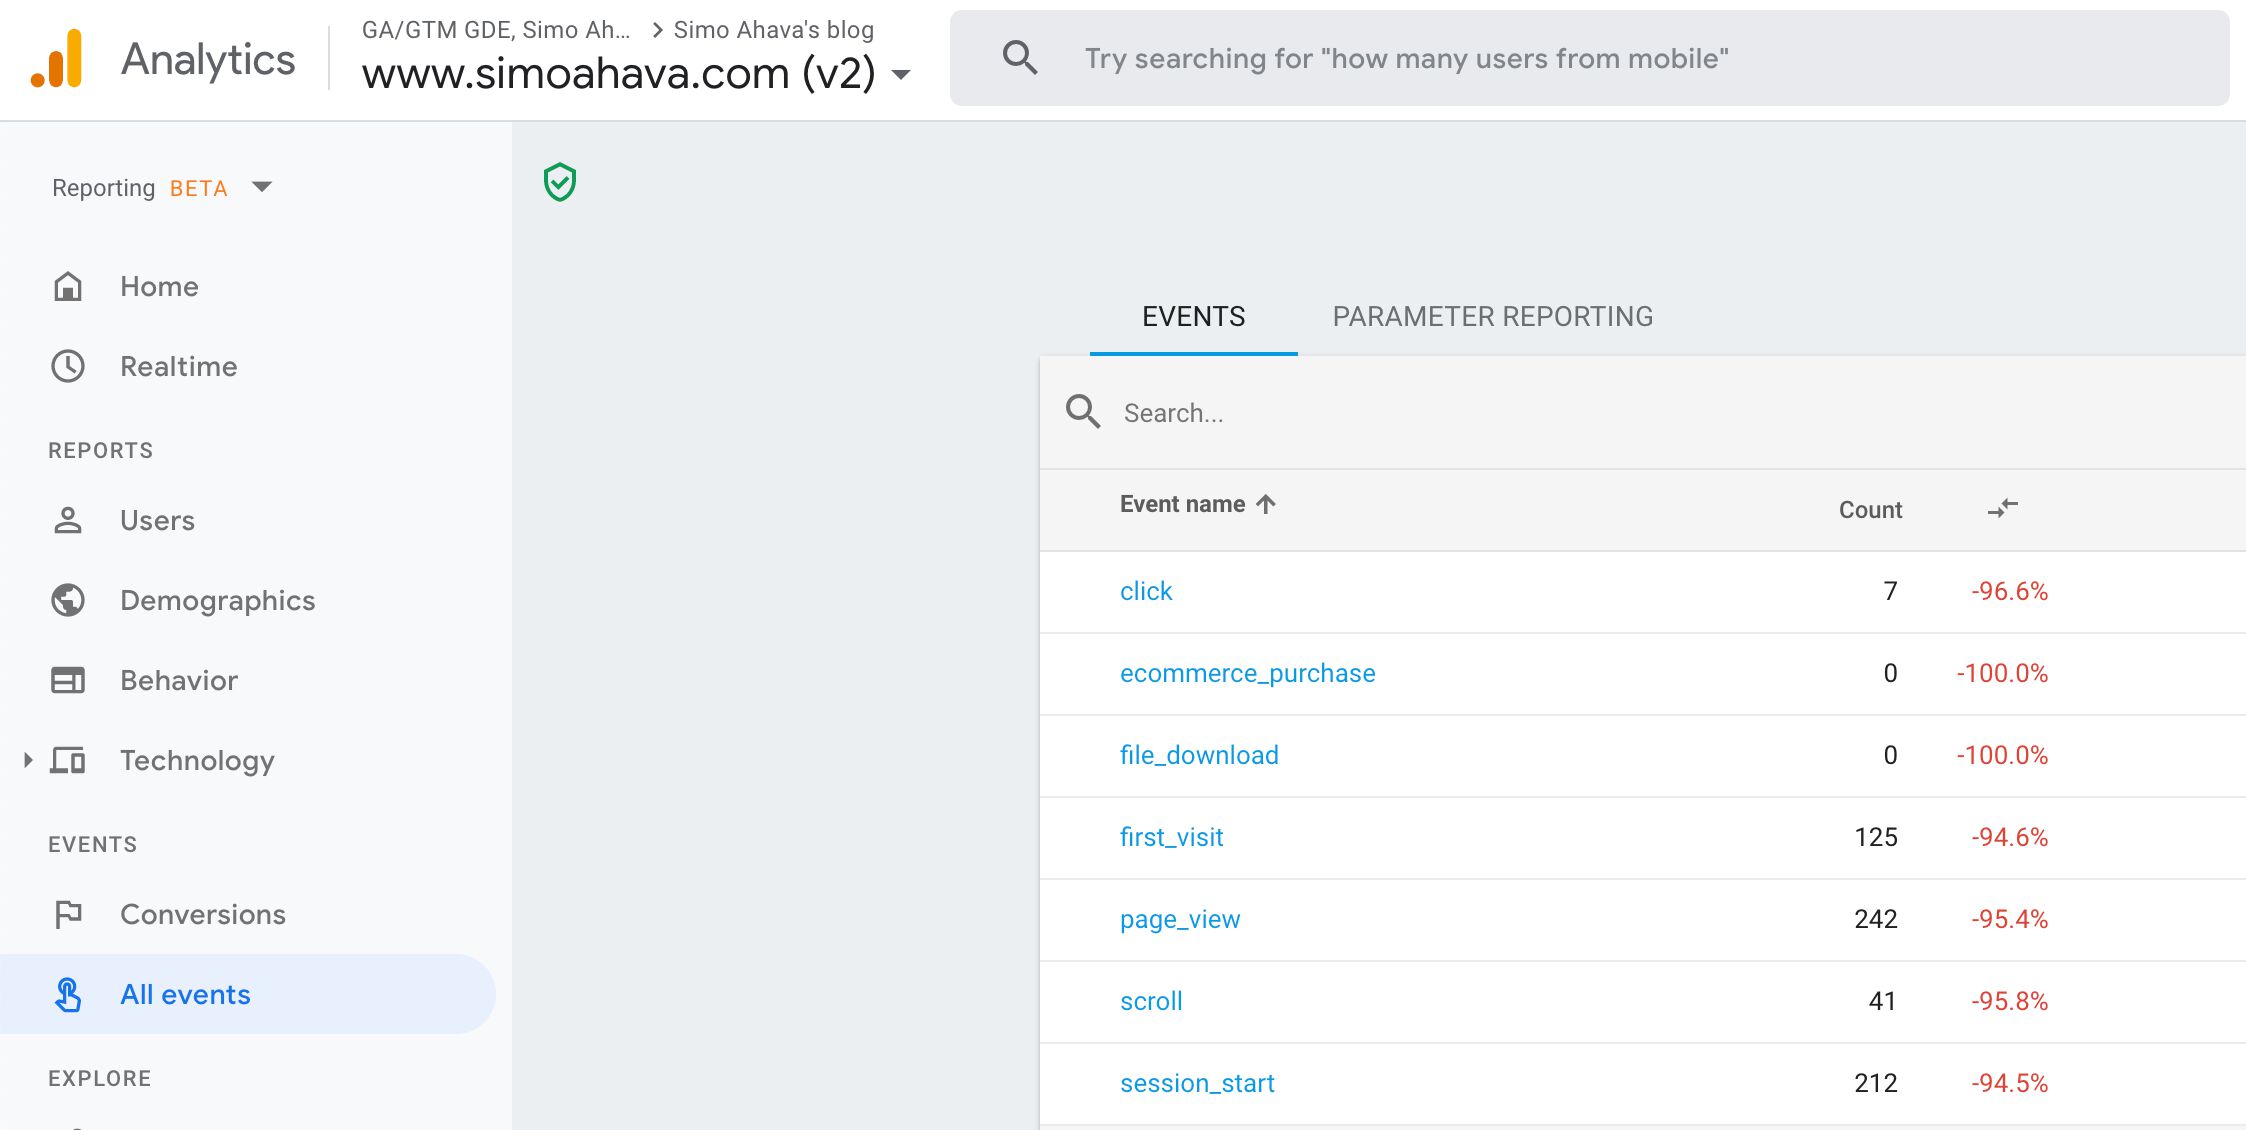
Now, jump into the Google Analytics reporting UI, and open DebugView from the report navigator.
Don’t forget to read Krista’s excellent article on the stream reports to understand how to interpret the following data. You can also check out Firebase’s own DebugView documentation for more information.
From the Debug Device selector in the top of the screen, you should be able to see how many devices (e.g. browser instances) are currently sending debug hits to GA. From the selector, go through the devices listed until you find one that has recently sent the data_loaded event.
This Debug Device selector is really unusable at the moment - hopefully it’ll be easier to find the debug devices in the near future.
Once you find the data_loaded event, you might see other hits included in the debug view, too. This is because if the batch contained other hits than the data_loaded hit, they will automatically be enumerated in the DebugView as well.
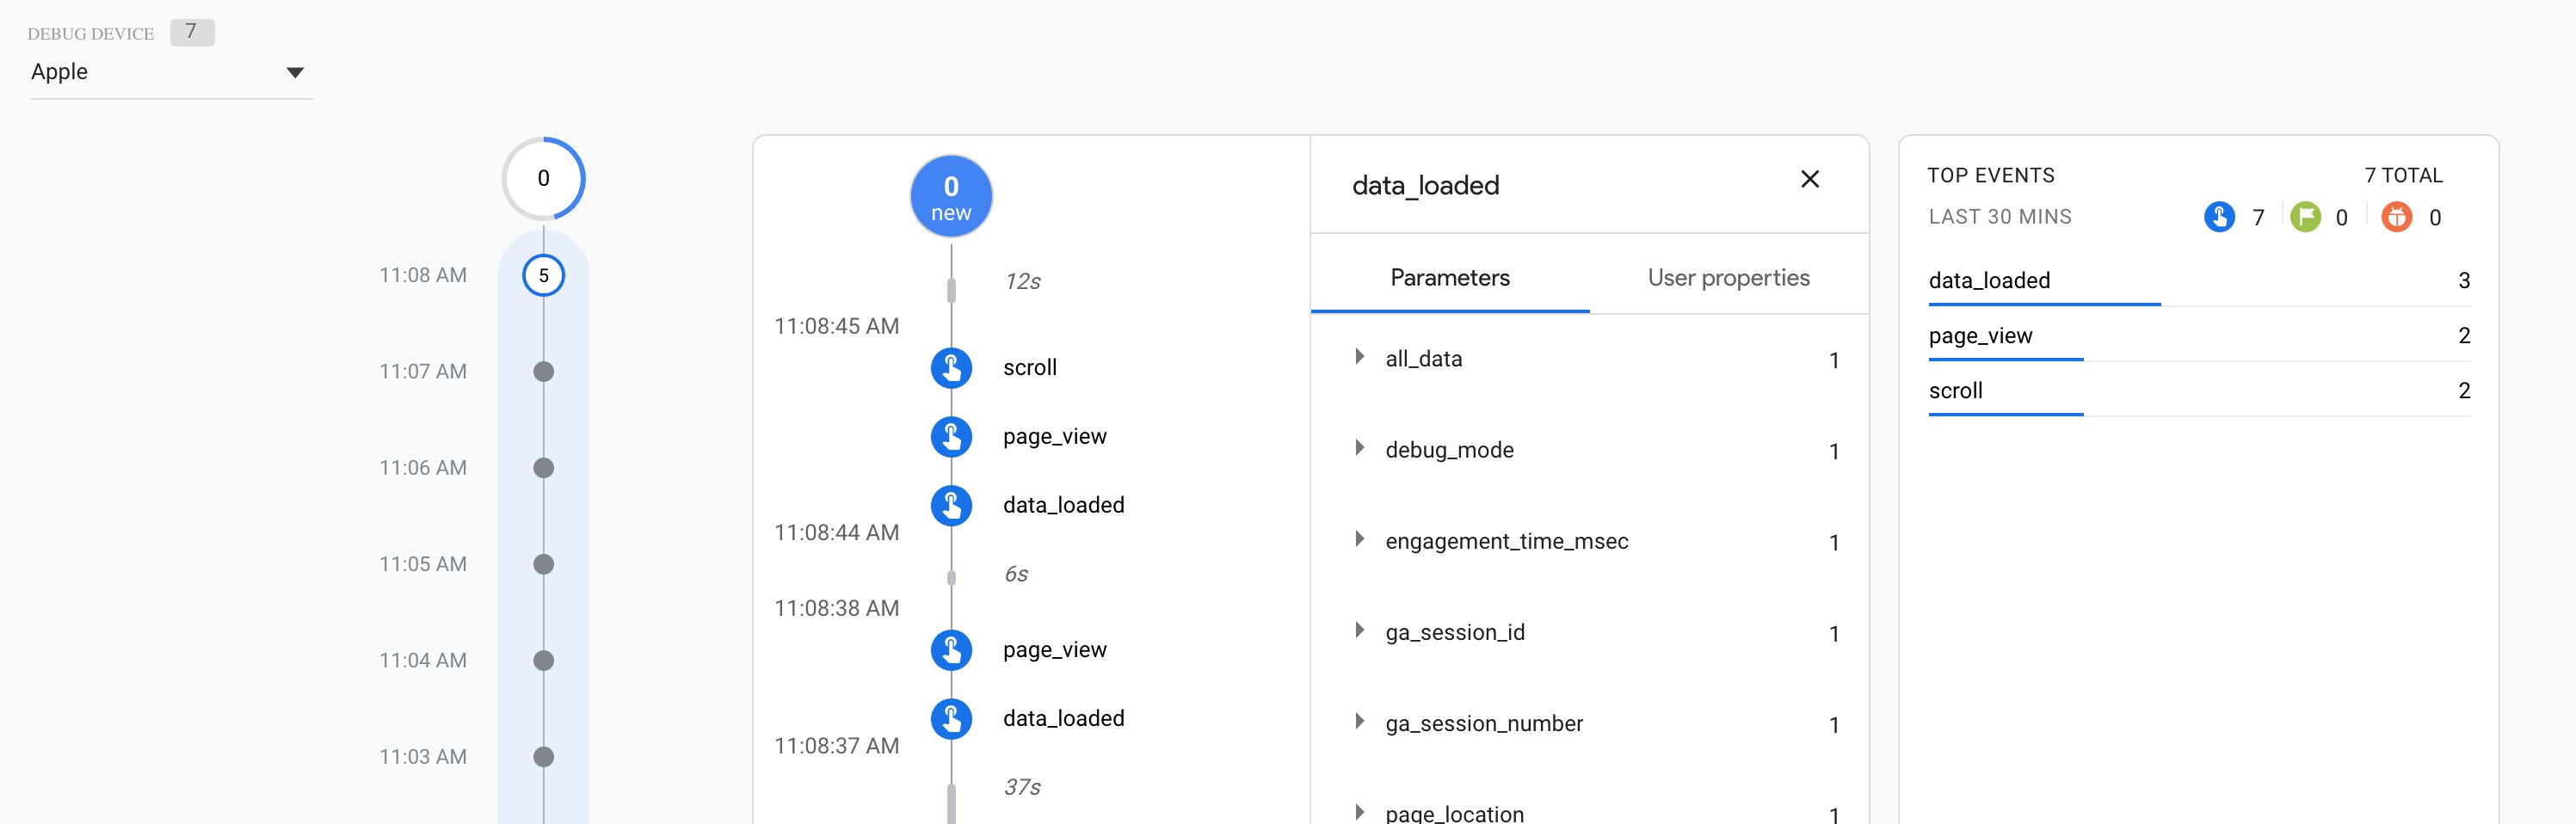
You can click through the parameters in the data_loaded event to see what type of information is dispatched to Google Analytics with the hit.
Before finishing here, let’s try sending a recommended event, too. We’ll send a search event to simulate a site search.
If you check out the instructions in the recommended events list, you can see that the search event name is search, and it takes a single parameter: search_term. So, let’s create a new event tag and populate these values! This is what the tag would look like:
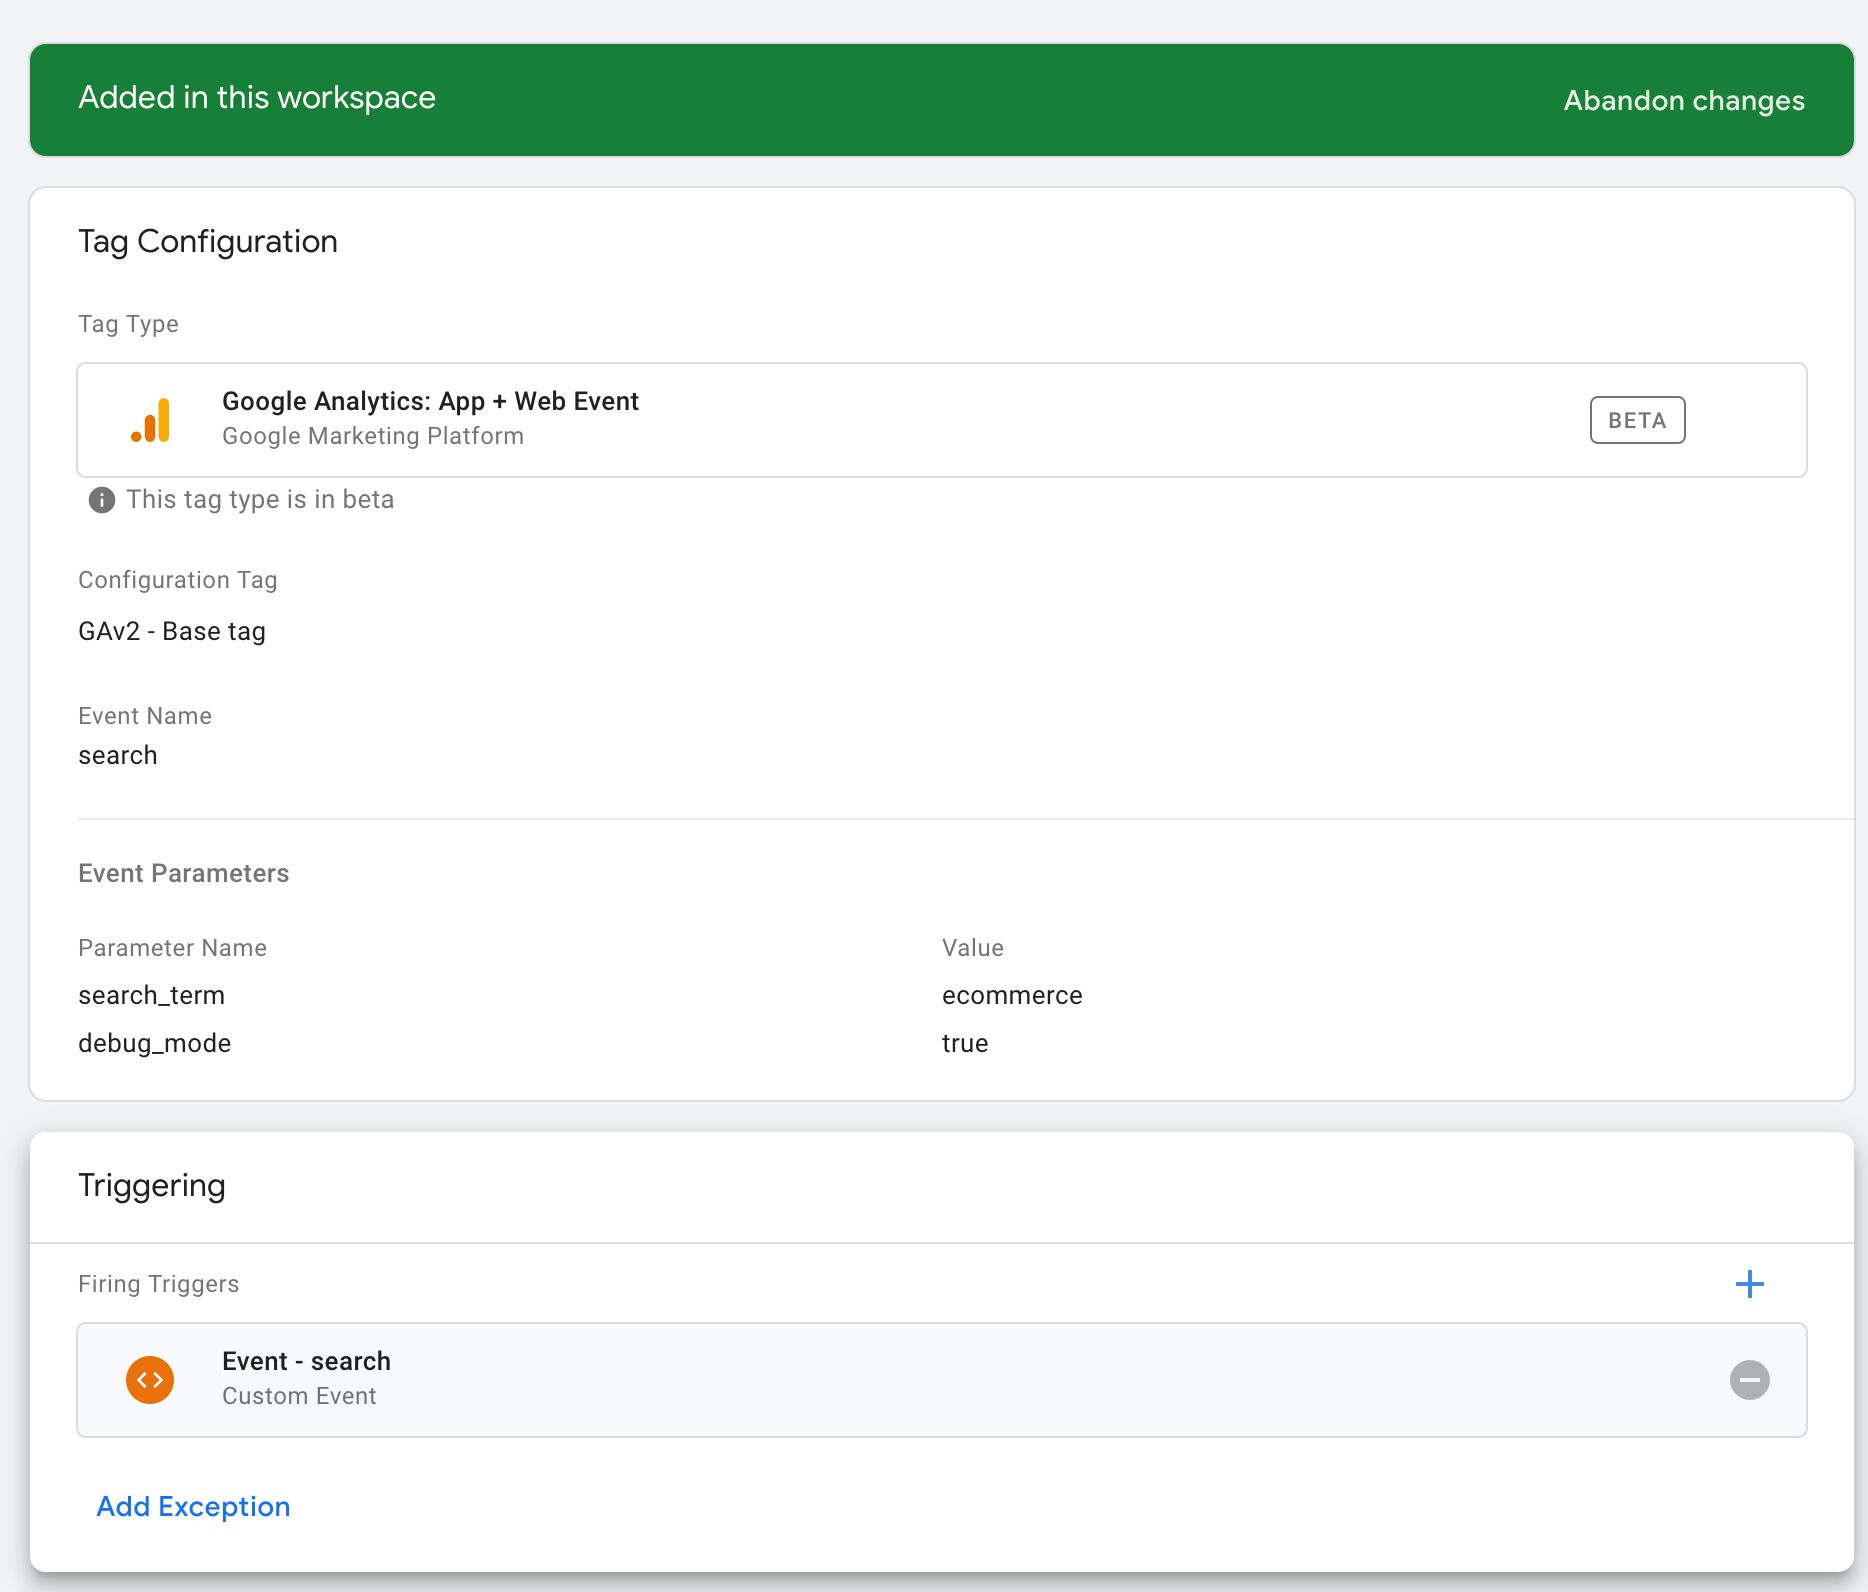
As you can see, I’ve just hard-coded the search term into the event parameters. I’m firing the tag with a Custom Event trigger set to the event name search.
After refreshing preview mode and reloading my website, I can fire the event with a simple window.dataLayer.push({event: 'search'}) executed in the JavaScript console of the page.
In DebugView, I can see that the event was registered:
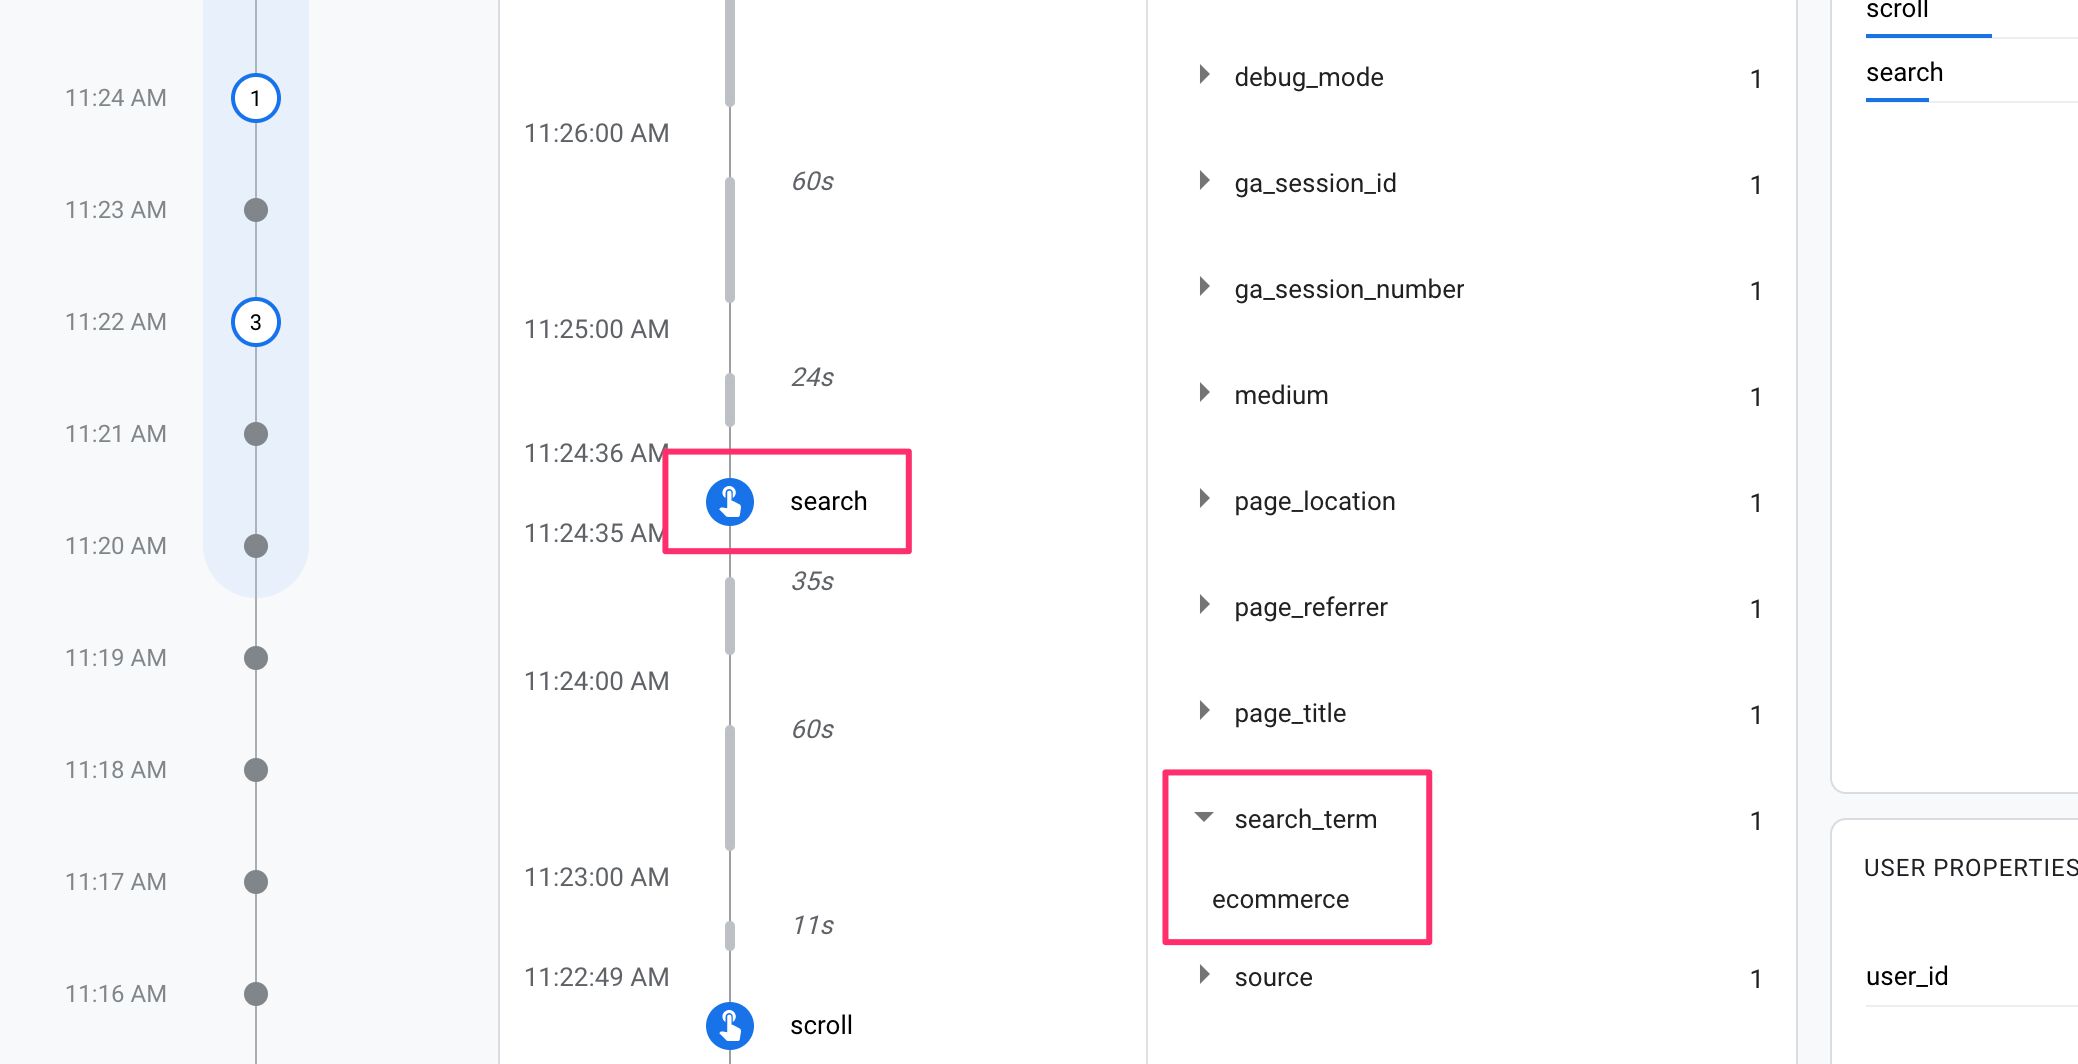
And… that’s about it. There’s nothing else that distinguishes this event from custom events. There’s no report yet that would collate site search data in a similar fashion to Universal Analytics. At some point I’m certain search events will be recorded in their own report, where search data is combined with the automatically collected view_search_results event (a Page View recorded with query parameters corresponding to a site search).
Summary
With this article, my purpose was to show you how to set up the new Google Analytics: App + Web property when using Google Tag Manager as the implementation tool of choice.
I hope I’ve made it very clear that the feature is still in beta, and is thus purposefully incomplete. New features will be rolled out over time, until some day in the future when we break out of beta with a fully functional platform.
Whether this platform is intended to replace Universal Analytics remains to be seen, but conceptually it would be difficult to justify future maintenance or feature releases to Universal Analytics, when there’s this shiny new measurement model to contend with.
I’m cautiously excited about bringing Firebase to the web. It’s something I’ve been looking forward to ever since I began to work with Firebase (and Firebase Analytics) a long time ago. I think the measurement model of users and events is superior to the heavily aggregated and sessionized model used by Google Analytics.
However, it remains to be seen just how much of a context switch we need to do mentally in order to understand how the use cases addressed by Google Analytics: App + Web are comparable to those of Universal Analytics.
I will definitely put more resources to writing content for Firebase now, as this new way of bridging together application and website analytics is too interesting to ignore.
Let’s discuss Google Analytics: App + Web in the comments, but please remember that we are talking about a beta product. You are free to sound off your frustrations about development decisions and missing features, but do note that providing your criticism in a constructive manner could end up with changes addressing those criticisms in the final product, as the purpose of a beta release is to pull in feedback from the community.