Track Content Engagement Part 2
A couple of days ago, I wrote an article on tracking content engagement. Even though the solution itself works, and it’s a really neat trick if I can say so myself, it has its problems.
After all the glory I showered on User Timings in Google Analytics, they have one serious flaw: they cap at 10,000 samples per day. What a ridiculous, arbitrary limit.
In any case, this means that if you have enough traffic to accumulate 10K user timing hits per day, it means that the solution I provided in the previous article will not work for you, as the Pageviews will not be capped, meaning the calculation of Total Engaged Time / Pageviews will be skewed.
After awesome discussions with people like Al Wightman, Zorin Radovancevic, and Yehoshua Coren, this article is meant to replace the User Timings setup from the previous guide with a new solution, which utilizes Events and Custom Metrics. Since most of the article is still valid, please read the previous article all the way until you reach 4. User Timings. This is where this post will pick things up, and I’ll make sure to guide you all the way to the finish line, so you don’t have to refer back to the original article, unless you want to make sure you got all the initial steps right.
XThe Simmer Newsletter
Subscribe to the Simmer newsletter to get the latest news and content from Simo Ahava into your email inbox!
Before we get started
Instead of User Timings, which measures milliseconds, this new solution will use a Custom Metric, which measures engagement time in seconds. This will be piggybacked on a non-interactive event hit.
In Google Analytics, we’ll create a Calculated Metric with the following formula:
Total Engaged Time / Pageviews
Since each event is (or should) always be associated with a pageview, we can aggregate these nicely in a Custom Report we’ll build at the end of this tutorial.
In other words, this solution will use up a Custom Metric slot, and it will increase the event hit count for your site. If you’re already breaching the 500 hits per session limit, this might well take you over the top. But, let’s be honest, if you’re near the 500 hits per session limit, you’ve already fudged up something in your measurement plan, so don’t blame me for those mistakes!
4. Custom JavaScript Variable
Let’s pick up the steps of the previous guide with a new Custom JavaScript Variable. Name it JS - Get Engagement Time In Seconds (or something to that effect), and add the following code within:
function() {
  return {{DLV - nonIdleTimeElapsed}} / 1000;
}
This simply returns the nonIdleTimeElapsed key from the data layer divided by 1000, to get the number of seconds of engaged time collected by the script from the previous article.
5. The Custom Metric (GA)
Next, go to Google Analytics Admin. Open Custom Definitions under Property Settings, and click Custom Metrics.
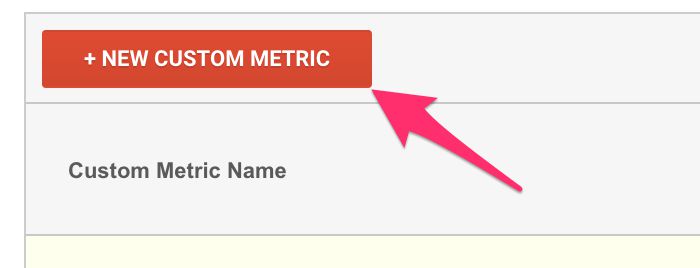
Next, create a new Custom Metric, by clicking the big red button.
Give the new Custom Metric a nice, descriptive name: Total Engaged Time. Make sure you’ve got Time selected as the Formatting Type, and you can keep all the other settings as they are.
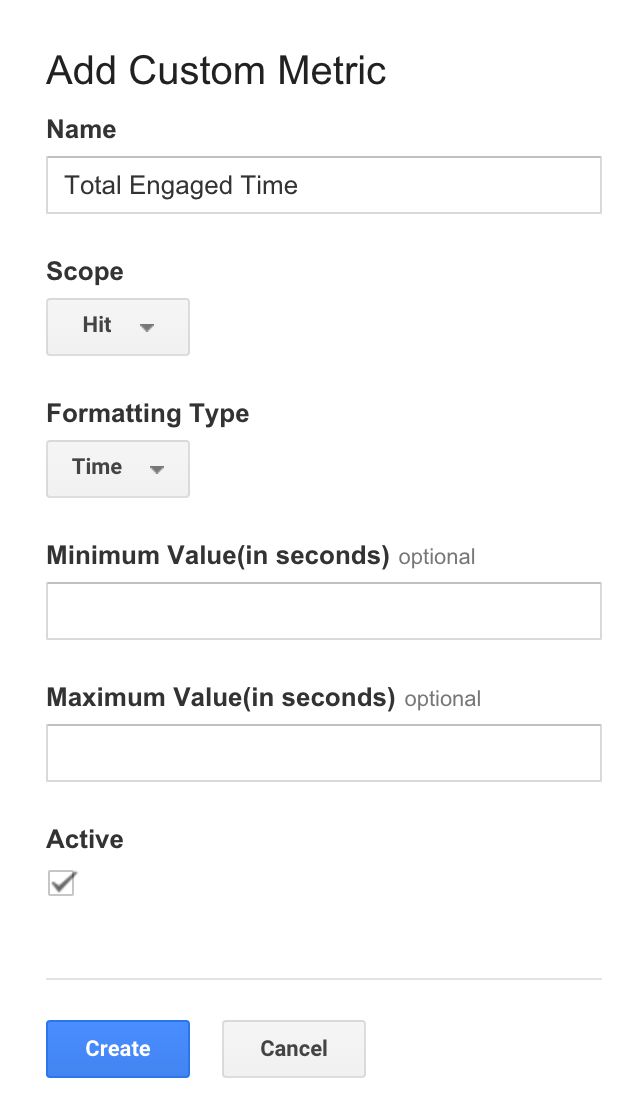
Finally, click Save.
Make note of the Index number assigned to the new metric. This is important!
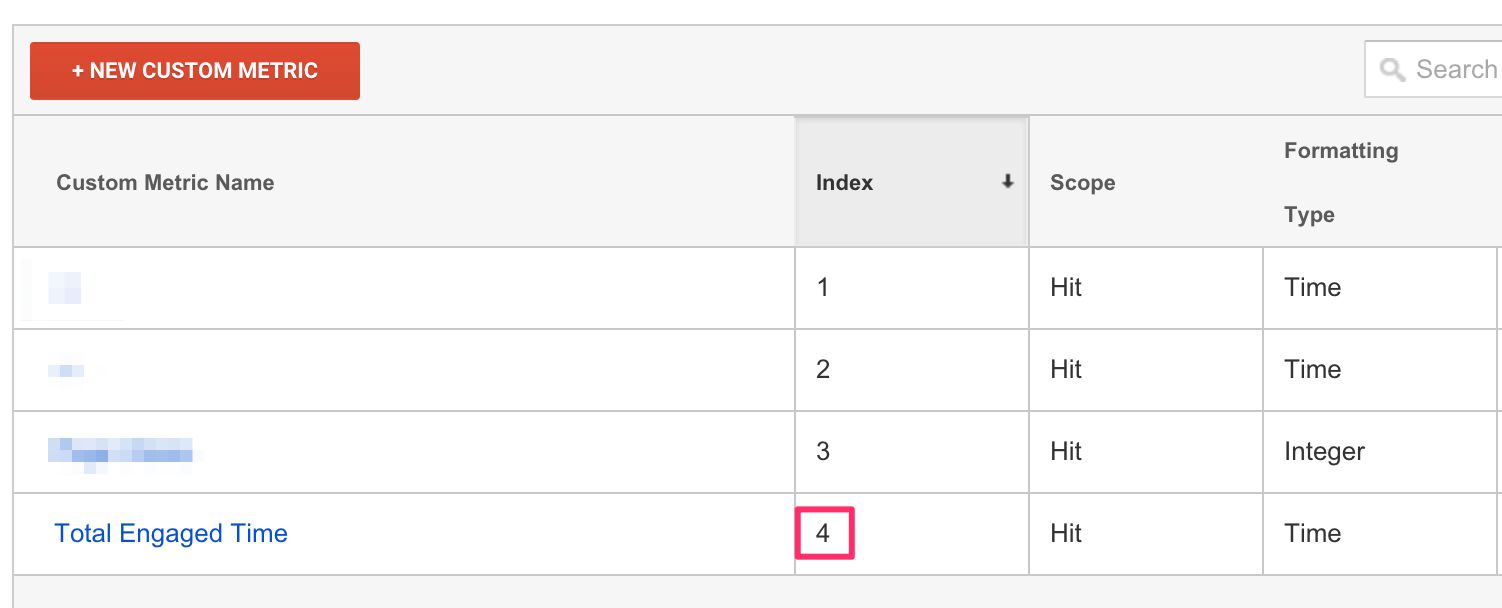
That’s it for the metric!
6. The Event Tag
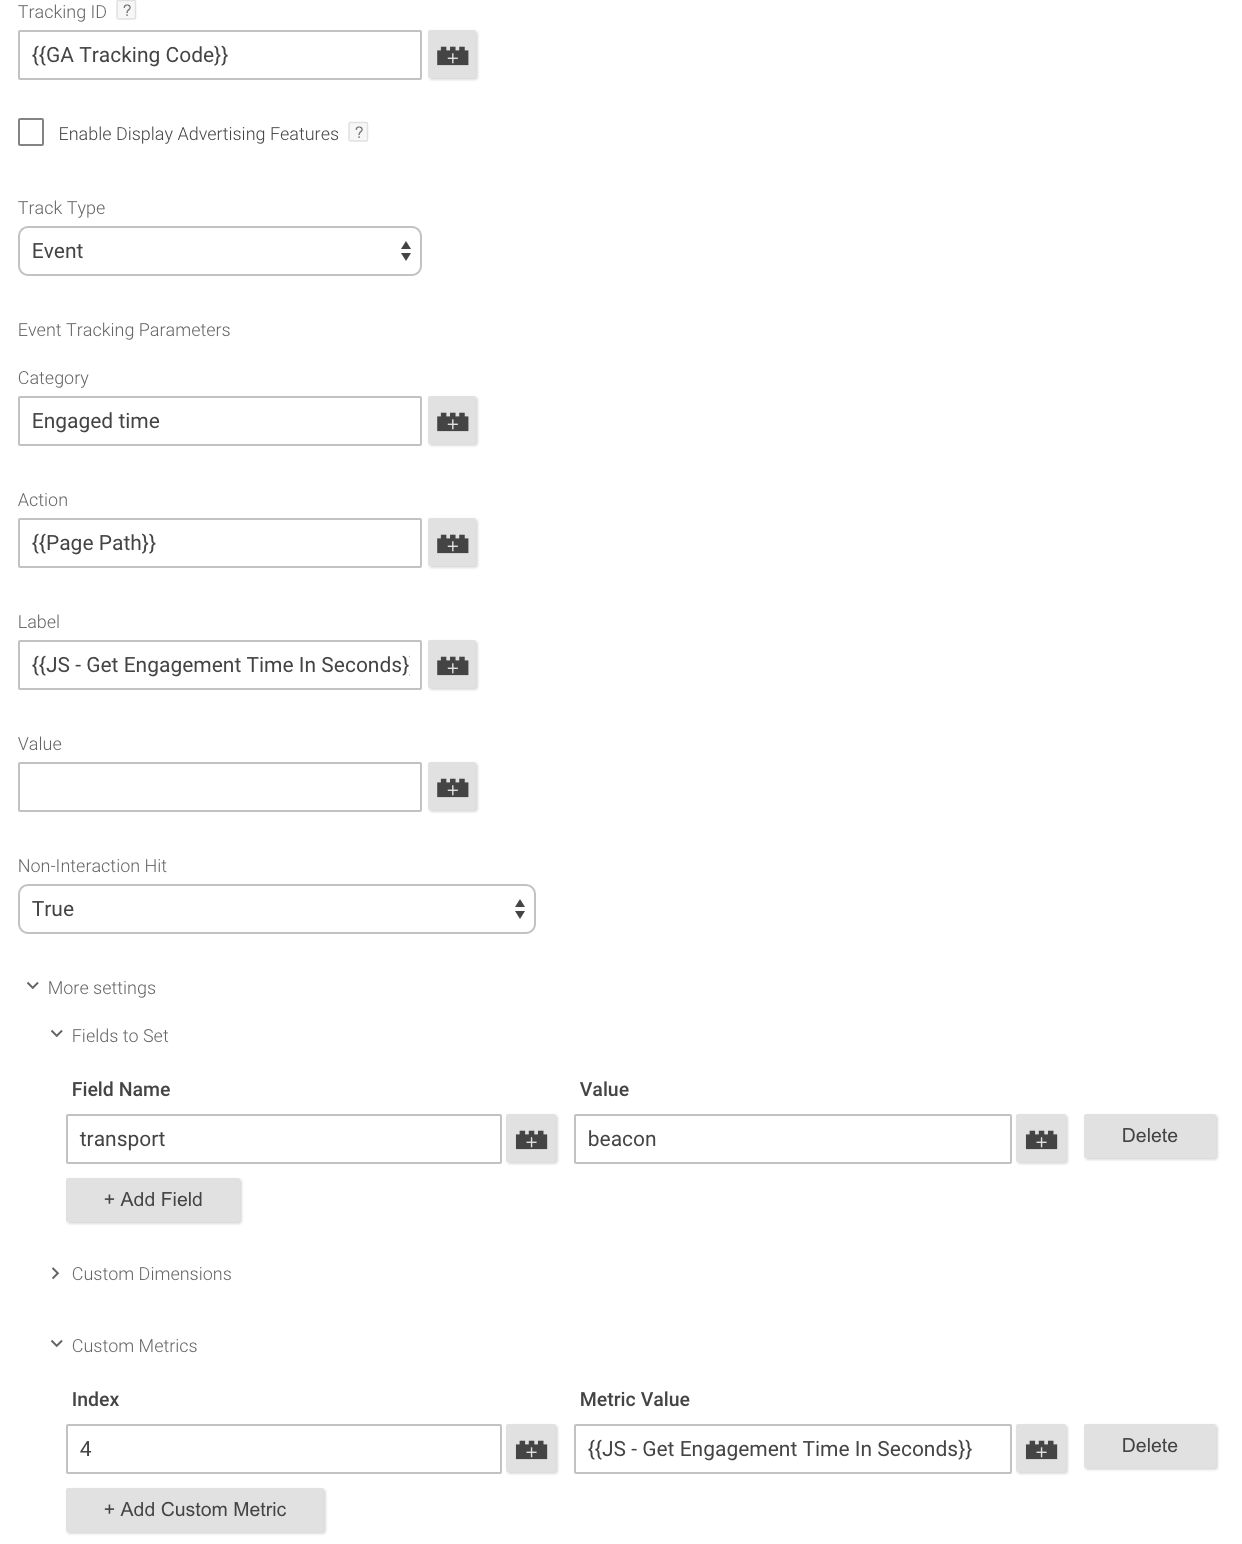
The Event Tag can have whatever values you want in the fields. For debugging reasons, I always include the value I’m piggy-backing on the hit (the Custom Metric in this case) as one of the fields.
To make this work, you will need the following:
-
Values in Event Category and Event Action, since these are required fields
-
A new field with name transport and value beacon to improve the accuracy of timing hits sent when the user is leaving the page
-
A Custom Metric with the index number from the previous step, and the Custom JavaScript Variable you created earlier as the value
-
Add the Custom Event Trigger you created in step 2 of the first guide to the Tag
The Custom Metric is naturally the most important part of this machine, but I strongly recommend adding the transport field as well.
7. The Calculated Metric (GA)
Almost done!
Now, go to Google Analytics Admin, and under View Settings, click Calculated Metrics. Click the big red button with + New Calculated Metric, and make new metric look like this:
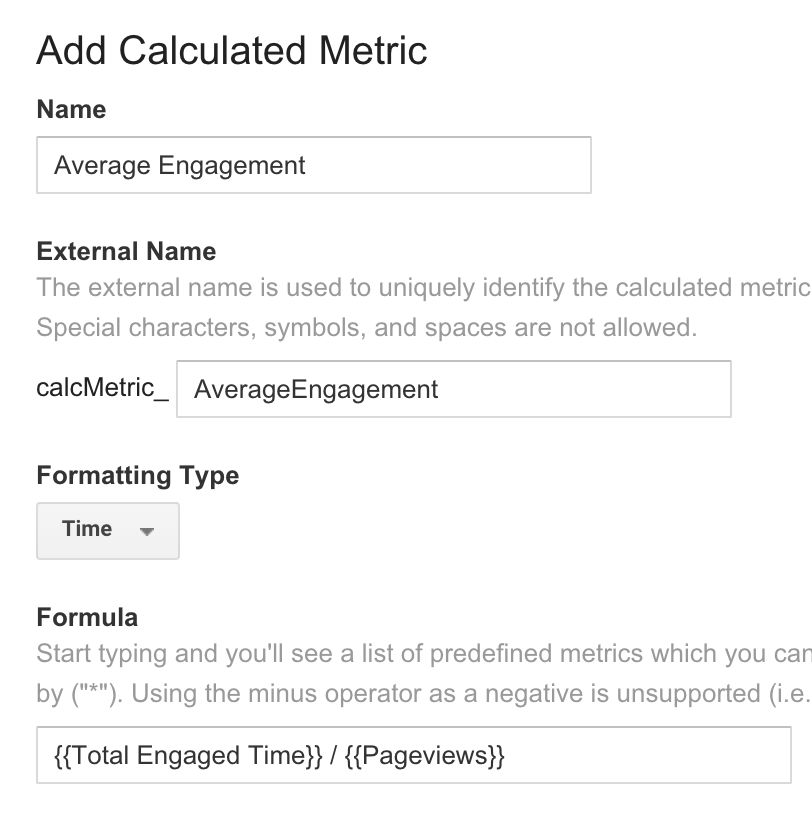
The important part to get right is the Formula. Instead of having to type in the brackets, you can just start typing “Total Engaged Time”, and the autocomplete should suggest the correct metric to you. Then, add the / to denote division, and finally start typing “Pageviews”, and again the tool should suggest the correct metric to you.
Great! Now we have our Calculated Metric, so we can build a nice, simple Custom Report to give us the low-down of our content engagement time.
8. The Custom Report (GA)
This is what my Custom Report setup looks like:
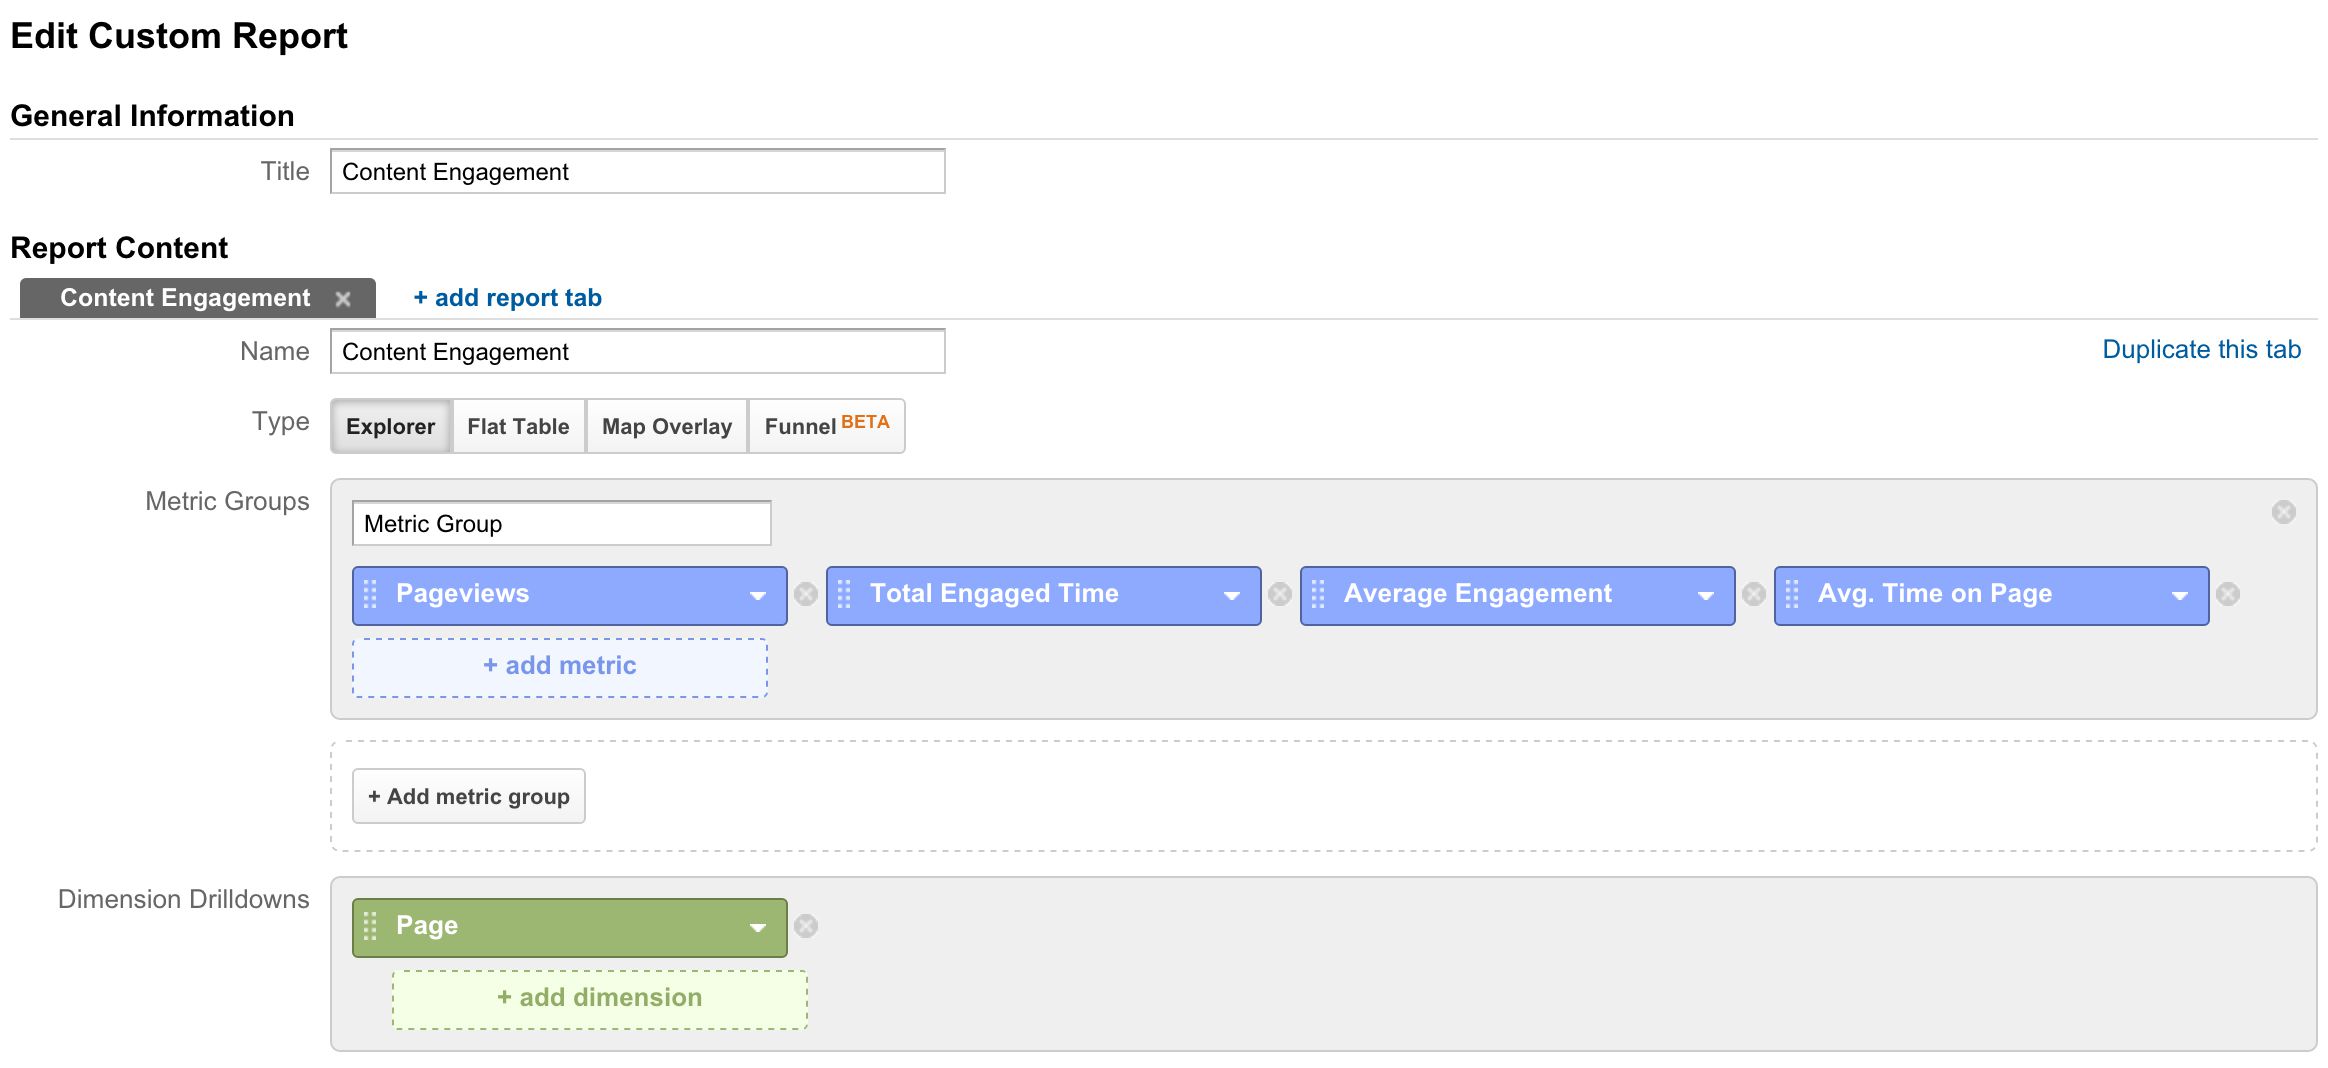
It’s very simple, but it yields a lot of interesting data. You can even juxtapose it with the default Average Time On Page to see the incredible discrepancy between just loading a page and actually interacting with it.
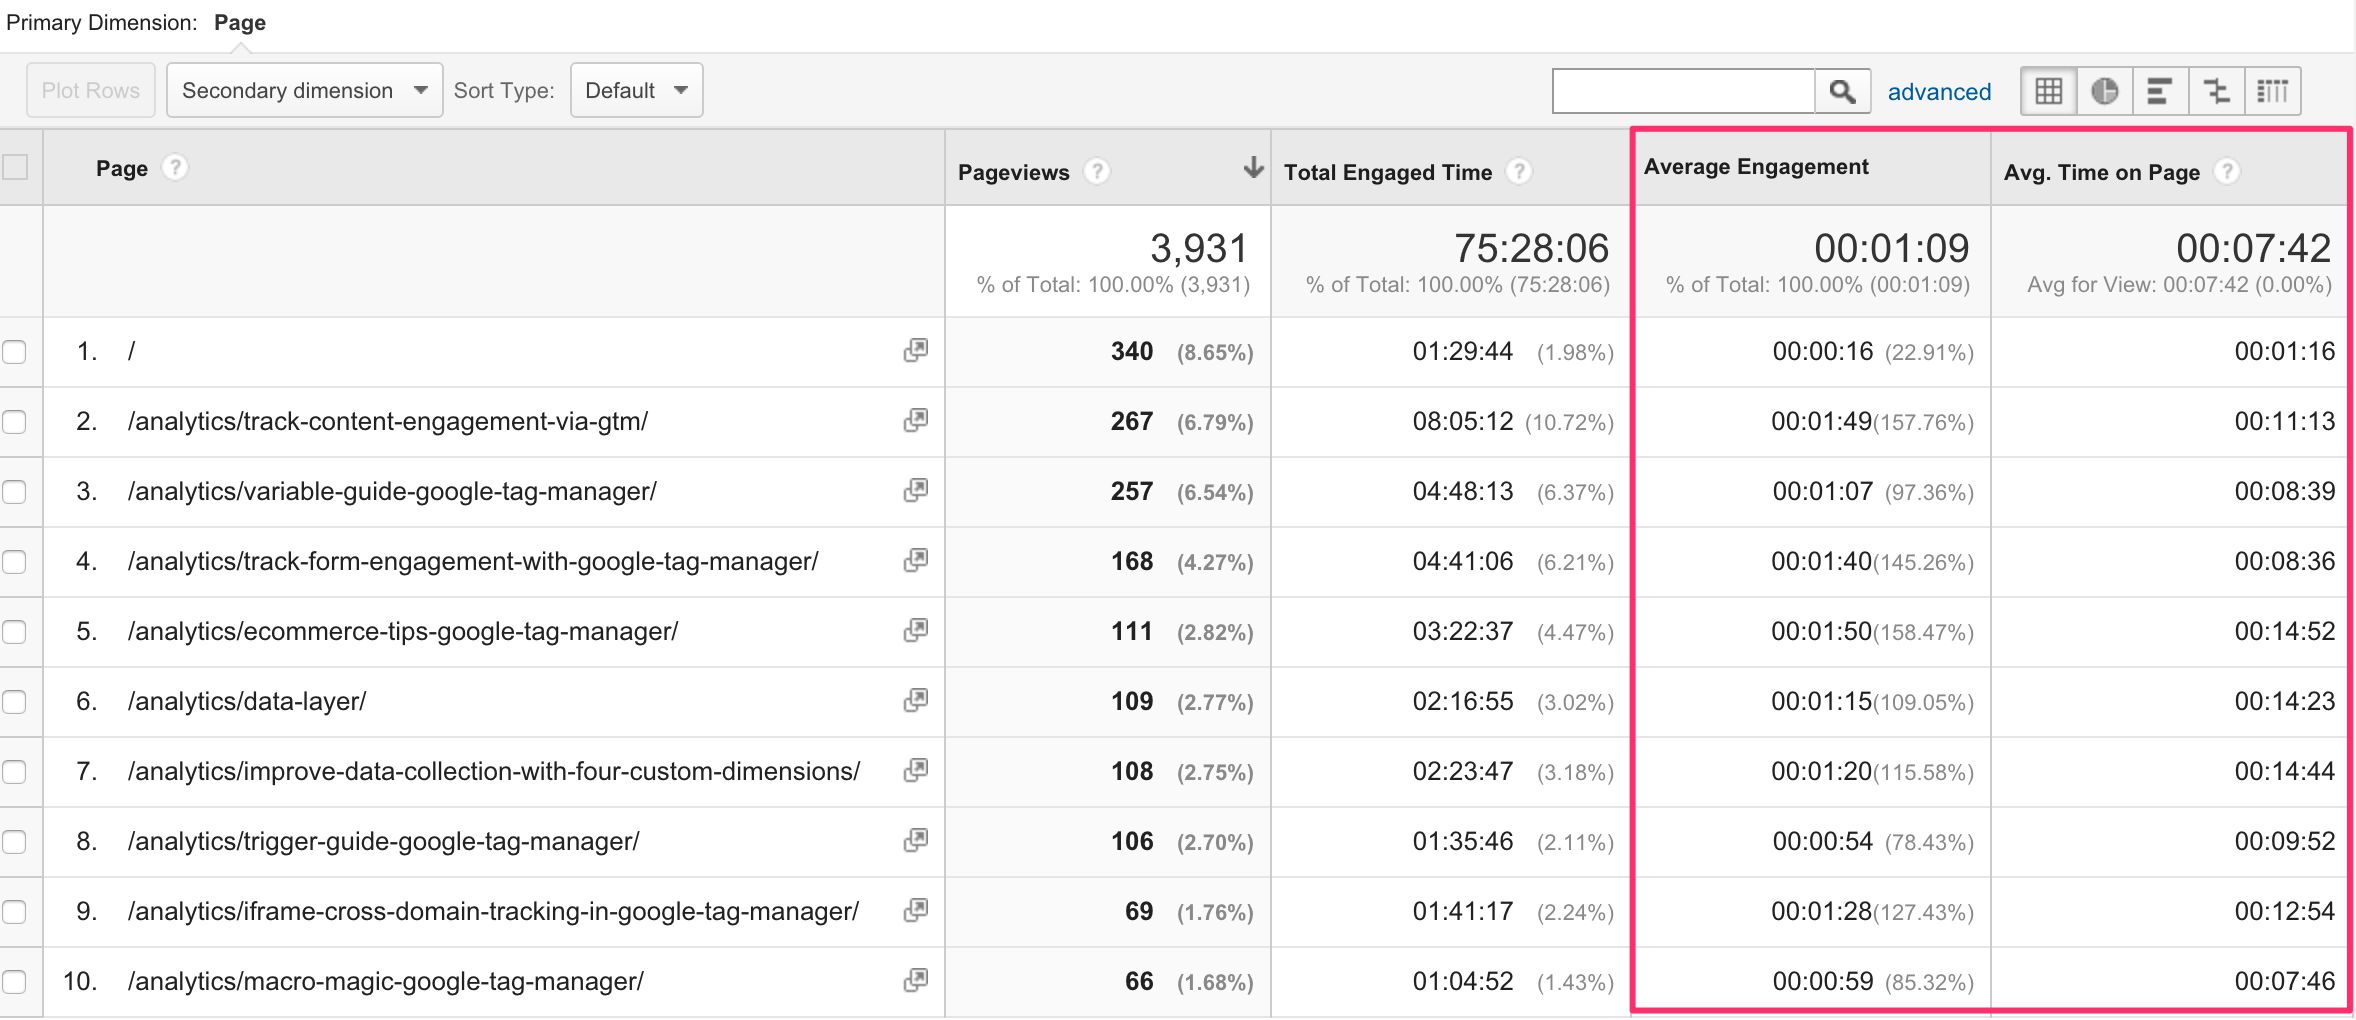
That’s a pretty big difference, wouldn’t you say?
Summary
Again, huge thanks to Zorin, Al, Yehoshua, and everyone else who pitched in. User Timings was a let-down, as it’s obviously not meant to be used as a data collection metric. However, I wish the sampling would be made more realistic. I perfectly understand why Page Timings are sampled, since you only need a sample to extrapolate a huge amount of useful information. But why not treat User Timings as regular hits, subject to the normal data collection limitations of the platform?
One of the caveats of using Custom Metrics and Events is the unpredictability of the session. For example, come midnight, the session will end, but the events will still continue collecting data in the next session, which might be without a landing page altogether! This is a problem on any site with a global audience (such as mine). However, the more data you collect, the more marginal stuff like this will be normalized out of the equation.
In any case, Custom Metrics lets you work around the problem of User Timings, since they can also be formatted for time. The combination of Calculated Metrics and Custom Metrics is a game-changer for Google Analytics, and has been instrumental in creating a huge amount of added value to all kinds of analytics setups.
I hope this article has been helpful, and I’m sorry for making you pogo between two texts while trying to come up with the best way to measure content engagement on your website.
Let me know if you have any comments or improvement suggestions!