Simple Way To Measure A/B Test Flicker Impact
“Flickering” or “Flash Of Original Content” (FOOC) is a phenomenon where there’s a (typically) slight but observable delay in the browser updating the site or element layout if the user is included in a variant group for experimentation. This manifests in the original, unmodified element being rendered in the visible portion of the page before the experiment library updates it with the variant.
There are ways to mitigate the flicker:
- Add the A/B testing library directly into the page template and don’t load it via some other, asynchronously loaded dependency (e.g. Google Tag Manager).
- Load the A/B testing library synchronously, and have it hide the element that is being tested until the library is loaded.
- Utilize some kind of anti-flicker tech.
- Run the experiments server-side, and render content with the variant in place.
Typically, the only non-intrusive and consistent way to avoid the flicker is to look into server-side rendering for your experiments. For example, tools like Conductrics offer a robust set of APIs to do all the decision-making logic in your server. Then there are tools like Google Optimize that require you to do the variant selection and assignment manually, but the tool can then handle the data collection and reporting.
However, the reason you’ve read thus far is probably because you’re worried about client-side testing.
Table of Contents
The Simmer Newsletter
Subscribe to the Simmer newsletter to get the latest news and content from Simo Ahava into your email inbox!
Introducing the problem
With JavaScript-based experimentation libraries, you’re subject to the rules and limitations of the page render in the browser. The flicker happens because the page with the modified element is being rendered from the page HTML source, but the experimentation library needs to wait for an opening to allow the browser to process the experiment data.
This is most often a problem when you’re running scripts asynchronously. Async load means that once the browser starts to download the library, it doesn’t wait for the download to complete. Instead, it proceeds with the page render. Once the download is complete, and as soon as the browser has an available slot in its single thread of execution, it will start parsing and executing the JavaScript within the library.
By moving from asynchronous to synchronous loading, you solve part of this issue. However, it’s not like synchronous loading actually fixes anything automatically. Since the library is loaded at the top of <head>, a synchronously loaded library doesn’t have access to the elements it’s designed to modify (since those elements are created in the <body>, which hasn’t yet been generated).
Instead, libraries like Google Optimize, when loaded synchronously, actually hide the element that’s being tested. They inject a style declaration that sets the visibility of all elements matching the CSS selector of the experimentation targets to hidden. Only once the element has been actually added to the page, can Optimize then modify it and unhide it. This is fairly elegant but it might introduce a slight flicker of another kind, where the element seems to “pop” into place out of sequence with the rest of the render.

A similar solution is anti-flicker JavaScript. The purpose here is to actually hide the entire page until the experimentation library has loaded. This is, and has been, my biggest objection about how A/B-testing tools are implemented. I simply can’t fathom the logic behind potentially sacrificing the usability of the entire page just to get better data quality for your experimentation.
Considering how crucial page performance and perceived page performance is these days, I steer clear of anti-flicker snippets that hide the entire page. It doesn’t matter if there are mitigations in place for ad blockers and download errors. If the endpoint is unresponsive or lags, Google Optimize’s default anti-flicker snippet has the page wait for a maximum of 4 seconds (this is adjustable) before revealing the content. Naturally, if the container loads before that, the page is revealed faster. But still, OUCH!
Measuring the impact of flicker
So, let’s assume the situation is as follows:
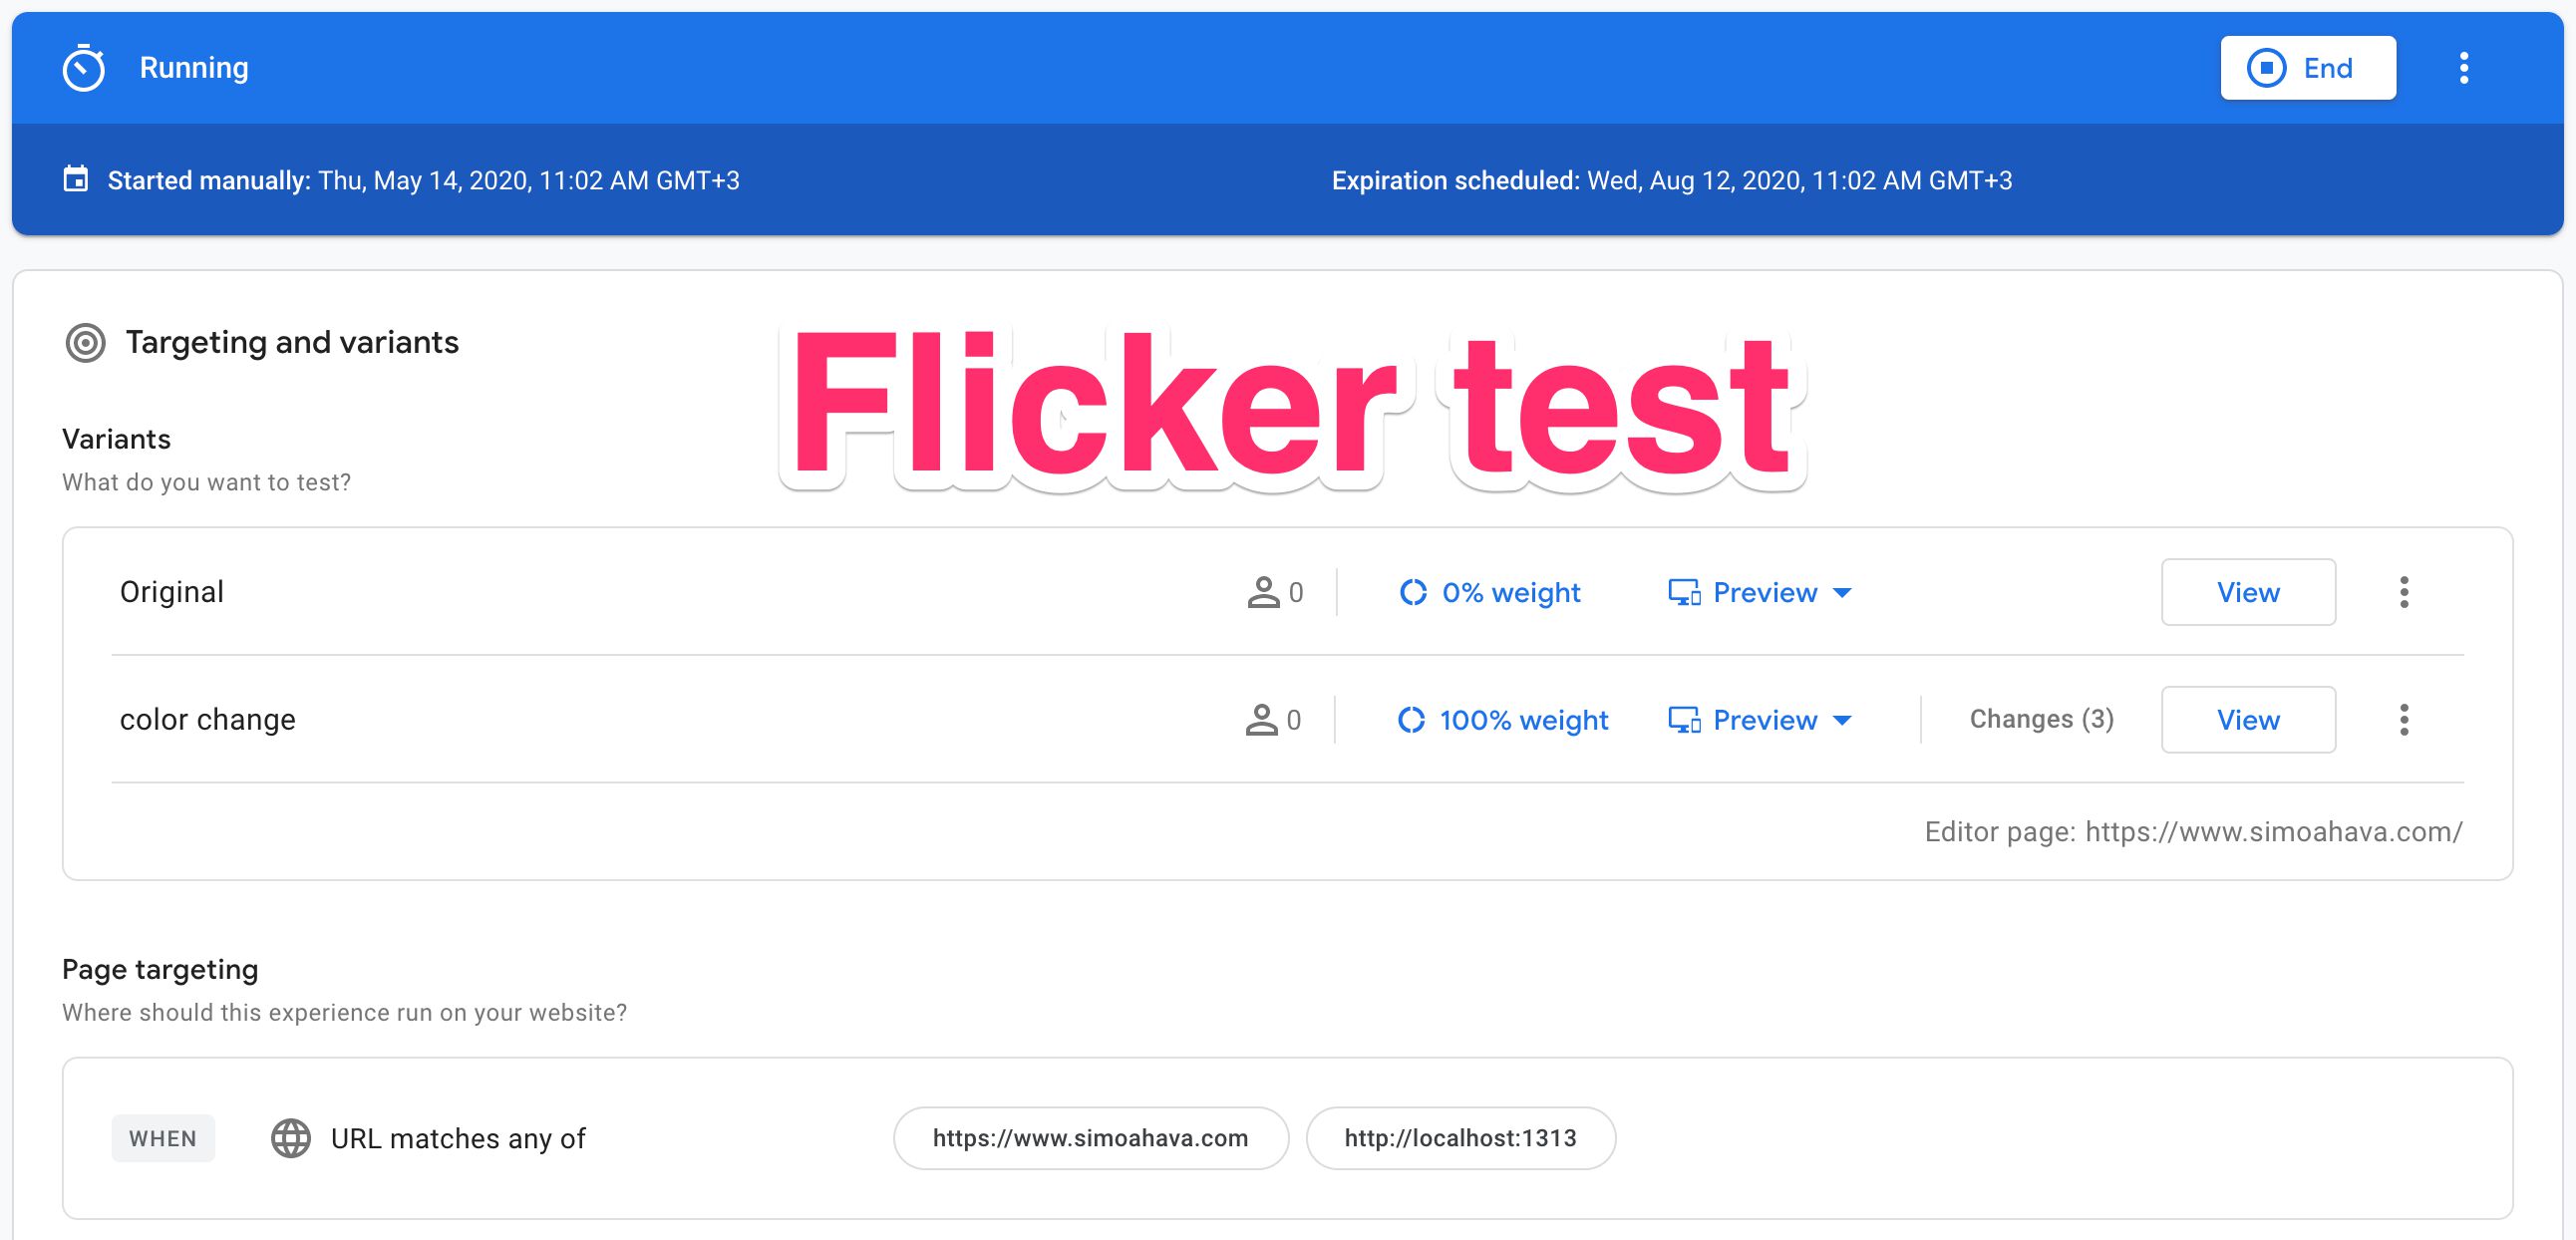
You’ve got an experiment running that treats a home page element, which is visible above the fold if the page is loaded without a scroll threshold in place.
You’ve deployed Google Optimize using the new snippet. You’ve deployed the asynchronous snippet, and you are not using the anti-flicker JavaScript, so there’s a visible and measurable flicker in place.
 Flicker of the original (grey background) before the variant (red background)
In order to measure the severity of this flicker, we need to collect a number of timings:
- Time when the original element was added to the page,
- Time when the original element became visible in the viewport,
- Time when the experimentation library was loaded,
- Time when the experiment change was applied to the page.
The flicker is the time delta between (2) and (4). If the element isn’t visible in the viewport, or if the experiment is applied before the base element becomes visible, the flicker is not a problem. (3) is interesting metadata about how the experimentation library itself works, and how fast it manages to apply the change after loading.
Introduction to the JavaScript we’ll need
The solution will rely on two pieces of JavaScript code running directly in the page template. You can’t execute this code reliably through a dependency like Google Tag Manager, because Google Tag Manager in many cases loads after all steps (1)-(4) have already happened, meaning you won’t get accurate measurements.
The first bit of JavaScript is run at the very top of <head>, even before the Optimize snippet. This script uses the optimize.callback API to collect the timestamp of the experimentation library load. This is timing number (3) in the list above.
The second JavaScript snippet is added to the top of <body>, because the observers need access to document.body. Here’s what it does:
- A MutationObserver waits on the page and reacts to two changes: when the element is first added to the page, and when the element is updated with the variant. These are timings (1) and (4), respectively, in the list above.
- An IntersectionObserver is added to the page as soon as the original element is rendered. The purpose of the IntersectionObserver is to fire a callback as soon as the original element is visible in the viewport. This is timing (2) in the list above.
Once the timings have been collected, they are pushed into dataLayer to be used in Google Tag Manager.
Other preparations
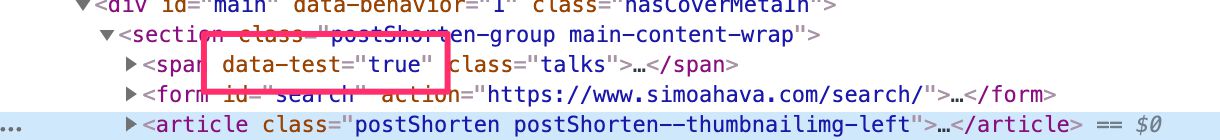
To best measure the application of the experiment element, I have added the data attribute data-test="true" to the variant. This makes it easier for me to locate the element using CSS selectors.
The attribute is added via the Optimize editor, and is thus only present on the element after it’s modified by Google Optimize.
Finally, I’m collecting all this data using Google Tag Manager, and I’m sending it to App + Web because I want to collect it in BigQuery for more granular analysis.
You could just as well calculate the delta directly in the client and send it to, for example, Universal Analytics as an event. This is entirely up to you. I opted for the BigQuery approach - I justify this later in the article.
Installing the Optimize library and callback
To install the Optimize library, I’m adding the <script> element with the async attribute to the top of <head>.
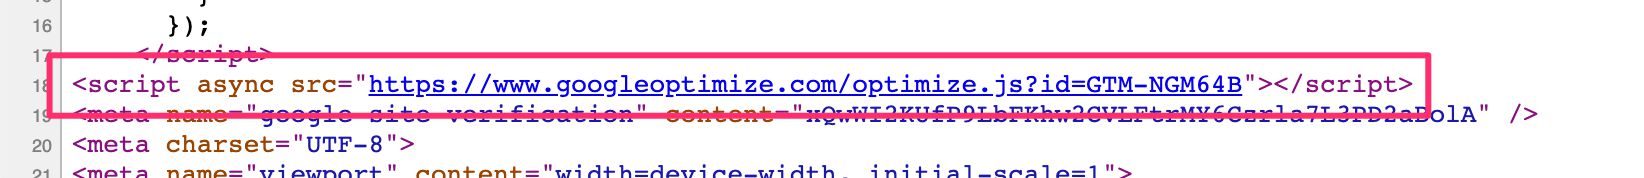
By adding it to the top of <head>, I’m not eliminating the flicker (because it’s still loaded asynchronously), but I am making sure that the download of the library begins as soon as the page render starts. This helps mitigate the flicker a great deal.
Then, to add the Optimize callback, I’m running the following script before the Optimize snippet at the very beginning of <head>.
<html>
  <head lang="en-us">
    <meta name="generator" content="Hugo 0.61.0" />
    <script>
      function gtag() { window.dataLayer = window.dataLayer || []; window.dataLayer.push(arguments); }
      gtag('event', 'optimize.callback', {
	    callback: function(e) {
	      window.__flickerTestMilestones = window.__flickerTestMilestones || {};
          window.__flickerTestMilestones.experimentLoaded = new Date().getTime();
	    }
      });
    </script>
    ...
  </head>
  ...
</html>
Here, we first create the gtag queue (because that’s what Optimize uses for its API control). Then, we push a callback in the shape of a gtag event. I’m passing an anonymous function to the callback argument. This function references a global object which we’ll use to collect the milestones. The only milestone we populate in this callback is experimentLoaded, and we attach the current timestamp to it.
The callback is invoked as soon as the experiment library has loaded and Optimize has established to which variant the user belongs (and thus which version of the element to show to them).
Installing the observer scripts
Here’s the tricky bit. You need to install two observers (a MutationObserver and an IntersectionObserver). The first checks if an element has been added to the page, and the second checks if an element is in the viewport. I’ll show you the code first and then explain what it does.
<body>
  <script>
      (function() {
        var ftm = window.__flickerTestMilestones = window.__flickerTestMilestones || {};
        var testState = 'success';
        var dpush = function() {
          if (testState !== 'noObservers') {
            // If milestones are incomplete and it's not because of lack of support, do nothing
            if (!ftm.experimentLoaded ||
                !ftm.baseElementAddedToPage ||
                !ftm.testElementAddedToPage) return;

            // If all other milestones are in place, but baseElementVisible is not,
            // send the other timings and make note that base element was not visible.
            if (!ftm.baseElementVisible) { testState = 'baseNotVisible'; }
          }

          // Push everything to dataLayer
          window.dataLayer = window.dataLayer || [];
          window.dataLayer.push({
            event: 'optimize_flicker_test',
            testMilestones: {
              baseElementAddedToPage: ftm.baseElementAddedToPage,
              baseElementVisible: ftm.baseElementVisible,
              experimentLoaded: ftm.experimentLoaded,
              testElementAddedToPage: ftm.testElementAddedToPage,
              testState: testState
            }
          });

          // Reset the test
          window.__flickerTestMilestones = {};
        };

        // Only run if observers are supported by the browser
        if (window.MutationObserver && window.IntersectionObserver) {
          var observer = new MutationObserver(function(mutations) {
            mutations.forEach(function(mutation) {
              var node = !!mutation.addedNodes.length && mutation.addedNodes[0];
              if (node && node.matches && node.matches('span.talks')) {
                if (node.matches('[data-test]')) {
                  ftm.testElementAddedToPage = new Date().getTime();
                  dpush();
                } else {
                  ftm.baseElementAddedToPage = new Date().getTime();
                  dpush();
                  var intersectionObserver = new IntersectionObserver(function(entries) {
                    if (entries.some(function(e) {
                        return e.intersectionRatio > 0
                      })) {
                      ftm.baseElementVisible = new Date().getTime();
                      dpush();
                    }
                  });
                  intersectionObserver.observe(node);
                }
              }
            });
          });
          observer.observe(document.body, {
            childList: true,
            subtree: true
          });
        } else {
          // Make note that there was no support for observers
          window.__flickerTestMilestones = {};
          testState = 'noObservers';
          dpush();
        }
      })();
    </script>
  ...
</body>
</html>
This script runs at the very top of <body> so that the observers can be primed as fast as possible.
First thing to check is whether the browser supports both MutationObserver and IntersectionObserver. We don’t have to support all browsers for this - we just need a representative sample. If there is no support, then the dataLayer.push() includes the testState key with the value noObservers, and we can use that in our analyses.
I did not opt for a fallback to just polling the page until the element is found. It would have made the code more complex than it already is, and it could have potentially introduced performance issues that I’d rather avoid when experimenting with data.
The script then inserts the MutationObserver. This observer pattern can be used to detect things like DOM elements being added to the page or attributes changing for individual elements.
I’m only interested in child nodes being added to the page, because the original element (by the browser engine parsing the HTML source) and the variant (by the Optimize library) are added as new elements to the page. The observer is primed like this:
var observer = new MutationObserver(callback);
observer.observe(document.body, {
  childList: true,
  subtree: true
});
We’re attaching the observer to document.body, and we’re reacting to any changes in the child nodes, regardless of how deep they are in the subtree. If a change is detected, the callback function is executed.
In this case, I’m making sure that the observer callback only reacts to when the element I’m currently testing is added to the page:
if (node && node.matches && node.matches('span.talks')) {
Next, the code checks if the node that was added is the experiment element:
if (node.matches('[data-test]')) {
If you remember, above I mentioned that I add the data-test="true" attribute to the test element to make debugging easier.
If the added element was the experiment element, I update the milestone for testElementAddedToPage with the current timestamp. This is the moment when Optimize added the modified element to the page, and will serve as the endpoint of our delta measurement.
If the element was not the experiment element, it has to be the base element, so I update the milestone baseElementAddedToPage together with the timestamp.
Since I want to know the moment the base element became visible in the viewport, in the callback where I process the non-experiment element, I attach an IntersectionObserver to it as well.
var intersectionObserver = new IntersectionObserver(function(entries) {
  if (entries.some(function(e) {
    return e.intersectionRatio > 0;
  })) { ... }
});
intersectionObserver.observe(node);
The IntersectionObserver activates whenever the element that is being observed enters the viewport of the browser. I can then check if the element is visible even the tiniest bit (intersectionRatio > 0), and then update the milestone for baseElementVisible with the timestamp.
After every milestone, I check if at least baseElementAddedToPage, experimentLoaded, and testElementAddedToPage milestones have been updated. If they have, the milestones and the test state are pushed into dataLayer.
There are two reasons I’m not waiting around for baseElementVisible:
- Sometimes the experiment loads the updated element so fast that the base element is already removed from the page when the IntersectionObserver is supposed to go off.
- Sometimes the user has scrolled beyond the fold, and the
baseElementVisiblesimply does not fire (because the base element is not, well, visible).
Both of these mean that the flicker is basically a non-issue, so it’s OK for me to just collect a null in these cases. I update testState with "baseNotVisible" to make it easier to parse these in the analysis.
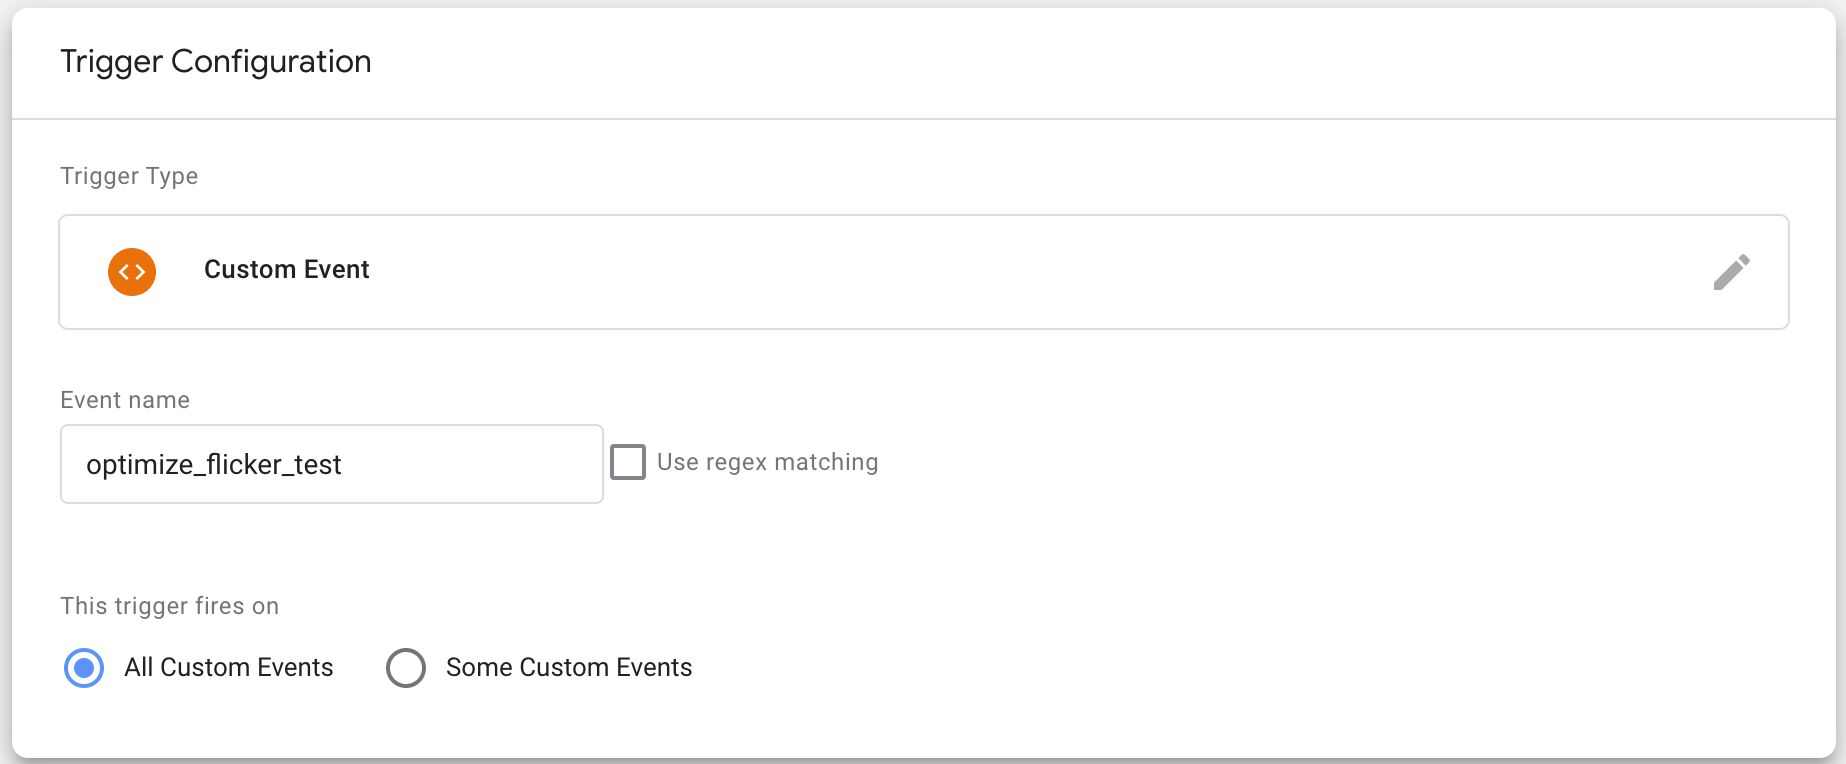
Setting up the Google Tag Manager assets
In GTM, the trigger I need looks like this:
You’ll need five Data Layer variables. Each is setup like this:
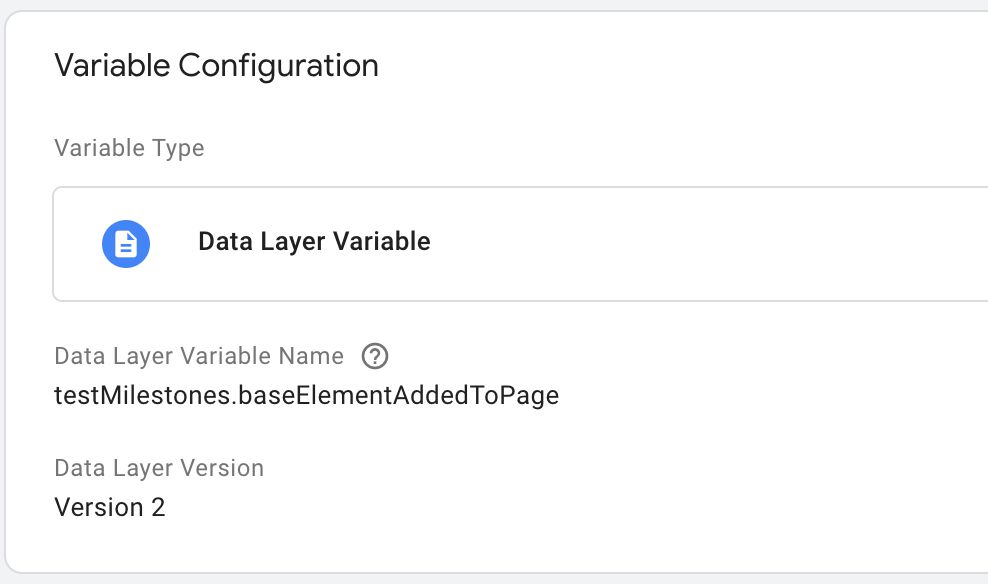
The variable names you’ll need are:
testMilestones.baseElementAddedToPagetestMilestones.baseElementVisibletestMilestones.experimentLoadedtestMilestones.testElementAddedToPagetestMilestones.testState
And this is what the App + Web event tag looks like:
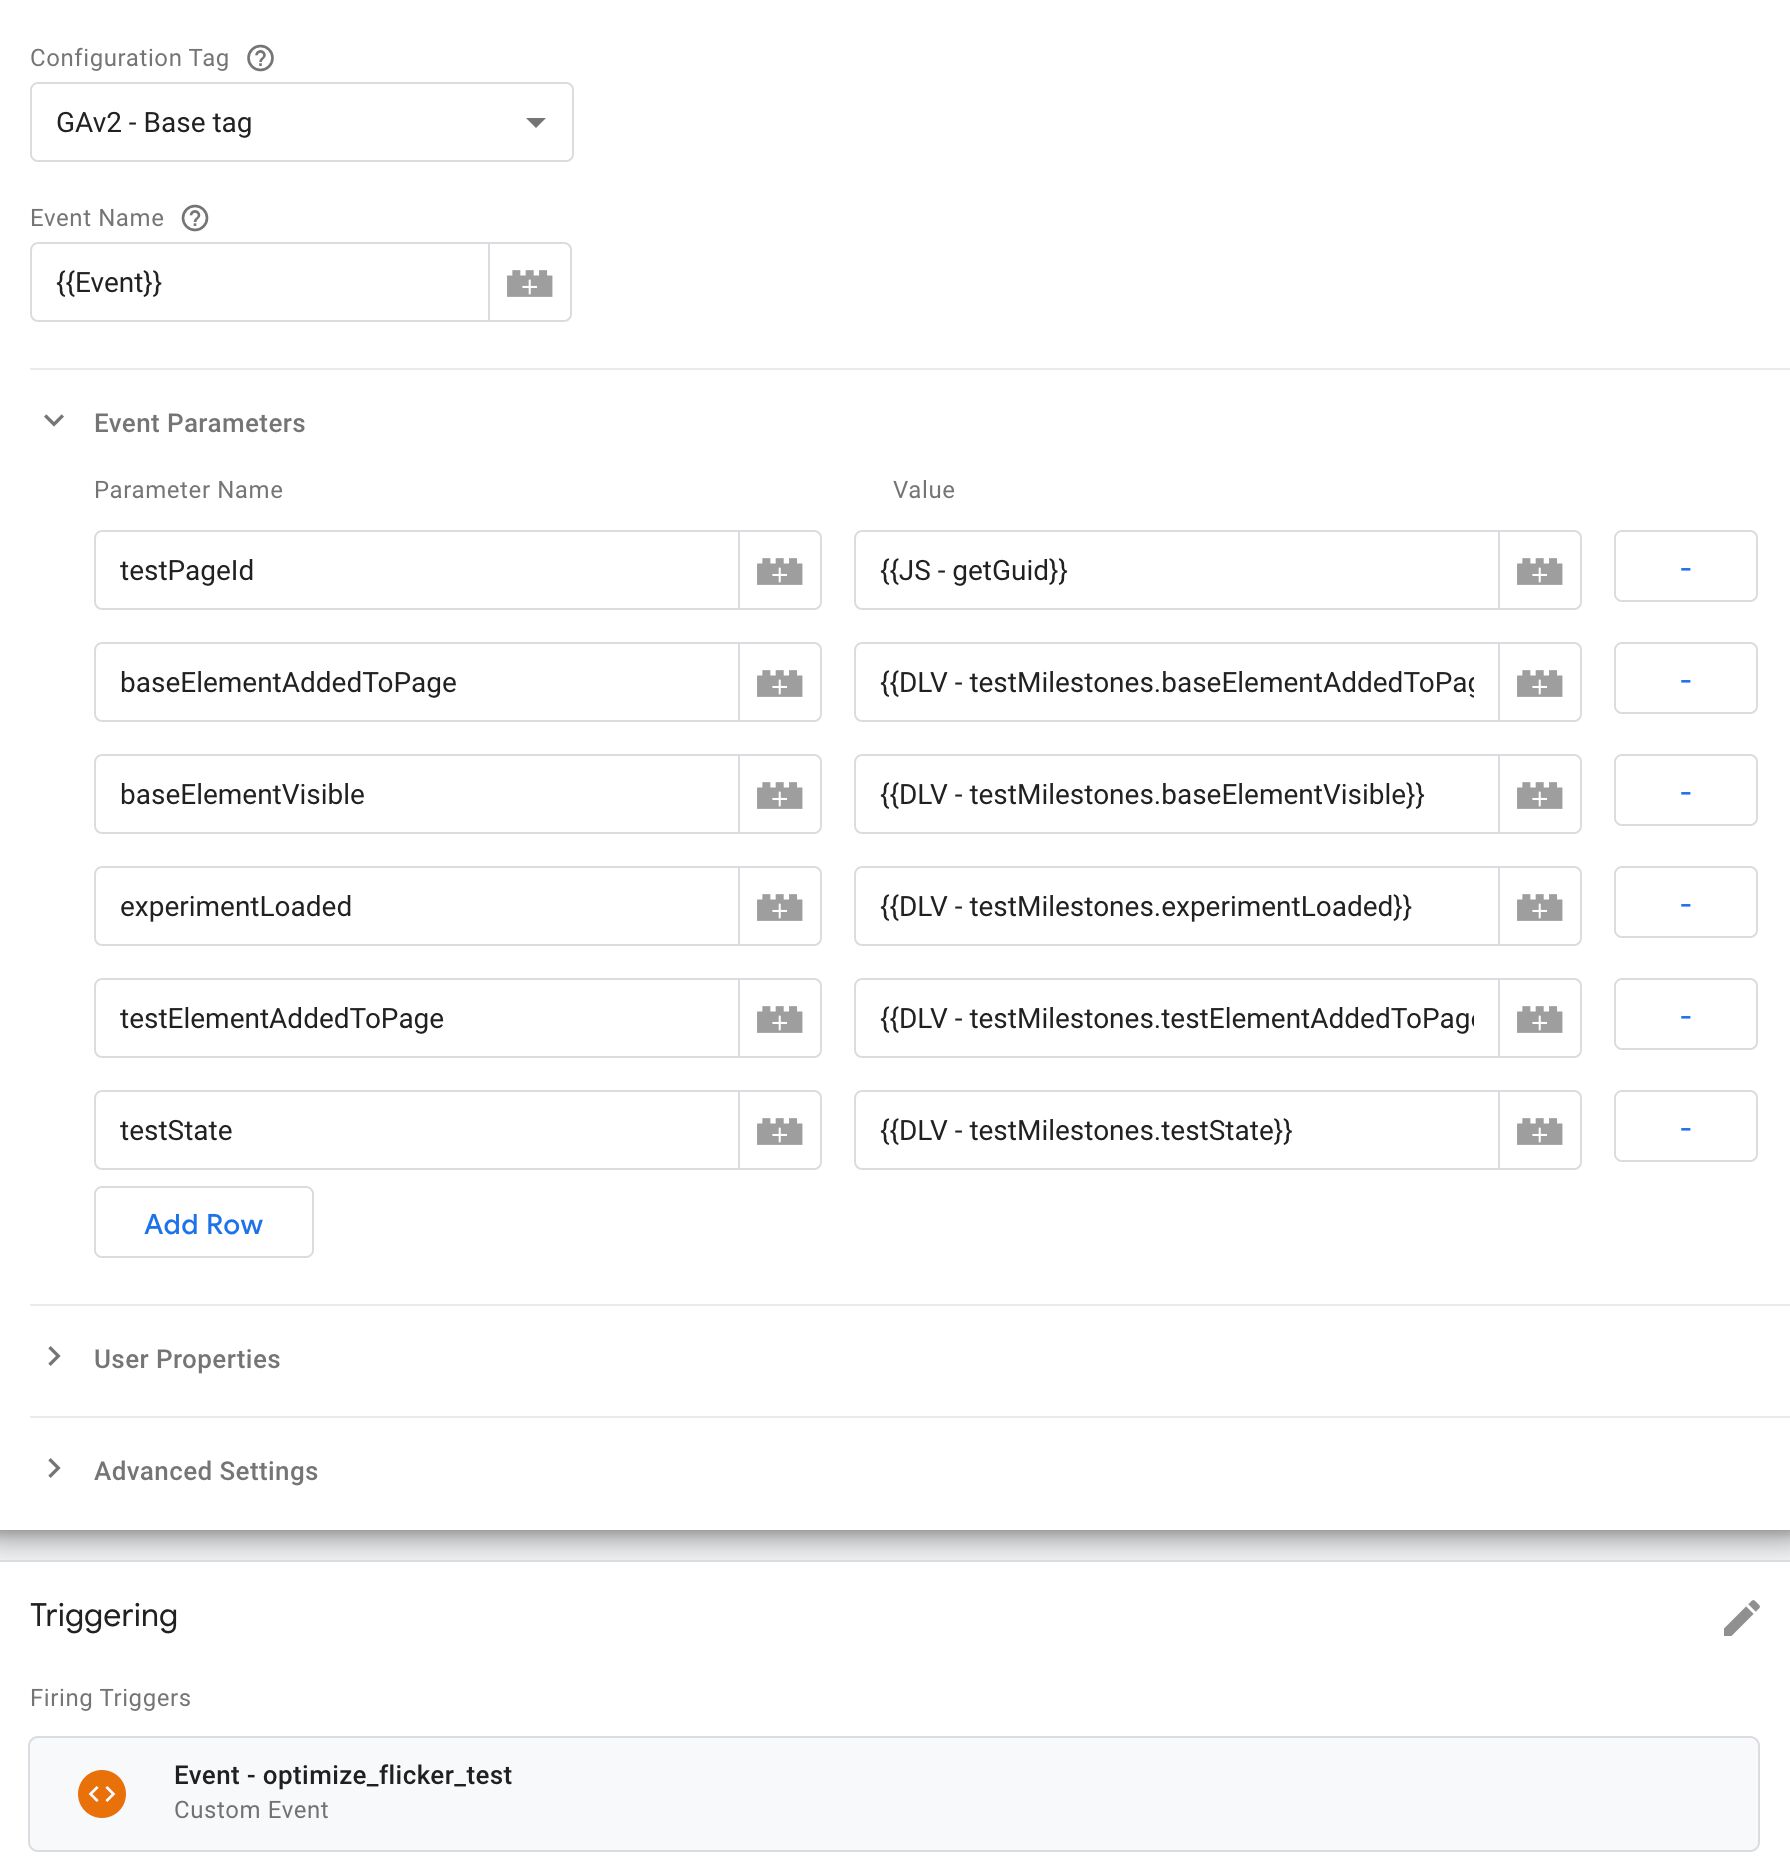
As you can see, I’m also sending a “page ID”. I can use this to group all the timings for any given user/session/page combination a bit more easily. It’s not strictly necessary, but might make some analyses a bit easier.
function() {
  window.__flickerTestPageId = window.__flickerTestPageId || {{Random GUID}};
  return window.__flickerTestPageId;
}
The “Random GUID” variable is another Custom JavaScript variable that returns a random, and fairly unique, identifier.
By setting a global variable, we make sure the same ID is used for all the events that are being measured.
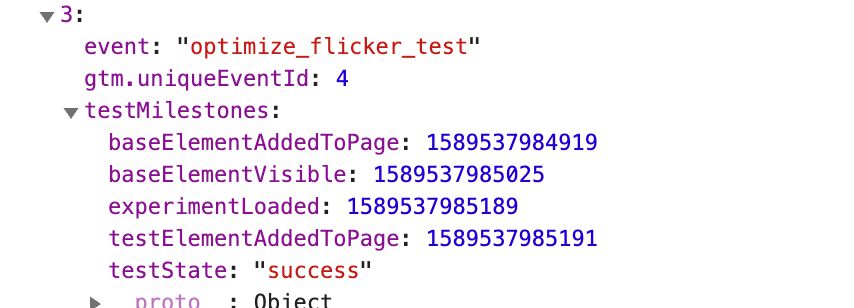
When I now load the home page of my site, this is what I see being sent to App + Web:

BigQuery output
In BigQuery, our event parameters are added into the event_parameters record. It’s not the classiest way to pass key-value pairs, especially since values are distributed as columns with one column per (potential) type. However, it is the only supported way of exporting custom parameters for now.
Full table output
Here’s what those optimize_flicker_test hits look like in our event table:
SELECT
  *
FROM
  `project.dataset.events_yyyymmdd`
WHERE
  event_name = "optimize_flicker_test"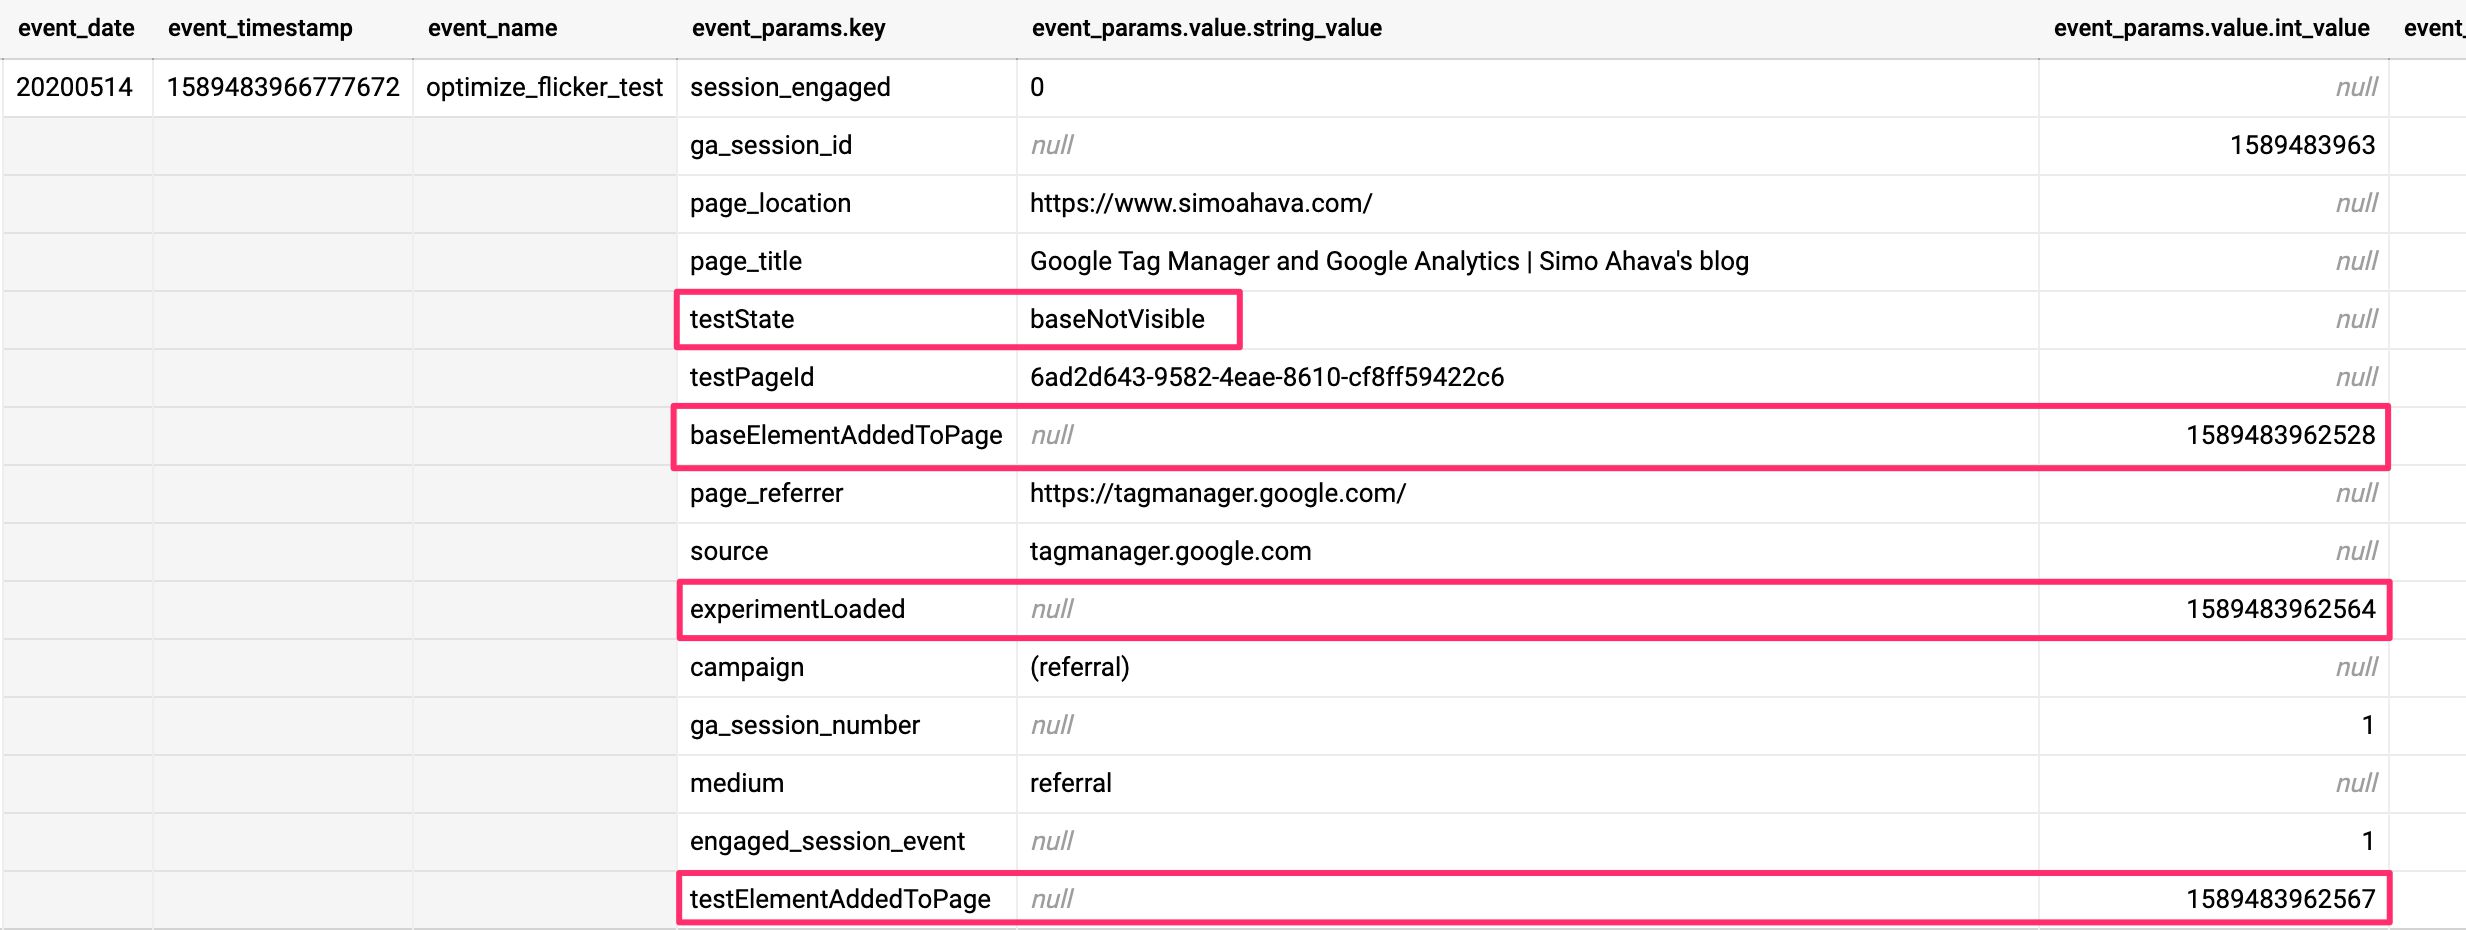
Count of test states
We can drill down and count the respective number of each test state:
SELECT
  ep.value.string_value AS test_state,
  COUNT(*) as count
FROM
  `project.dataset.events_yyyymmdd`,
  UNNEST(event_params) as ep
WHERE
  event_name = "optimize_flicker_test"
  AND ep.key = "testState"
GROUP BY
  1
ORDER BY
  2 DESC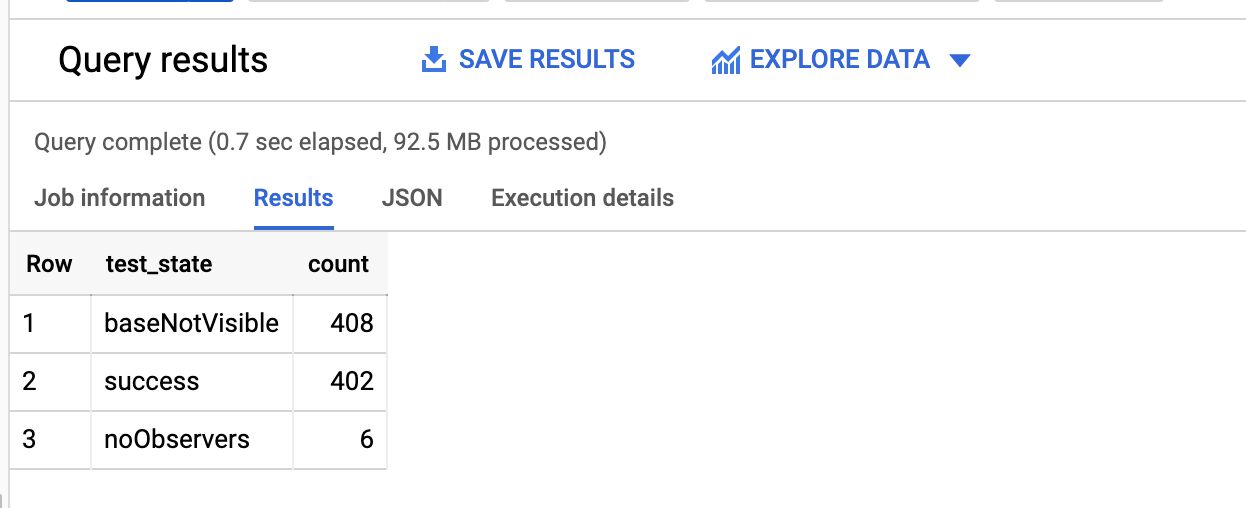
Table with deltas
We can also build a query that returns all the milestones with the calculated deltas:
WITH milestones AS (SELECT
  (SELECT value.int_value FROM t.event_params WHERE key = "baseElementAddedToPage") as baseElementAddedToPage,
  (SELECT value.int_value FROM t.event_params WHERE key = "baseElementVisible") as baseElementVisible,
  (SELECT value.int_value FROM t.event_params WHERE key = "experimentLoaded") as experimentLoaded,
  (SELECT value.int_value FROM t.event_params WHERE key = "testElementAddedToPage") as testElementAddedToPage
FROM
  `project.dataset.events_yyyymmdd` t
WHERE
  t.event_name = "optimize_flicker_test")
SELECT
  baseElementAddedToPage,
  testElementAddedToPage-baseElementAddedToPage AS injection_delta,
  baseElementVisible,
  testElementAddedToPage-baseElementVisible AS flicker_delta,
  experimentLoaded,
  experimentLoaded-baseElementAddedToPage AS experiment_delta,
  testElementAddedToPage
FROM
  milestones
ORDER BY
  flicker_delta DESC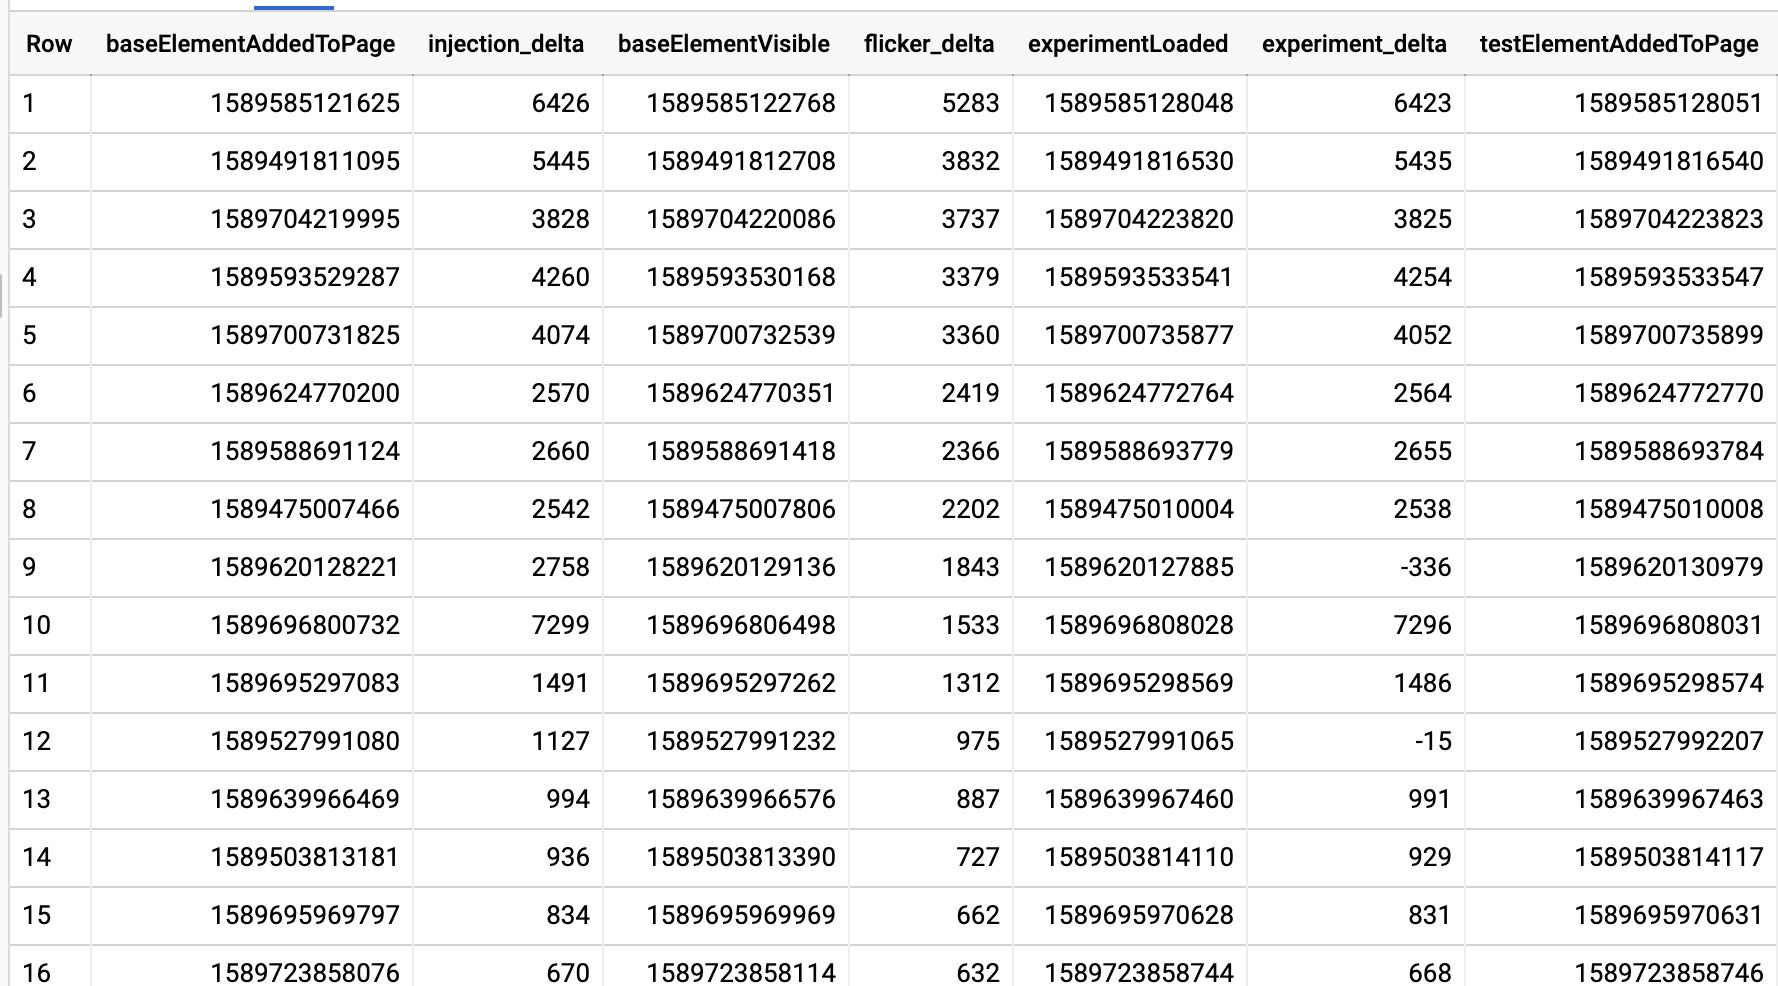
This is just one way to approach the data.
Here, I’m calculating injection_delta as the time it takes for the test element to be added to the page after the base element has been added. This could be used as a stand-in to measure the potential flicker.
The flicker_delta is the elapsed time from the base element becoming visible to it being replaced with the variant.
Finally, experiment_delta is the elapsed time from the base element being added to the page to the experiment loading. This value can be negative, meaning the experiment library loaded before the base element was added to the page. This is possible especially if the experiment library loads really fast after being, for example, cached by the browser.
Simple calculations
Once you have the milestones, you can do simple calculations:
WITH milestones AS (SELECT
  (SELECT value.int_value FROM t.event_params WHERE key = "baseElementAddedToPage") as baseElementAddedToPage,
  (SELECT value.int_value FROM t.event_params WHERE key = "baseElementVisible") as baseElementVisible,
  (SELECT value.int_value FROM t.event_params WHERE key = "experimentLoaded") as experimentLoaded,
  (SELECT value.int_value FROM t.event_params WHERE key = "testElementAddedToPage") as testElementAddedToPage
FROM
  `project.dataset.event_yyyymmdd` t
WHERE
  t.event_name = "optimize_flicker_test")
SELECT
  AVG(injection_delta) as average_injection_delta,
  MIN(injection_delta) as minimum_injection_delta,
  MAX(injection_delta) as maximum_injection_delta,
  AVG(flicker_delta) as average_flicker_delta,
  MIN(flicker_delta) as minimum_flicker_delta,
  MAX(flicker_delta) as maximum_flicker_delta
FROM (
  SELECT
    baseElementAddedToPage,
    testElementAddedToPage-baseElementAddedToPage as injection_delta,
    baseElementVisible,
    testElementAddedToPage-baseElementVisible as flicker_delta,
    experimentLoaded,
    experimentLoaded-baseElementAddedToPage as experiment_delta,
    testElementAddedToPage
  FROM
    milestones
)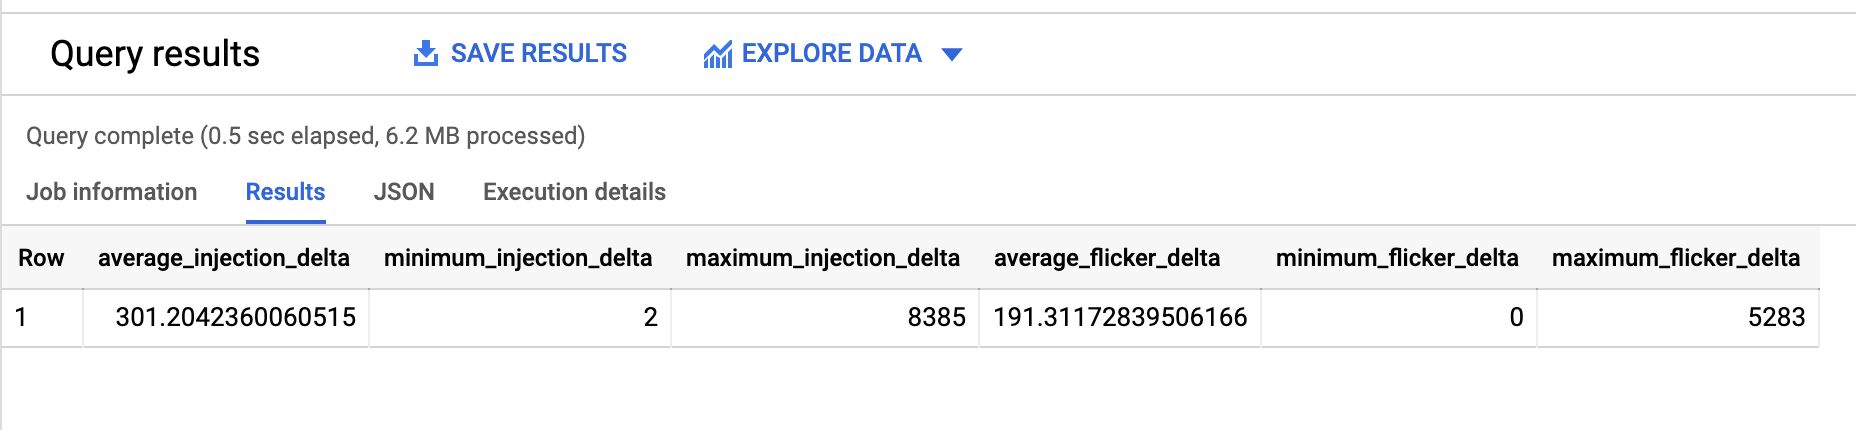
Nothing ground-breaking analysis-wise, but this shows what you could do with the data.
Things to note
OK, so I misled you a bit with the title of this article. The purpose wasn’t to show you how to measure the impact of the flicker, but rather how to collect the data that allows you to measure the impact of the flicker.
With the raw data about element visibility and element injection, you can measure what the delta is and how it impacts conversions, for example. However, this analysis is left for you to calibrate against your unique data set and your unique experiments.
You probably also wondered when reading the setup, “Why isn’t this guy just calculating the delta in the client and sending that to App+Web? Or, better yet, why isn’t he just sending it to Google Analytics?”. Totally valid questions.
I decided to build this experiment around raw, uncalculated data. Many analytics tools have happily promoted the idea that calculated metrics don’t need to be reverse engineerable. This has led to confusion around things like the sessionization schema of Google Analytics, and the weird, quantum fluctuations that seem to govern any data set when you zoom in close enough.
With App+Web, everybody has access to the raw data dump in BigQuery, so I want to start pushing forward the approach where the data you collect is as raw as possible, so that you have full freedom for parsing the data as you wish in BQ.
You are, of course, free to modify the solution however you wish.
Summary
There are some caveats to this experiment. Not all browsers support Mutation- and IntersectionObservers.
There might also be cases where the baseElementVisible simply refuses to fire in time, even if there was a flicker. The single-threadedness of JavaScript has the tendency to mess with callbacks. That’s why I opted to throw the baseElementVisible baby out with the bathwater - if this metric hasn’t been collected by the time all the other metrics have, I’d rather not send it at all rather than send confusing values where the base element became visible after the test element was added.
When setting up this test, just remember these key points:
-
The JavaScript snippets must be added in the page template. If you’re firing Optimize through Google Tag Manager, you could add the Optimize callback in a Custom HTML tag, but there’s still the risk of a race condition ruining everything.
-
You need to update the CSS selectors in the observers to match the element you are measuring. Adding the
data-test="true"(or something similar) to the element in the Optimize editor makes it easier to adjust the observer pattern.
Let me know in the comments if you have additional insights to setting up the test or the subsequent analysis.